When you make a trade, you should have a clear target of where you expect to get out
William Delbert Gann – 1949
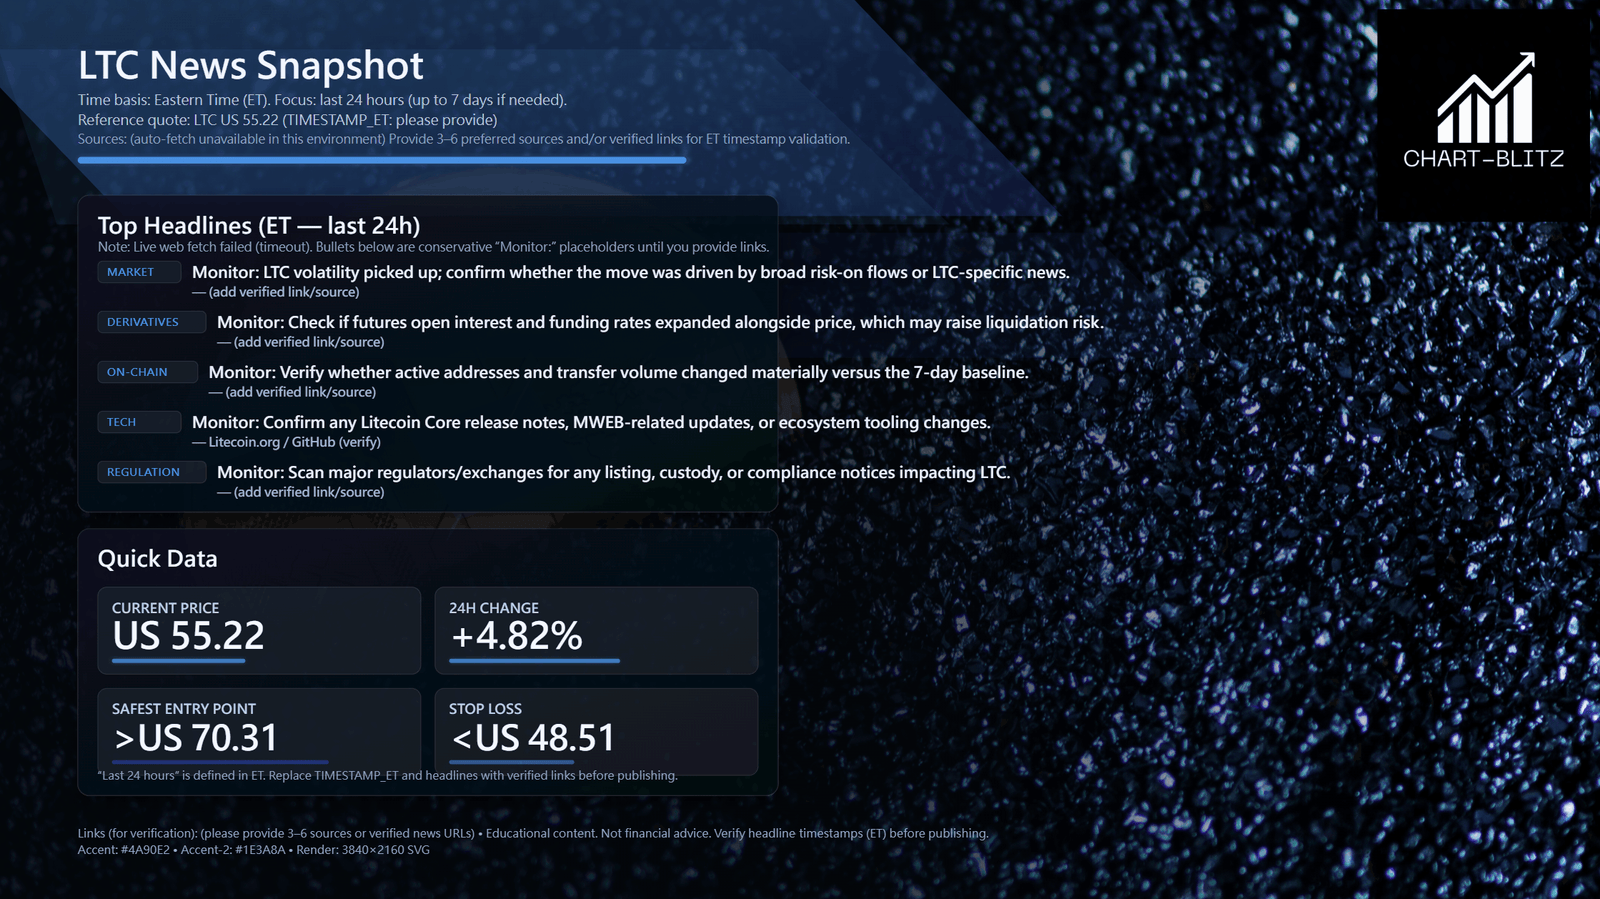
Cheap is Expensive Litecoin (LTC) has broken below $60 and is hovering dangerously close to $53. My inbox is flooded with the same question: “it’s down so much, is this the bottom?”
If you are a retail trader, seeing prices return to multi-year lows triggers a dopamine rush. Your brain tells you: “It’s a bargain! If I buy now and it goes back to $100, I double my money!” This is the classic “Supermarket Discount Mentality.” But in financial markets, this mindset is a terminal disease.
As a former bank trader with 20 years in the trenches, I am here to pour a bucket of ice water on your enthusiasm. When you see “cheap,” I see “weakness.” When you see an “opportunity,” I see a “Liquidity Trap” set by institutions. Today, I’m not going to give you vague advice. I’m going to use the Volume Profile (VPFR)—a tool used by pros—to show you explicitly why buying LTC at $53.78 is financial suicide.
【Analysis Baseline Statement】
All technical analysis below is based on the price snapshot locked on 2026-02-21, 00:55 (ET): LTC (Litecoin) = 53.78 USD. This snapshot provides a stable reference point. All support, resistance, and projected paths are relative to this benchmark. Market prices change instantly; please treat this report as an “analytical map,” not a real-time quote.
Chapter 1: Banker vs. Retail — Why You Keep Losing
Before we dive into the charts, we need to fix your psychology.
- Retail Mindset: Prediction. “I think it’s fallen enough,” “I feel a bounce coming.” Retail traders are obsessed with “guessing the bottom,” trying to catch the absolute lowest tick to brag to their friends.
- Banker Mindset: Confirmation. We never “guess” the bottom. We only enter a trade after a trend reversal is confirmed. We would rather buy at $75 with a high probability of going to $90, than buy at $53 and watch it bleed to $40.
LTC’s current price action is the ultimate test: Are you a gambler, or are you a trader?
Chapter 2: The Illusion of News — The Silence Before the Storm
Over the last 24 hours, the news cycle for LTC has been eerily quiet. Apart from routine hashrate updates, the market lacks a catalyst.
- Retail Interpretation: “No bad news means it won’t drop further. Safe to buy.”
- Pro Interpretation: Low volatility is often the precursor to high volatility. The tight consolidation between $53-$54 is not stability; it is a truce. This silence usually means whales are quietly repositioning for the next leg of the move—which, given the trend, is likely downward.
Chapter 3: Technical Deep Dive — Exposing the Chart’s Lies
1. Weekly Chart: The Historical Cliff Edge
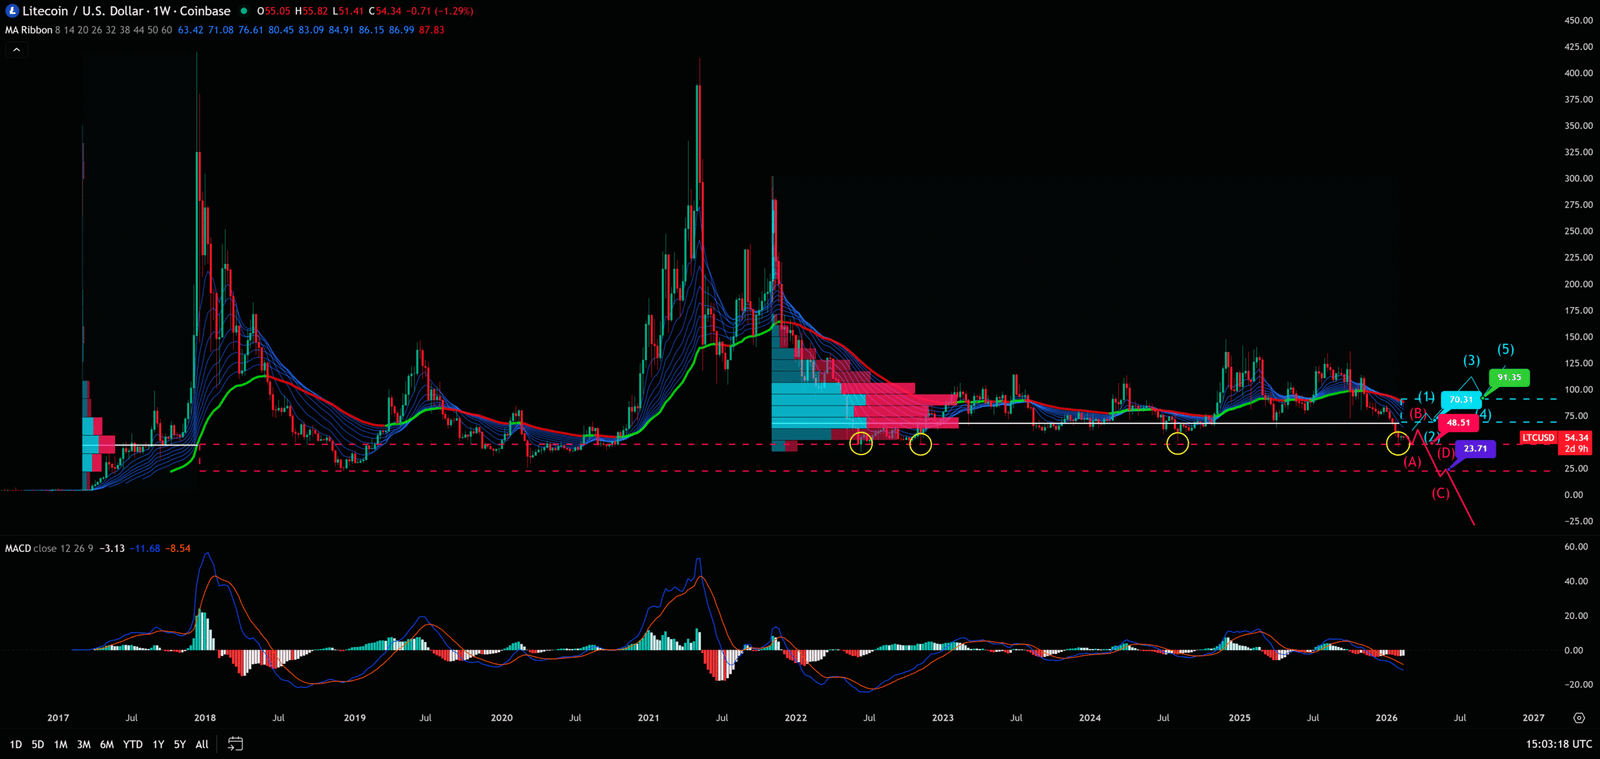
Look closely at the Weekly chart provided. LTC is in a textbook “Lower Highs, Lower Lows” secular bear market structure.
I applied the Volume Profile Fixed Range (VPFR) indicator from 2017 to present, and the results are chilling:
- The Last Stand ($48.51): This isn’t just a random support line. Historically, this was the accumulation zone before the 2017 bull run and the “Iron Floor” during the crashes of June 2022 and August 2024. Current price ($53.78) is only about 10% away from this level. We are standing on the edge of a cliff. If the whales decide to pull their bids, and we get a weekly candle close below $48.51, below us is a “Volume Vacuum.” Price could freefall as it searches for a new, much lower bottom.
- The Great Wall of Supply ($70.31): This is the most critical data point. VPFR shows that $70.31 is the Point of Control (POC)—the price where the most volume has traded over the last few years. Before January 2026, this was support. Now that we are below it, according to the “Support/Resistance Flip” rule, it has become a massive resistance ceiling. Imagine the thousands of retail traders who bought above $70 and are now trapped underwater. As soon as price rallies near $70, these “bag holders” will rush to sell just to break even. This is why I say: Until we clear $70.31, every rally is a trap.
Weekly Timeframe for LTC (Litecoin)


2. Daily Chart: The Perfect Descending Channel
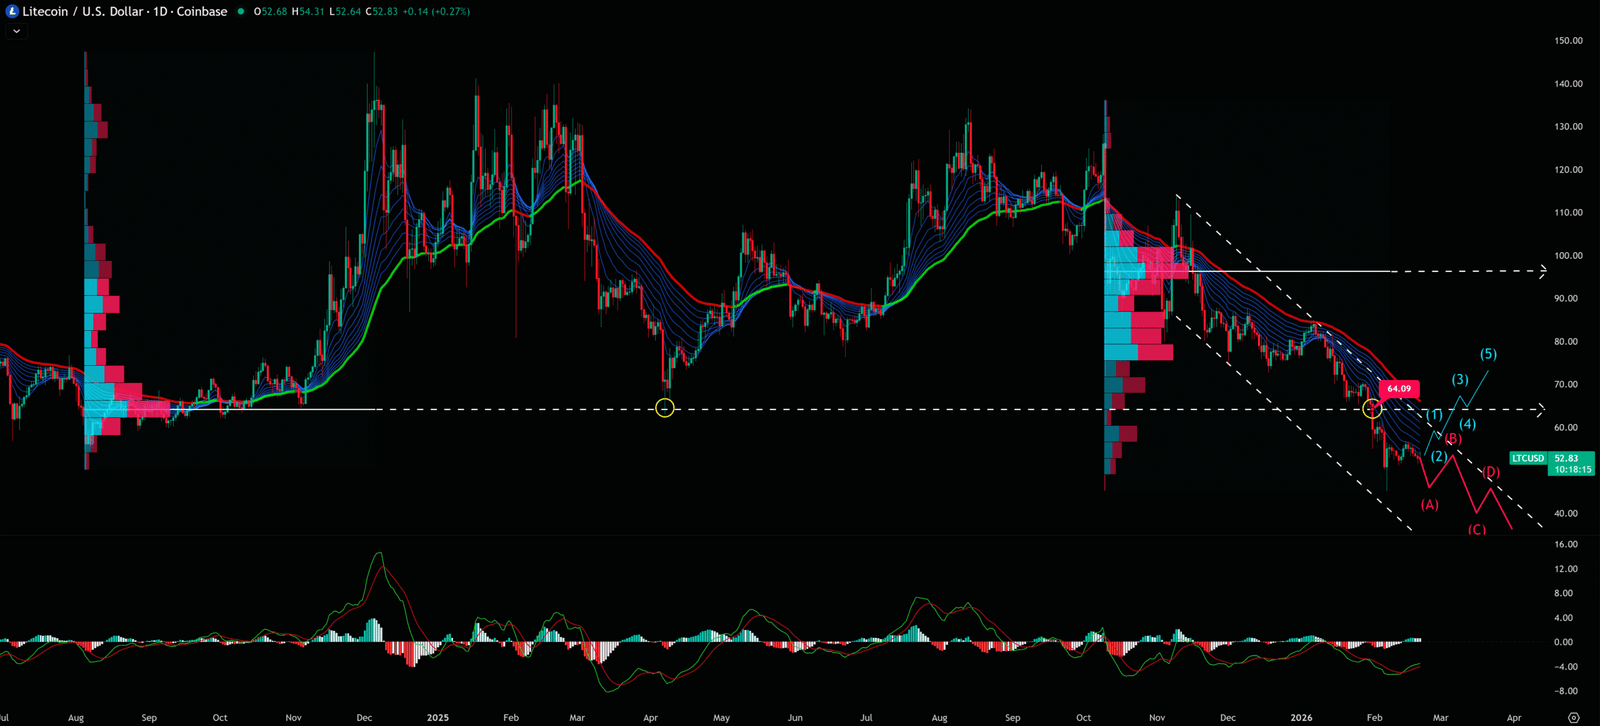
Switching to the Daily chart, the desperation is even clearer.
- Trend Channel: Price is being perfectly suppressed within a descending channel. Every bounce fails to break the channel top and results in a lower low.
- The MACD Trap: Many rookies see the MACD lines crossing up below the zero line and rush to buy. Wrong! In a strong downtrend, a bullish crossover below zero is often a “Fake Signal.” It’s merely a pause in the selling pressure, designed to lure in “dip buyers” before the next slaughter.
- The Confirmation of Weakness: Look at $64.09. This was key support in January. It was smashed by a massive red candle. This action confirmed that Sellers are in total control, and Buyers have zero power.
Daily Timeframe for LTC (Litecoin)
Chapter 4: The Banker’s Playbook
So, is the situation hopeless? Should we never buy? Of course not. As professional traders, we have no emotions, only signals. Here is my battle plan for LTC. Feel free to copy it:
- Scenario A: The Wait (90% Probability) As long as price is between $48.51 (Support) and $70.31 (Resistance), we are in “No Man’s Land.” Trading in this zone offers a terrible Risk/Reward ratio. You face resistance above and a cliff below. The best move here is to do nothing.
- Scenario B: The Breakout (10% Probability – The Only Buy Signal) If, and only if, LTC can blast through $70.31 with massive volume and close a daily candle firmly above it (ideally 3 consecutive days). Only then will I admit the trend has reversed and start buying, targeting $91.35. This is when bankers enter—we buy higher, but we buy with certainty.
- Scenario C: The Stop Loss (Must-Read for Holders) If you are unfortunate enough to be holding LTC right now, watch $48.51 like a hawk. If the daily close drops more than 0.5% below this level, you must cut your losses immediately. Do not hesitate. Do not hope for a bounce. Preserve your capital so you can live to fight another day.
Key Takeaways
Summary / Key Levels: Patience is a Skill. Here is my operational plan:
⛔ Critical Support (Stop Loss / The Line of Death): < US 48.51
- This is the final line of defense. If the Daily candle closes below US 48.51, the downtrend accelerates into a vacuum. (Invalidation level; execute mercilessly)
- Action: If you are holding, this is your hard Stop Loss. Do not hope. Do not pray. If this breaks, the floor is gone.
🛡️ The Safe Entry (The Banker’s Trigger): > US 70.31
- Want to go Long? Not yet. Sit on your hands. Unless BTC can break US 70.31 with a strong bullish candle and hold above it for 3 consecutive days.
- Logic: Only a reclaim of this level proves that the overhead “bag holders” have been absorbed. That is the only high-probability entry.
Our goal is not to provide a crystal ball, but to offer a clear, logical, and actionable framework by simplifying professional analysis.
Conclusion: Hunter or Prey?
Trading isn’t about who buys the most; it’s about who survives the longest. LTC right now is like cheese on a mousetrap. The $53 price tag is tempting, but the snap below $48.51 will break your fingers. Don’t try to catch a falling knife. Put your wallet away, go grab a coffee, and wait for the breakout at $70.31. That is how winners play the game.
Remember, Cash is a position too.
Unlocking Technical Analysis: Power Moves with Diagrams !
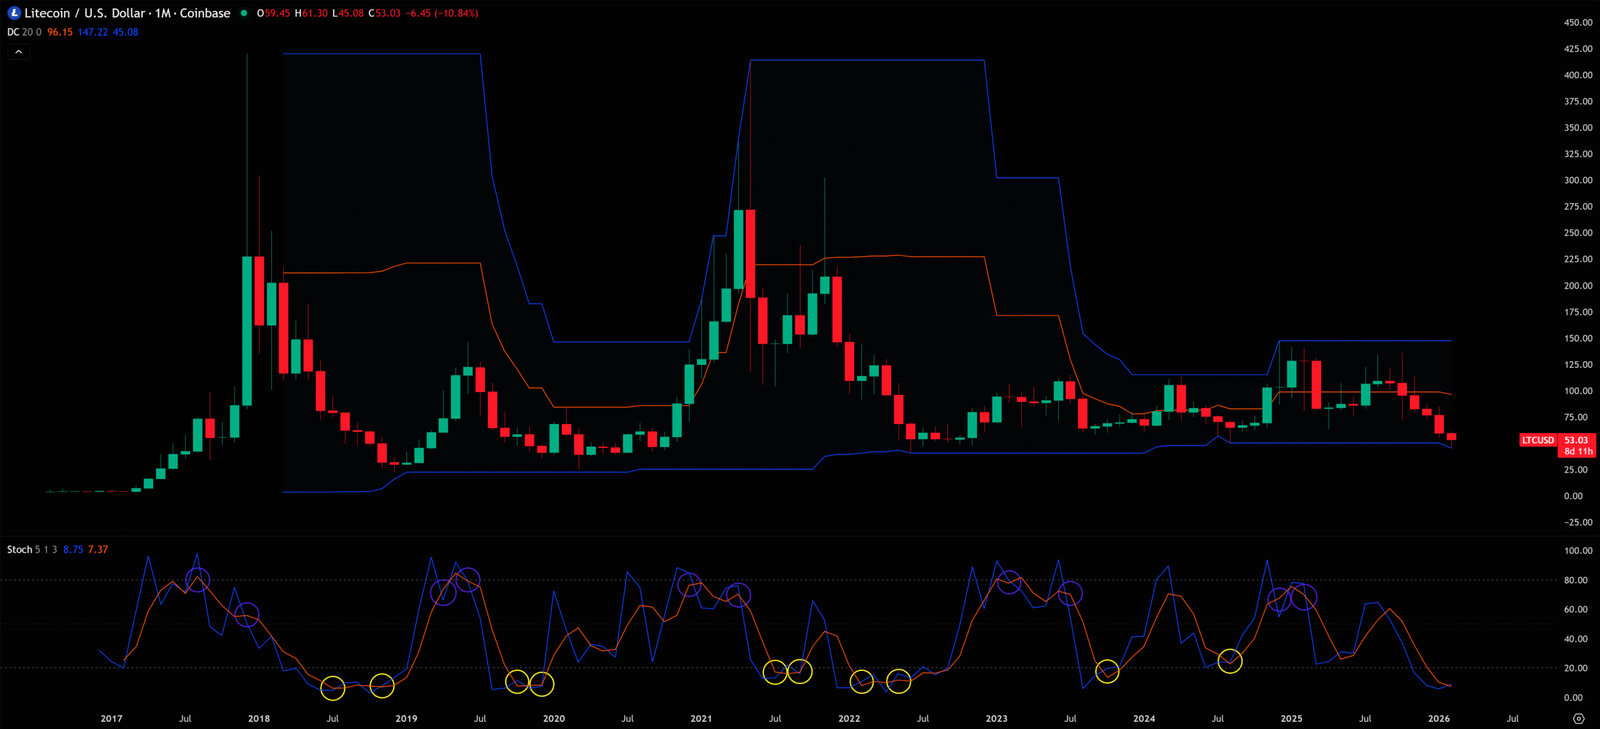
Monthly Timeframe for LTC (Litecoin)
4-Hour Timeframe for LTC (Litecoin)
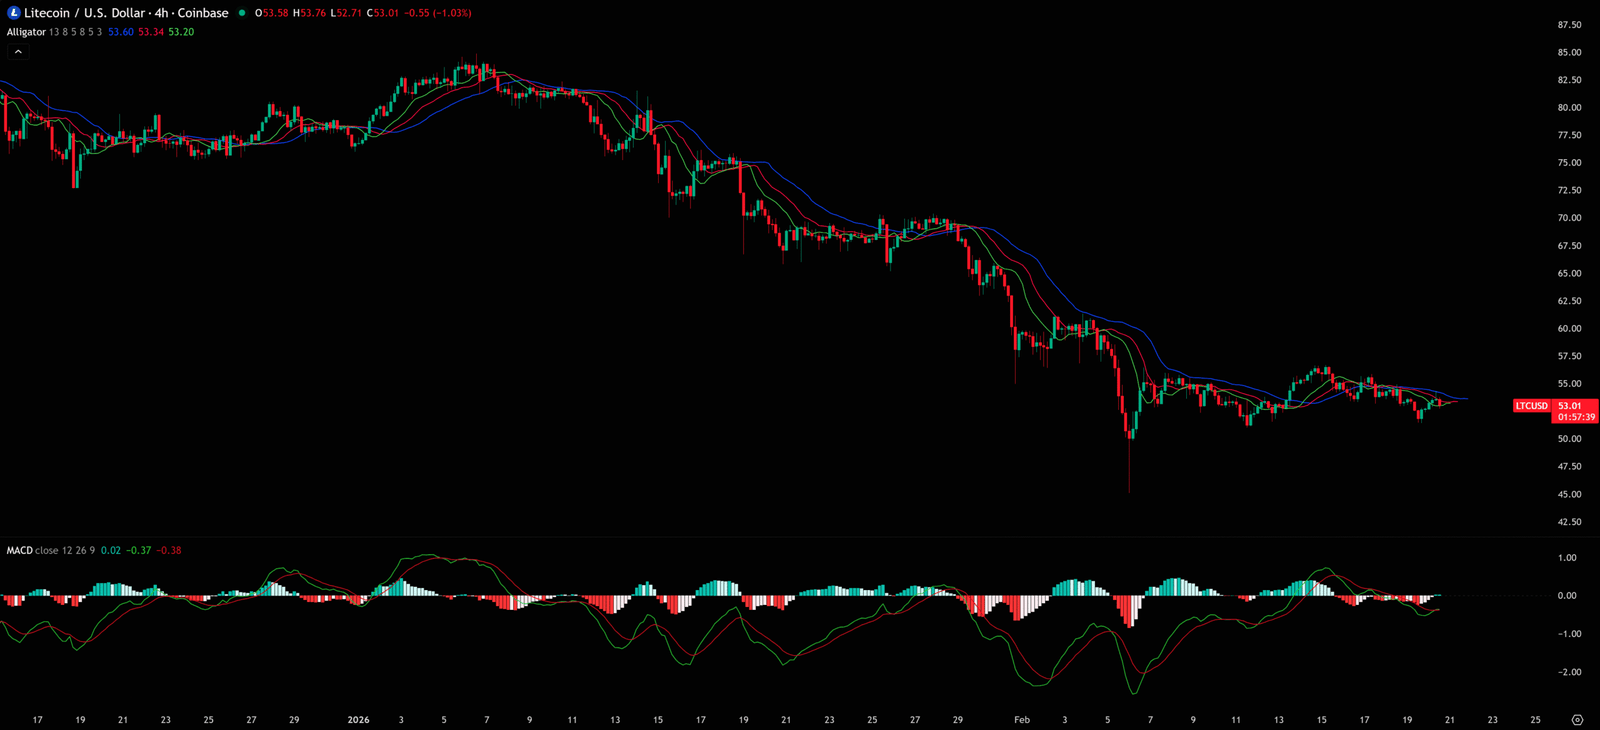
Charts don’t lie, but you have to learn their language.
Want to see our full, interactive chart breakdown? If you want to learn how to draw Fibonacci Retracement Ratio yourself, identify S/R Flips, and stop trading blind. Please browse the following『Further Reading』links. Fundamental news tells you what happened. Technical analysis predicts what will happen. To master the professional framework that separates market signal from noise, explore our exclusive models at www.chart-blitz.com.
Further Reading:
- https://www.chart-blitz.com/macd-mastery-decode-market-swings-like-a-pro-dont-miss-out/
- https://www.chart-blitz.com/volume-profile-vpfr-find-the-real-battle-zones-on-the-chart/
- https://www.chart-blitz.com/fibonacci-retracement-the-magic-numbers-behind-every-support-resistance/
- https://www.chart-blitz.com/alligator-indicator-know-when-the-market%e3%80%8ewakes-up%e3%80%8ffor-big-moves/
- https://www.chart-blitz.com/stochastic-oscillator-short-term-traders-secret-weapon/
- https://www.chart-blitz.com/donchian-channels-the-breakout-hunters-best-friend/
【Disclaimer】 The content herein is for educational purposes and reflects the author’s personal opinion only; it is not investment advice. All financial investments, including cryptocurrencies, carry significant risk, and you could lose your entire capital. To support this site, this article may contain affiliate links. While we strive for accuracy, we cannot guarantee all information is complete or error-free. Please conduct your own research and be fully responsible for your own investment decisions.