The speculator’s chief enemies are always boring from within. It is inseparable from human nature to hope and to fear
William Delbert Gann – 1949
TRON (TRX) has plummeted from its recent highs, and the retail forums are bleeding. “Is it going to zero?” “Is Justin Sun dumping on us?” “Should I sell now to save what’s left?” In my 20 years on institutional trading desks, I have heard these cries of panic thousands of times.
As a former banker, I want to share a brutal truth with you: 90% of market news and sentiment is a tool used by Smart Money to shake you out of your position. While you stare at the ticker with trembling hands, debating whether to cut your losses, our algorithms are programmed to scoop up your blood-stained coins. Today, I won’t give you vague, politically correct advice. I will use a raw “Banker’s Perspective” to deconstruct the real market structure behind the TRX headlines and teach you an internal strategy we call the “Crypto Daily Divergence Setup.” By the end of this article, you will understand why $0.258 is hell for retail, but heaven for whales.
【Analysis Benchmark Statement】
All technical analysis below is based on a price snapshot taken on December 5, 2025, at 18:30 (HKT): TRX = 0.2869 USD. This snapshot provides a stable reference point. All support, resistance, and projected paths are relative to this benchmark. Market prices change instantly; please view this report as an “analytical map,” not a real-time quote.
Catalyst & Fundamental View (Rearview Mirror): News is for the Sheep
First, let’s talk about the news. Recent headlines highlight TRON’s ecosystem expansion and its stablecoin market cap surpassing $80 billion. This is objectively bullish data. So why is the price crashing? A novice asks: “Why is the price down on good news?” A veteran says: “Sell the news.” A Banker says: “News is used to engineer Liquidity.”
When the news screams “Strong Fundamentals,” the price has usually already rallied. When the market starts to panic and headlines turn skeptical, that is often where the bottom lies. The current correction in TRX is essentially a “Leverage Flush.” The fundamentals haven’t changed; what’s changing is the ownership of the coins—from “Weak Hands” to “Strong Hands.”
Multi-Timeframe Technical Deep Dive (The Predictive Lens): The Banker’s Scalpel
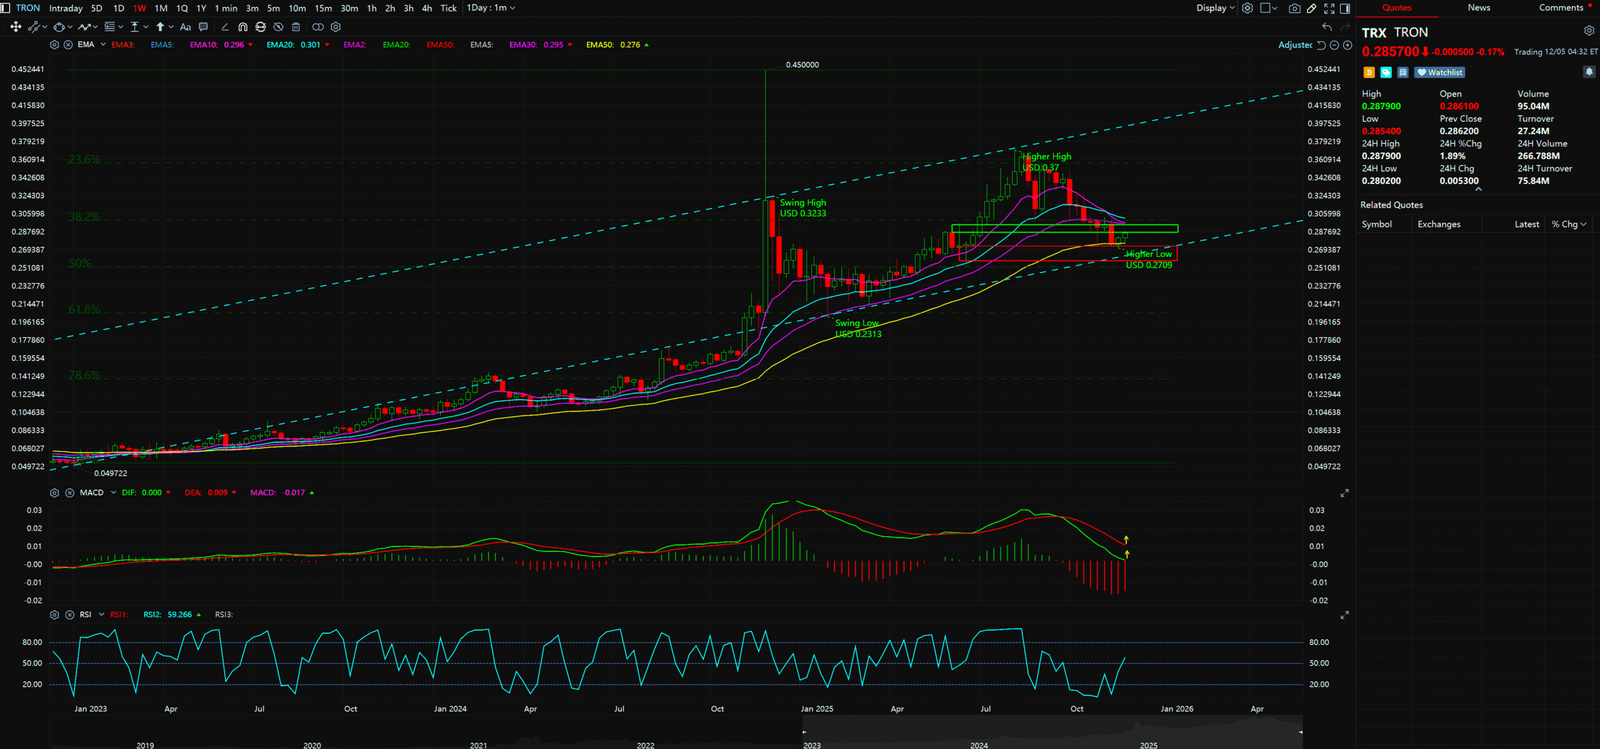
1. Weekly Chart: The Whale’s “God View” Retail traders lose money because they zoom in on the 15-minute or 1-minute charts, getting chopped up by noise. But when we deploy large capital, we start with the Weekly chart. From Weekly Chart, I see a pristine, almost “Textbook” Ascending Parallel Channel.
- Structure Remains Intact: Despite the sharp drop over the last two weeks, if you zoom out, TRX is maintaining a classic “Higher Highs, Higher Lows” bull market structure. As long as the price does not break the previous major low, every drop is a “Retracement,” not a “Reversal.”
- The Accumulation Zone: Based on the channel’s slope, the new “Higher Low” is projected to land between $0.2709 and $0.264. This zone is the pre-defined “Defense Line” for institutional bulls.
- MACD Double Bull Setup: The MACD (12,26,9) on the secondary chart shows that while the histogram is receding, both signal lines remain firmly above the Zero Axis. In technical analysis, a “Golden Cross above Zero” is known as a “Double Bull Signal”—one of the strongest buy indicators in existence. The current dip is likely resetting the indicators to fuel the next leg up.
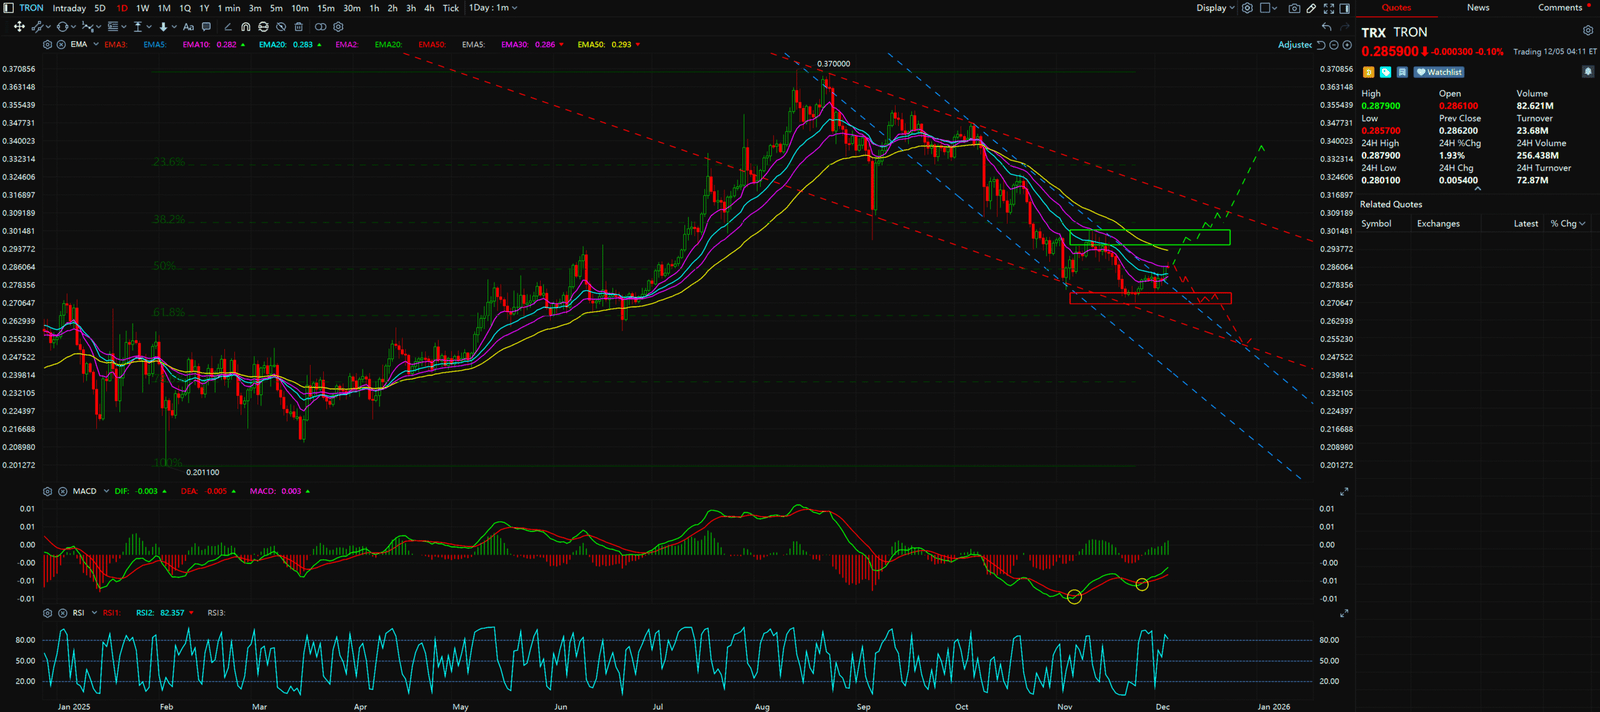
2. Daily Chart: A Million-Dollar Lesson on “Divergence Strategy” Moving to the Daily Chart, I want to teach you a concept that, if mastered, puts you ahead of 80% of retail traders. It is called “Bullish Divergence.”
- What is Bullish Divergence? Compare the TRX Price action with the MACD indicator.
- Price: On the chart, TRX is making Lower Lows, creating the illusion of an unstoppable crash.
- Momentum: However, the MACD Histogram below is making Higher Lows, with the red bars shortening.
- The Banker’s Read: This phenomenon signals “Seller Exhaustion.” Although the price is still sliding due to inertia, the selling pressure has drastically faded. It’s like a car rolling downhill while the driver is already slamming on the brakes. This is typically the first signal of a trend reversal.
- The Fibonacci “Golden Pocket” Strategy: Beyond divergence, we need “Location.” By drawing a Fibonacci Retracement from the August lows to the November highs, we find a critical confluence. TRX is dropping precisely into the 0.618 (61.8%) retracement level, which sits at the $0.273 – $0.258 range. On Wall Street, the 0.618 level is known as the “Golden Pocket.” Why? Because thousands of Algo Trading Bots are programmed to automatically bid in this zone.
- The Strategy Logic: When a “Bullish Divergence” (Timing) meets the “Golden Pocket” (Location), the Win Rate increases geometrically.
Synthesis & Unique Insight: The Banker’s Script
Retail Sees Danger, Banker See Opportunity Combining the Weekly macro-trend with the Daily precision signals, we derive a clear script: TRX is currently in an awkward, yet incredibly attractive position.
- Awkward: The current price of $0.2869 is in “No Man’s Land”—below resistance ($0.30) and above support ($0.258).
- Attractive: Market sentiment is peak bearish. According to “Contrarian Theory,” the bottom is often found when retail is hopeless. The likely scenario for Smart Money is: Use the panic to drive the price down to $0.273 or even wick it down to $0.258 to trigger retail Stop Losses (Stop Hunt), collect the liquidity, and then launch a violent reversal fueled by the MACD Divergence.


Key Takeaways
As a smart trader, you shouldn’t predict; you should “react.”
- Immediate Resistance (Take Profit 1): $0.295 – $0.300 (Short-term pressure zone; consider trimming here).
- Core Buy/Support Zone (The Kill Zone): $0.273 – $0.258 (Watch closely for reversal candles like Hammer or Doji here).
- Invalidation Level (Stop Loss): Below $0.258
- WARNING: If the Daily candle closes below $0.258, the structure is broken, and the bull thesis is invalid. You must cut losses ruthlessly to preserve capital.
Our goal is not to provide a crystal ball, but to offer a clear, logical, and actionable framework by simplifying professional analysis.
Unlocking Technical Analysis: Power Moves with Diagrams !
Weekly Timeframe for TRON (TRX)
Daily Timeframe for TRON (TRX)
For continuous, real-time analysis of these developing market structures, visit www.chart-blitz.com.
Fundamental news tells you what happened. Technical analysis predicts what will happen. To master the professional framework that separates market signal from noise, explore our exclusive models at www.chart-blitz.com.
Sources:
- https://www.coingecko.com/en/coins/tron
- https://coinmarketcap.com/currencies/tron/
- https://www.tradingview.com/symbols/TRXUSD/
【Disclaimer】 The content herein is for educational purposes and reflects the author’s personal opinion only; it is not investment advice. All financial investments, including cryptocurrencies, carry significant risk, and you could lose your entire capital. To support this site, this article may contain affiliate links. While we strive for accuracy, we cannot guarantee all information is complete or error-free. Please conduct your own research and be fully responsible for your own investment decisions.


