When you make a trade, you should have a clear target of where you expect to get out
William Delbert Gann – 1949
Wall Street Has No Philanthropists, Only Hunters. In my 20 years on the bank trading floor, whenever the market took a sharp dive, I witnessed the same heartbreaking phenomenon: retail investors rushing in like moths to a flame, trying to catch a falling knife.
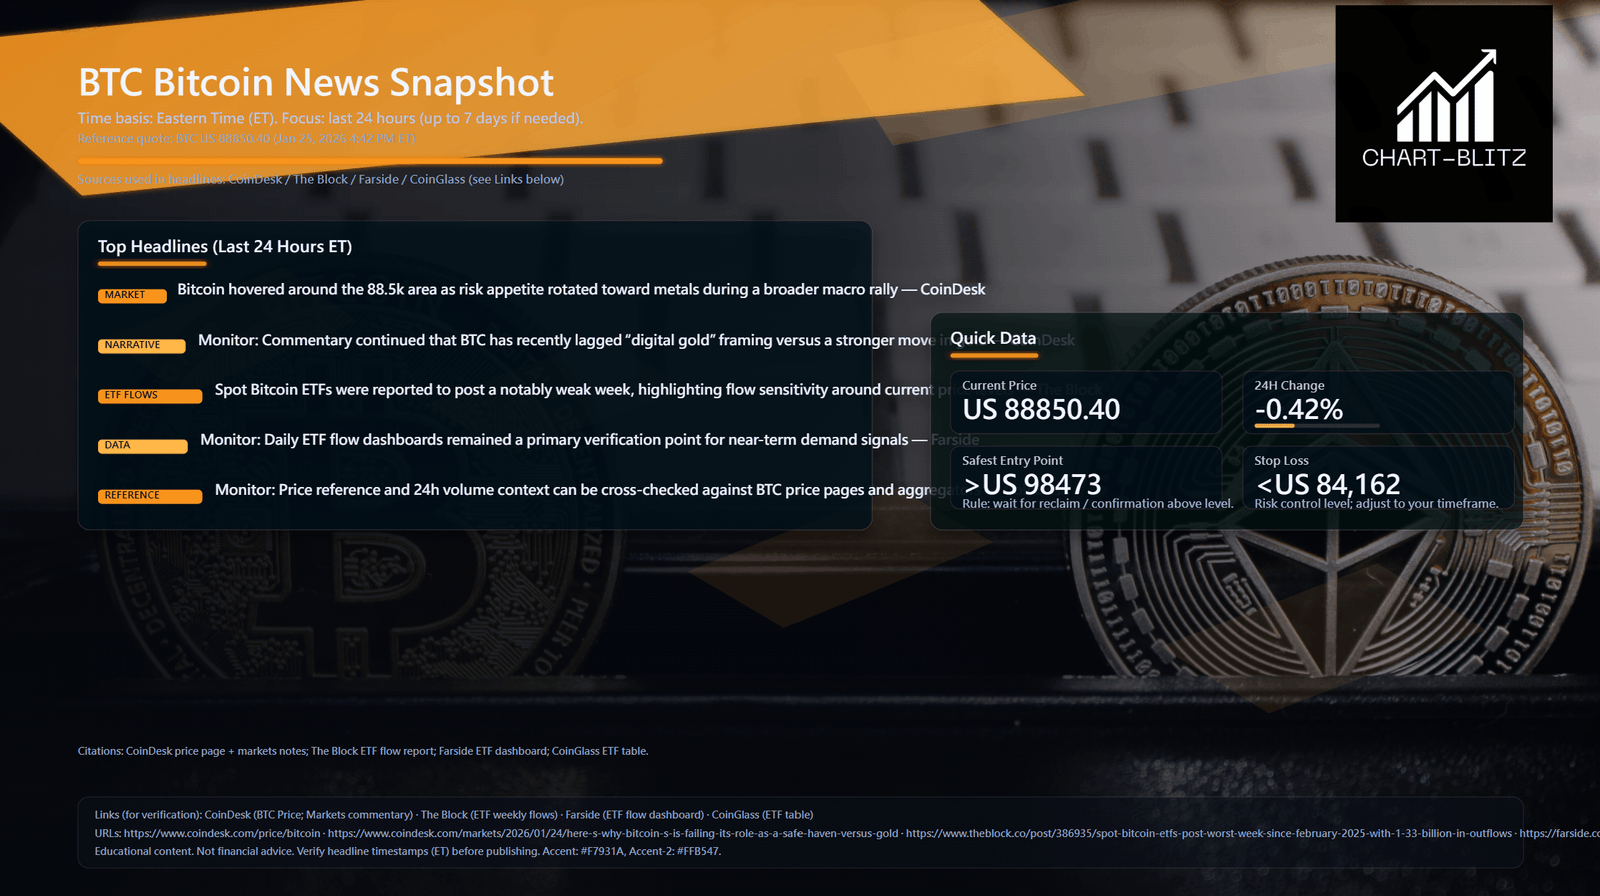
Today, looking at my terminal with BTC hovering around $88,850.40 (down a marginal 0.42% in 24 hours), I don’t smell “opportunity.” I smell blood. While forums and influencers scream “Buy the Dip,” and CoinDesk headlines politely describe it as a “rotation to metals,” my institutional instinct is screaming something else entirely.
As someone who used to sit on the institutional side, watching how “Smart Money” harvests “Dumb Money,” I need to be brutally honest with you: This is not a discount sale. This is a classic Liquidity Trap.
If you don’t want your capital to become the profit margin for an institutional quarterly report, take 10 minutes to read this deep dive. Using Andrews Pitchfork structural analysis and Volume Profile (VPFR), I will explain why $88k is a “No-Go Zone” for professionals.
【Analysis Baseline Statement】
The following technical analysis is based on a price snapshot taken on January 25, 2026, at 16:42 (ET): BTC (Bitcoin) = 88,850.40 USD. This snapshot provides a stable reference point for analysis. All support, resistance, and projected paths are relative to this baseline. Market prices are volatile; please treat this report as an “analytical map,” not a real-time quote.
Chapter 1: The Fundamental Smoke Screen – News Explains the Past, Not the Future
First, learn to filter the noise. Retail trades on news; Institutions trade on flows.
Recent briefs report that Spot Bitcoin ETFs have posted a “notably weak week.” Farside data confirms persistent outflows. Retail traders ask, “Why are they leaving? Is there bad news?”
You have the causality backwards. The bad news didn’t cause them to leave; they left, and now the market is finding a narrative to explain the price drop.
The core narrative has cracked. Bitcoin was sold as “Digital Gold,” a hedge against inflation. But as we see capital rotating aggressively from Crypto into traditional Metals, Wall Street’s Risk Models have shifted. They no longer view BTC as a safe haven, but as a High-Beta risk asset to be shed. When the “Digital Gold” story fades, a key pillar of valuation collapses. Trading on “faith” now is financial suicide.
Chapter 2: The Weekly Chart Verdict – Gravity Failure on the Andrews Pitchfork
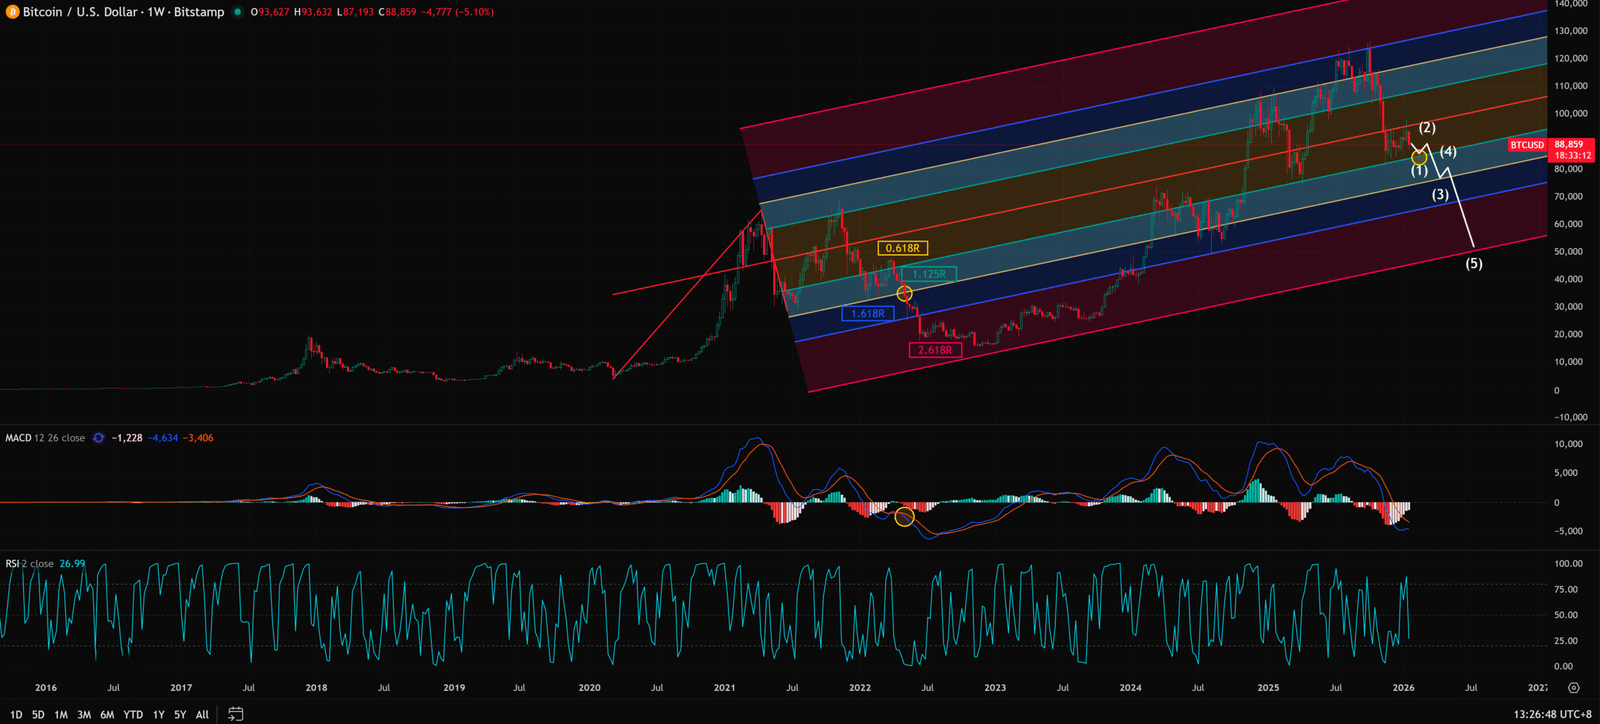
Charts don’t lie, if you know how to listen. While amateurs draw simple trendlines, professional desks use physics-based tools like the Andrews Pitchfork.
Using anchor points from March 9, 2020 (P0), April 12, 2021 (P1), and June 21, 2021 (P2), I’ve mapped BTC’s probability path. Dr. Andrews’ core theory is “Return to the Median”—price gravitates towards the center line.
1. Structural Breakdown Look closely at the Weekly Chart. BTC broke below the 0.618R Lower Median Line (LML) back in May 2022. Although we saw a recovery channel of “Higher Highs and Higher Lows,” do not be deceived.
In the macro view, price is still trapped below the Pitchfork’s gravitational pull. The recent pullback isn’t just profit-taking; it’s a re-confirmation of overhead resistance. When price fails to reclaim the median, probability dictates a visit to the lower parallel lines.
2. MACD: Breathing Underwater What chills me most is the MACD (12, 26, 9). To retail, it’s just lines crossing. To a banker, it defines the “Market Regime.” Currently, both the MACD and Signal lines on the Weekly chart are below the Zero Axis. Rule #1: Below Zero is Bear Territory. When MACD runs underwater, every rally is guilty until proven innocent—likely a “Dead Cat Bounce.” Being Long here is like trying to light a match underwater. The momentum is simply not on your side.
Weekly Timeframe for BTC (Bitcoin)
Chapter 3: The Daily Chart Trap – The VPFR “Bag Holder” Wall
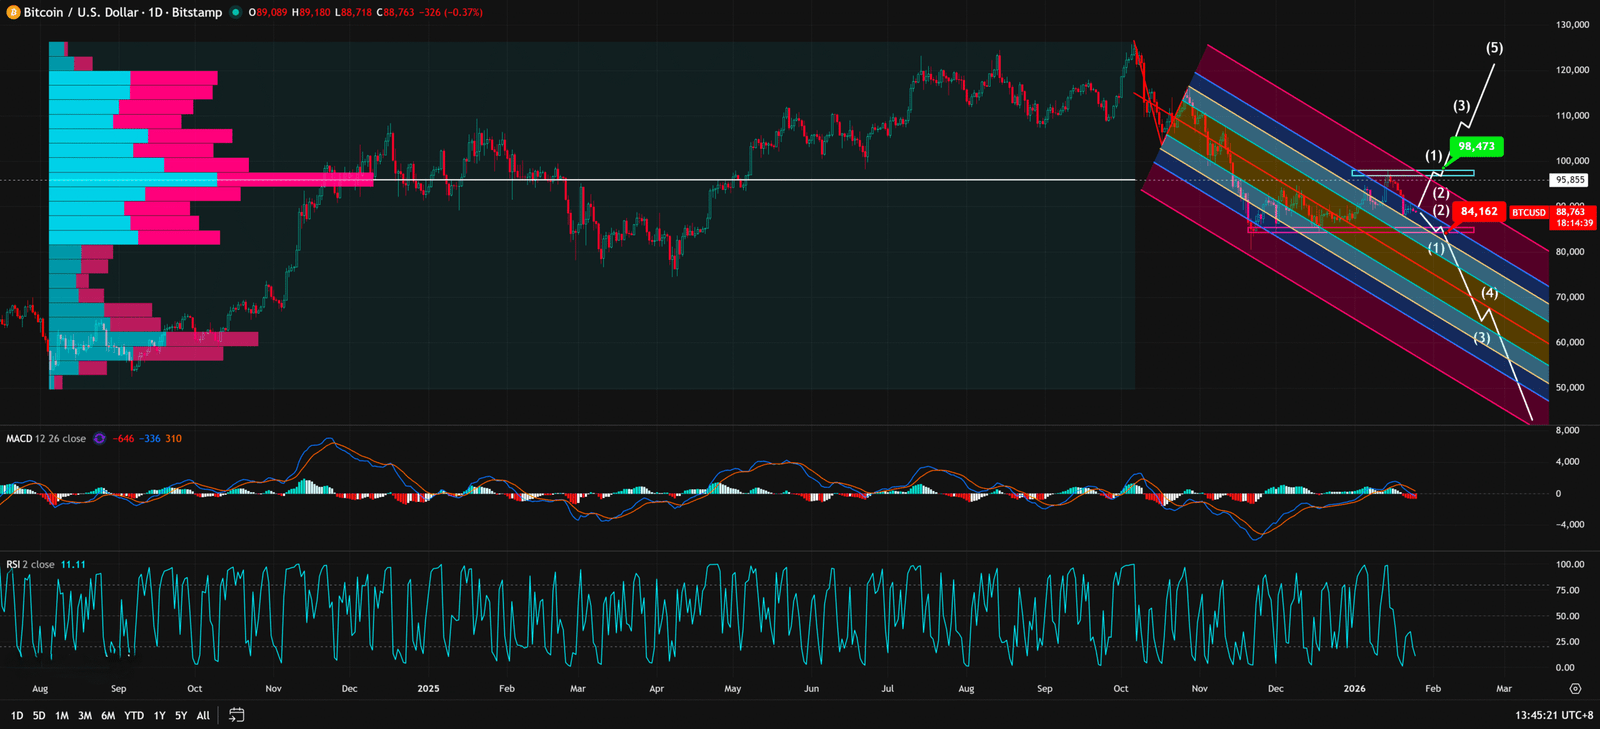
If the Weekly chart is the strategy, the Daily chart is the battlefield. Here, the Volume Profile Fixed Range (VPFR) acts as our radar, revealing where the enemy (trapped supply) is hiding.
1. Judgment Day: November 14, 2025 Burn this date into your memory. On this day, BTC’s closing price officially broke below the massive Value Area accumulated from April to October 2025.
What does this mean? It means billions of dollars bought above $95,583 are now “underwater.” These positions are now the market’s “ceiling.”
2. The Psychology of “Break-Even” Imagine you bought at $96k. Price drops to $88k. You aren’t thinking about profit anymore. You are praying: “Just let me get back to break-even so I can get out!” This is why $95,583 is a formidable wall. As price approaches this level, this army of trapped buyers will sell to exit, creating massive Overhead Supply.
3. Momentum Confirmation The Daily MACD signal line just crossed below zero on January 24, 2026. This is a fresh “Weakness Confirmation.” It signals that short-term momentum has officially flipped from Bullish to Bearish.


Daily Timeframe for BTC (Bitcoin)
Chapter 4: The Banker’s Game Theory – How to Avoid Being “Liquidity”
Combining the structural weakness on the Weekly chart with the trapped volume on the Daily chart, the conclusion is clear: BTC is in “No Man’s Land.”
Retail sees $88k and thinks “Cheap.” As an ex-banker, I see massive resistance above and an unconfirmed abyss below.
Why do I call it a “Liquidity Trap”? Because Market Makers love to engineer fake bounces at obvious levels (like $88k) to lure retail in, only to smash the price down to trigger your Stop Losses. Your Stop Loss is their liquidity to cover their shorts. Don’t be their lunch.
Key Takeaways
Summary / Key Levels: Stop guessing. Let the market dictate. Here is my operational plan:
⛔ Critical Support (Stop Loss / The Line of Death): < US 84,162
- This is the final line of defense. If the Daily candle closes below $84,162, the downtrend accelerates into a vacuum.
- Action: If you are holding, this is your hard Stop Loss. Do not hope. Do not pray. If this breaks, the floor is gone.
🛡️ The Safe Entry (The Banker’s Trigger): > US 98,473
- Want to go Long? Not yet. Sit on your hands. Unless BTC can break $98,473 with a strong bullish candle and hold above it for 3 consecutive days.
- Logic: Only a reclaim of this level proves that the overhead “bag holders” have been absorbed. That is the only high-probability entry.
Our goal is not to provide a crystal ball, but to offer a clear, logical, and actionable framework by simplifying professional analysis.
Summary: Better to Miss Out than to Wipe Out
$88,850 is not an opportunity; it’s a trap. As a retail trader, your superpower is the ability to sit in Cash. Bankers have quotas; you don’t. In this asymmetric war, Patience is your only weapon. Wait for the test of 84,162 or the reclaim of 98,473. Leave the chop in the middle for the gamblers.
Unlocking Technical Analysis: Power Moves with Diagrams !
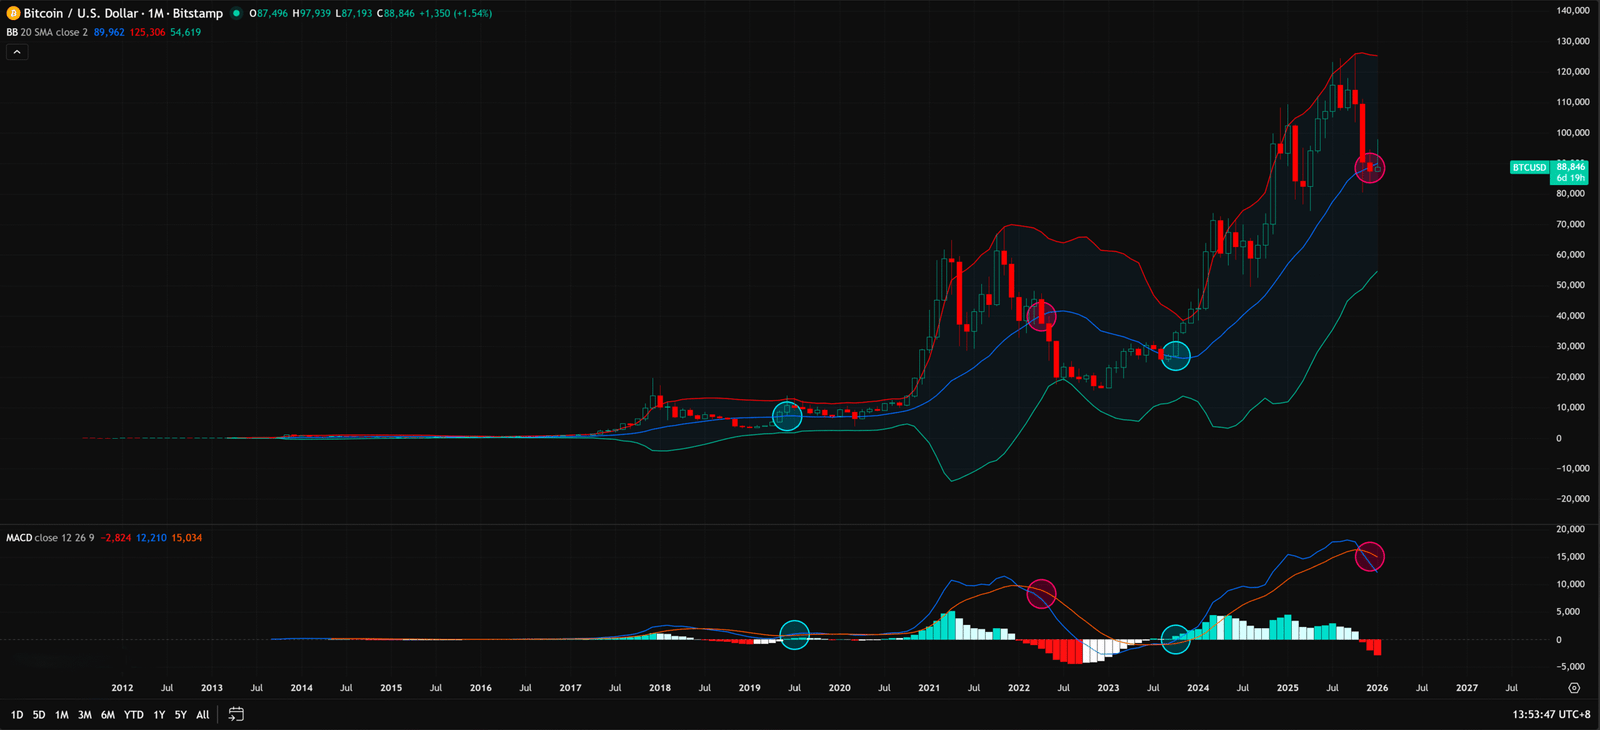
Monthly Timeframe for BTC (Bitcoin)
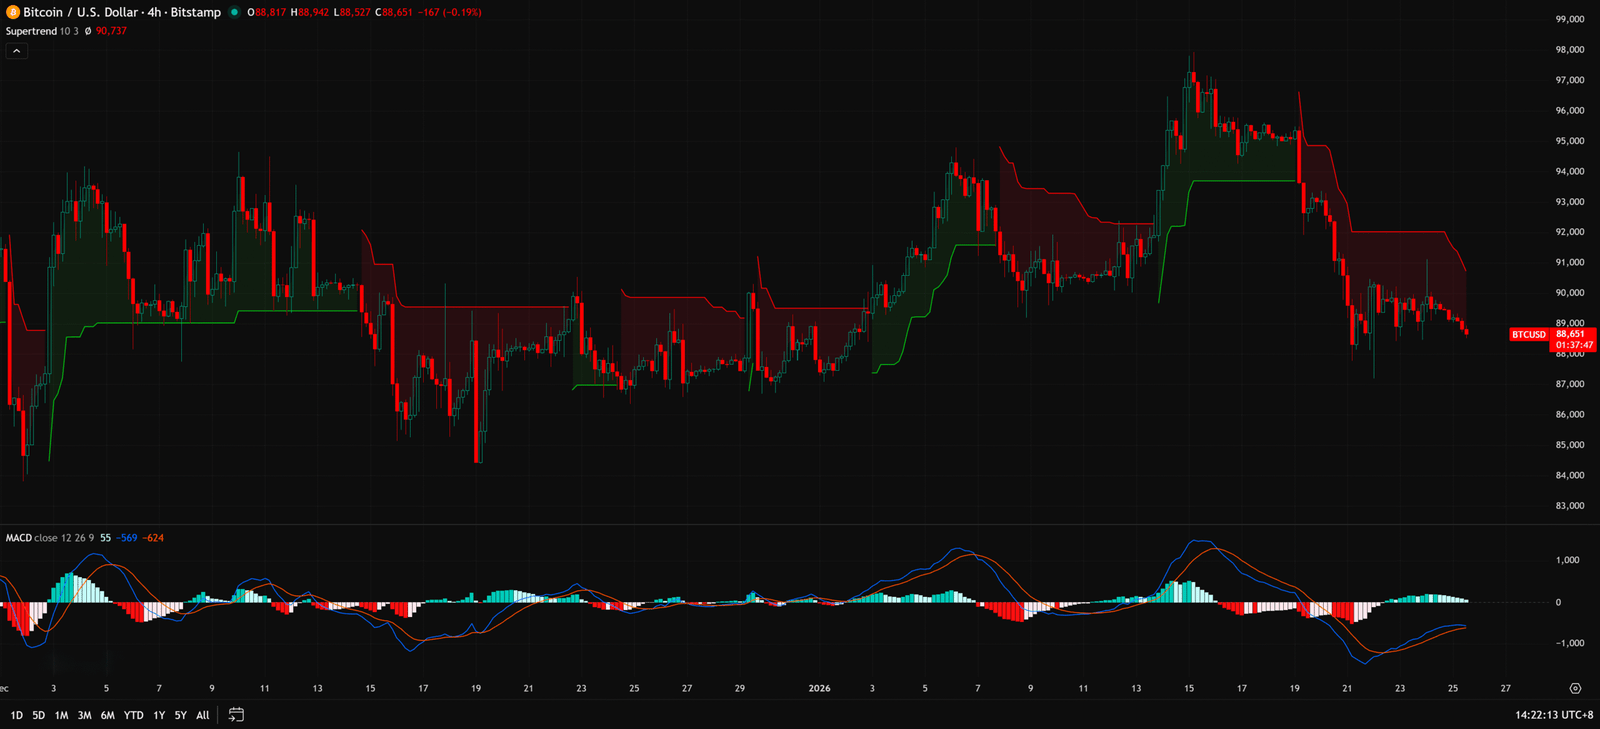
4-Hour Timeframe for BTC (Bitcoin)
Charts don’t lie, but you have to learn their language.
For our complete, interactive chart breakdown and to learn how to set up Pitchfork parameters like a pro. Please browse the following『Related Articles』links. Fundamental news tells you what happened. Technical analysis predicts what will happen. To master the professional framework that separates market signal from noise, explore our exclusive models at www.chart-blitz.com.
Related Articles:
- https://www.chart-blitz.com/pitchfork-the-three-line-tool-pros-use-to-map-the-market/
- https://www.chart-blitz.com/volume-profile-vpfr-find-the-real-battle-zones-on-the-chart/
- https://www.chart-blitz.com/supertrend-indicator-one-line-all-your-buy-sell-signals/
- https://www.chart-blitz.com/macd-mastery-decode-market-swings-like-a-pro-dont-miss-out/
- https://www.chart-blitz.com/rsi-the-go-to-signal-before-every-pump-or-dump/
【Disclaimer】 The content herein is for educational purposes and reflects the author’s personal opinion only; it is not investment advice. All financial investments, including cryptocurrencies, carry significant risk, and you could lose your entire capital. To support this site, this article may contain affiliate links. While we strive for accuracy, we cannot guarantee all information is complete or error-free. Please conduct your own research and be fully responsible for your own investment decisions.