The speculator’s chief enemies are always boring from within. It is inseparable from human nature to hope and to fear
William Delbert Gann – 1949
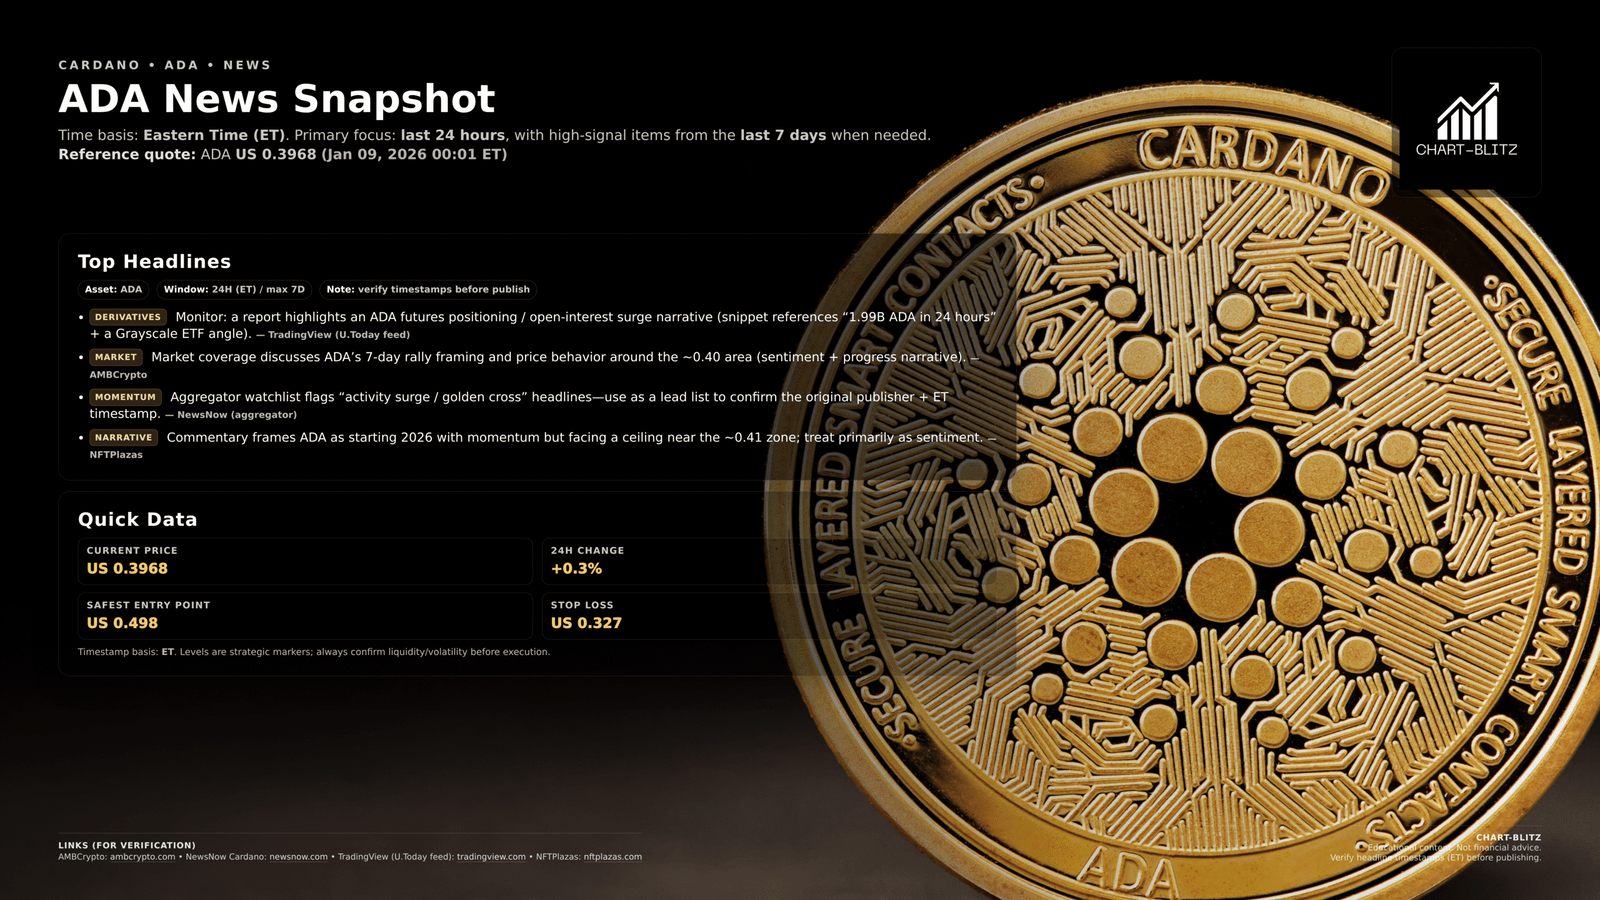
The “Good News” You See is Often Their “Exit Liquidity”. Cardano (ADA) is back in the eye of the storm. With major U.S. banks loudly announcing their entry into the crypto ETF space, market sentiment has hit a fever pitch. Financial media and influencers are screaming “Bull Run Returns” and “Institutional Entry,” causing retail investors (FOMO) to scramble, terrified of missing out.
However, as a former trader who spent 20 years in banking trading rooms witnessing institutional warfare, I must pour a bucket of cold water on this fire: When headlines scream “BUY,” it is often the exact moment “Smart Money” is preparing to distribute positions or use your liquidity to suppress prices for accumulation.
Today, I won’t give you vague “it might go up, it might go down” nonsense. I will ask you to put on “Banker’s Glasses” and use cold, hard charts to decode the real capital flows behind the news hype. If you don’t want to be institutional prey again, spend 10 minutes reading this analysis.
【Analysis Benchmark Statement】
All technical analysis below is based on the price snapshot locked on Jan 9, 2026, 15:56 (EST): ADA = 0.3980 USD. This snapshot provides a stable reference point. All support, resistance, and projected paths are relative to this baseline. Market prices are volatile; please view this report as an “analytical map,” not a real-time quote.
Catalyst & Fundamental View (Rearview Mirror): Is News for Reading or for Exploiting?
Chart data indicates the market is digesting the massive news of “Major U.S. banks entering the crypto ETF space.” On the surface, this is a massively bullish catalyst that should send prices soaring 20-30%.
But what is the reality? ADA prices haven’t exploded; instead, they remain suppressed below $0.40, performing even weaker than the broader market.
In the world of institutional trading, there is an unwritten rule: “Buy the rumor, sell the news.” Banks are not charities. When they release bullish news, it’s often because they need massive “buy orders” to act as counterparties for their operations. When retail investors rush in to buy the news, they provide the “Liquidity” whales need to complete their accumulation or distribution.
This divergence of “Bullish News, Bearish Price” often suggests deeper supply overhead or institutions using news liquidity to execute a “Shakeout”—forcing out weak hands before the real rally begins
Multi-Timeframe Technical Deep Dive (Predictive Lens): The Devil is in the Details
To see through the dealer’s setup, we must ignore the news and return to the charts. News can be faked, but the footprint of money (Candlesticks) cannot lie.
Weekly Chart Analysis: Gann Theory & Fractals — Is History Rhyming?
Weekly Timeframe for ADA (Cardano)
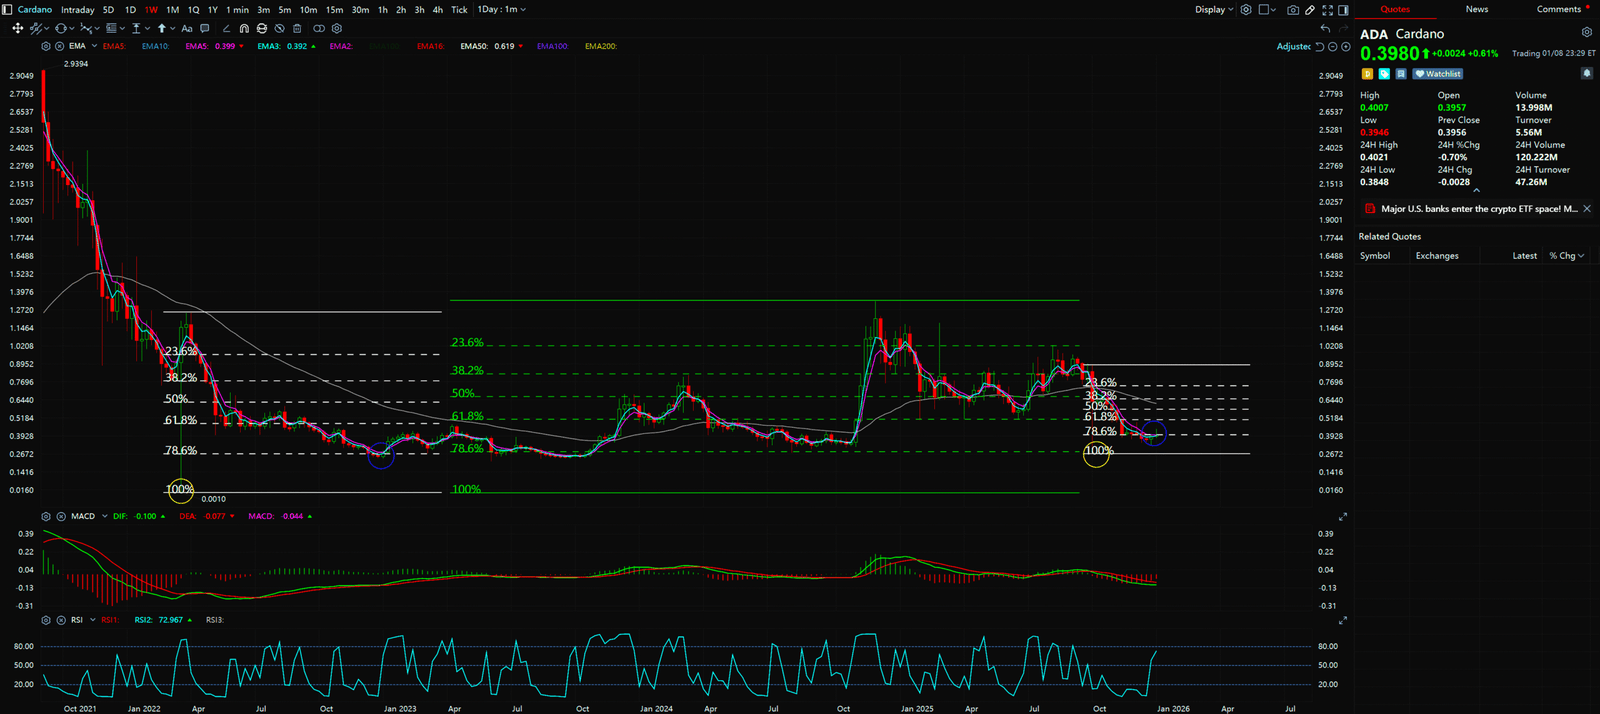
First, let’s look at the big picture. From the user-provided weekly chart, price is clearly constrained by a long-term bearish trend line. The structure exhibits a classic “Lower Highs, Lower Lows” formation. Many novices see this and panic, thinking it’s a bottomless pit.
However, I want to draw your attention to a key “Fractal.” Technical analysis master W.D. Gann famously said, “There is nothing new under the sun.” Financial markets are driven by human greed and fear, and since human nature doesn’t change, chart patterns are often strikingly similar.
Look back at the March–December 2022 cycle. ADA experienced a brutal correction. Panic was everywhere, but price miraculously bottomed out exactly at the 78.6% Fibonacci Retracement level.
Fast forward to 2026. Assuming history rhymes, the current correction from the October 2025 high (~$0.6061) is approaching a similar geometric conclusion. If price finds support near the current level (~$0.40), which aligns with the 78.6% retracement of the previous move, this would be the institution’s favorite “Maximum Pressure” buy zone. Whales love accumulating at the 78.6% “edge of the abyss” because most retail traders have already capitulated, making chips cheap and clean
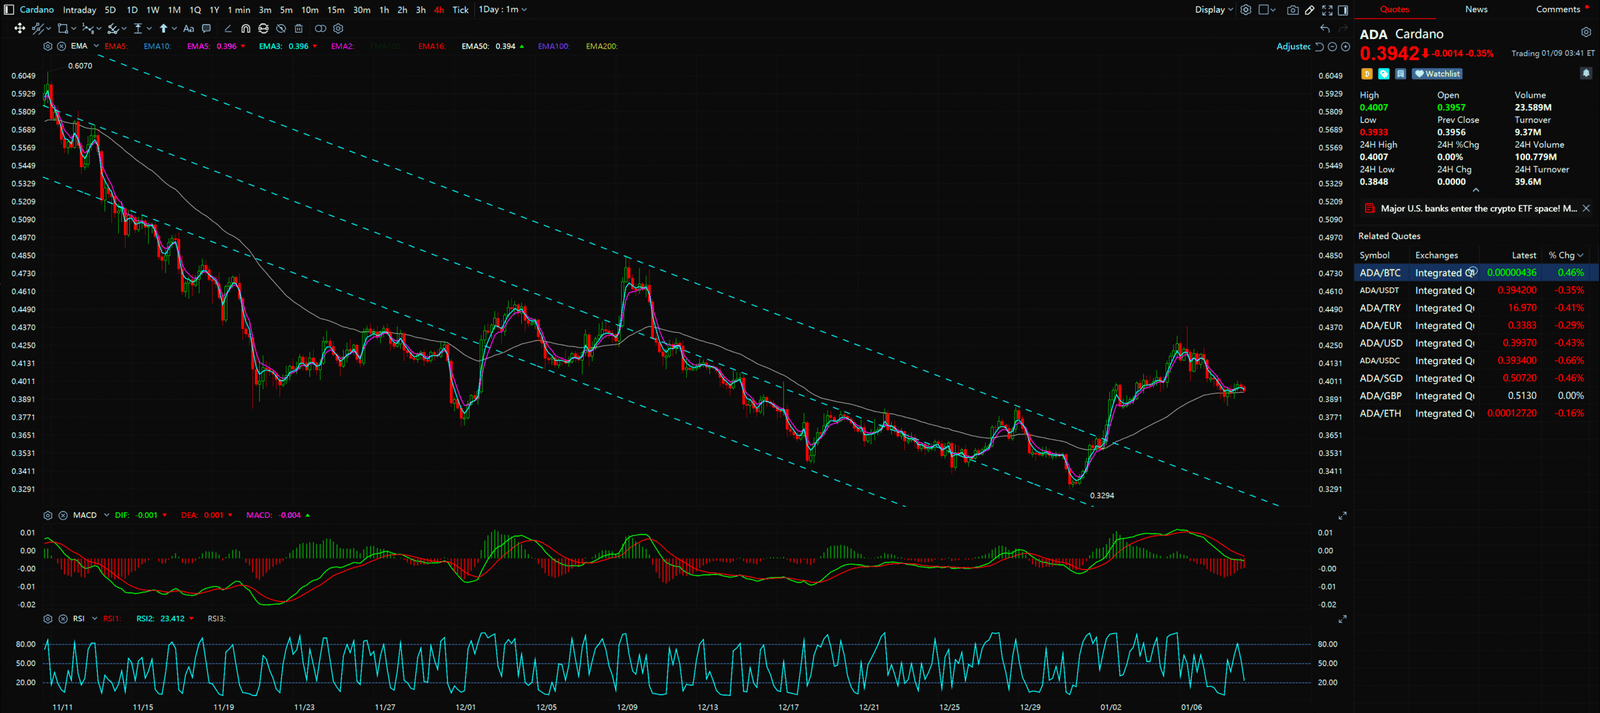
Daily Chart Analysis: Descending Channel & MACD Divergence — The Prelude to a Reversal
Daily Timeframe for ADA (Cardano)
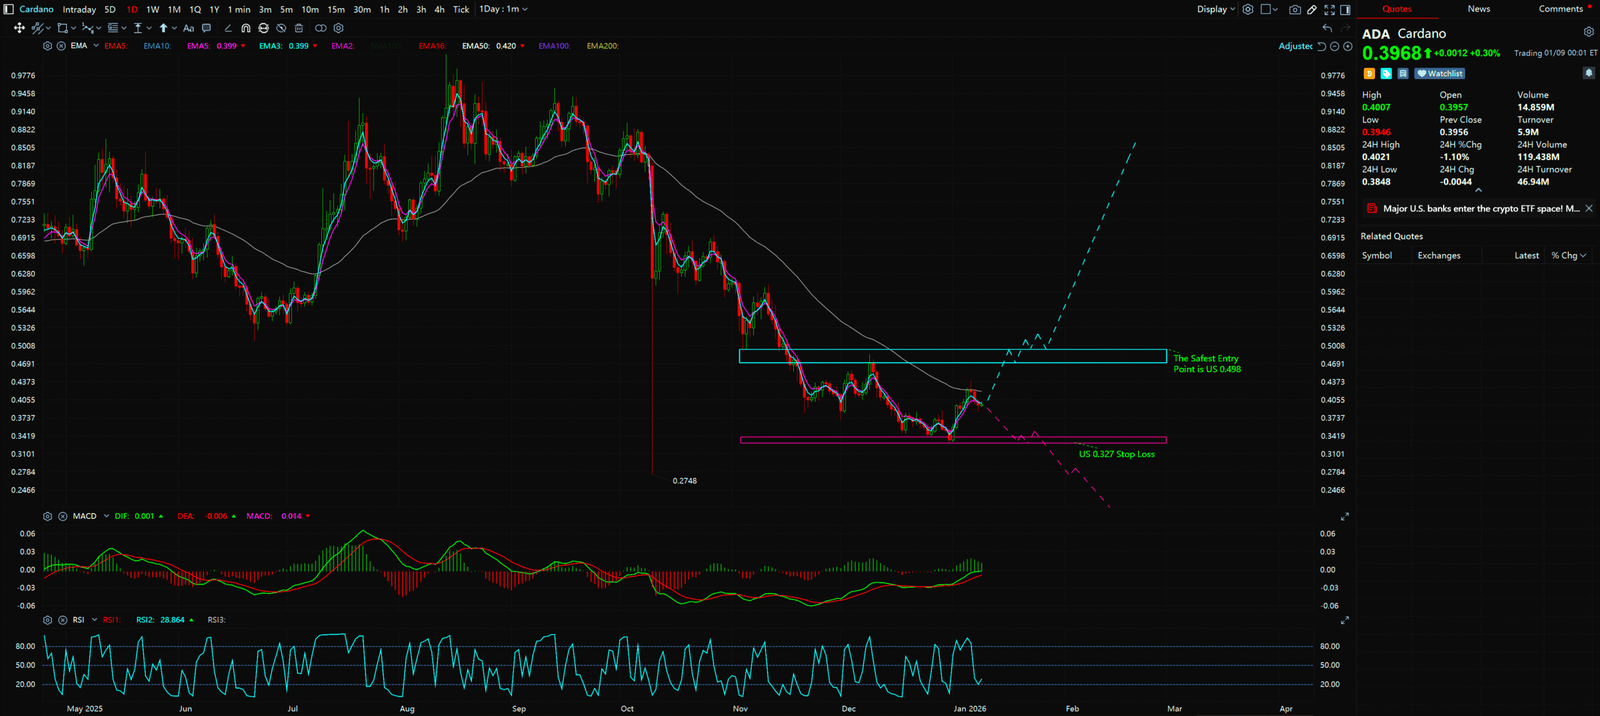
Switching to the Daily chart, ADA is respecting a clear “Descending Equilibrium Channel.” Price is hovering near the “3rd Lower Low”—a potential support zone.
But the more critical, “Banker’s View” signal comes from the MACD (12,26,9) indicator.
Observe closely: While ADA price makes a new low (Price Action Lower Low), indicating heavy selling pressure on the surface; the MACD histogram fails to make a new low and instead makes a Higher Low (Momentum Higher Low).
This is a textbook “Bullish Divergence.” What does this mean? It means that while sellers are still in control, the “power of selling” is exhausted. Like a car rolling down a hill, it’s still moving down, but the driver is slamming on the brakes. This phenomenon is often the strongest early warning signal of a trend reversal.


Synthesis & Unique Insight: Why I Tell You to “Wait”
The confluence of the Weekly 78.6% Fib level (Spatial Support) and the Daily MACD Divergence (Momentum Shift) suggests a bottom is imminent.
However, as an ex-banker, I must sternly warn you: DO NOT “All-In” right now!
Why? Because a golden rule in technical analysis applies: “Never buy until confirmed.” Many novices die trying to “catch the bottom.” Buying solely on divergence is essentially “catching a falling knife.” Whales will likely use one last drop to pierce $0.39, hunting the final batch of stop-losses, before the real pump.
To solve the novice mistake of “Right Market, Wrong Time,” you must learn “Right-Side Trading” — waiting for structural confirmation.
Key Takeaways
Summary / Key Levels: The Banker’s Playbook
- ⛔ Critical Support (Stop Loss / The Line of Death): USD 0.327
- This is the final line of defense. A daily close below USD 0.327 invalidates the entire 78.6% bounce scenario. Below here lies the abyss. If you hold positions, you must cut losses ruthlessly here. Pros might even consider shorting.
- 🎯 Speculative Entry (The Aggressive Entry): USD 0.33 – 0.34 (Advanced Traders Only)
- Action Guide: If you consider yourself a pro, you can play the bounce near the channel bottom with very small size (5-7% capital). But remember, this is risky business.
- 🛡️ The Safe Entry (The Banker’s Trigger): USD 0.498
- Action Guide: This is the core of this article! Many ask: “Why wait for $0.498? That’s $0.10 more expensive!” This is the difference between Retail thinking and Banker thinking. Retail wants to buy “Cheap”; Bankers want to buy “Certainty.” Only when ADA breaks and holds above the $0.498 resistance zone is the downtrend officially over and a new bull run confirmed. Entering here, your win rate increases exponentially. You aren’t buying cheap coins; you are buying a “Confirmed Trend.”
Our goal is not to provide a crystal ball, but to offer a clear, logical, and actionable framework by simplifying professional analysis.
Summary: Don’t Be Exit Liquidity
Fundamental news tells you what happened. Technical analysis predicts what will happen. Don’t gamble your future on a “maybe”. Your capital is your ammunition. Don’t spray and pray.
Unlocking Technical Analysis: Power Moves with Diagrams !
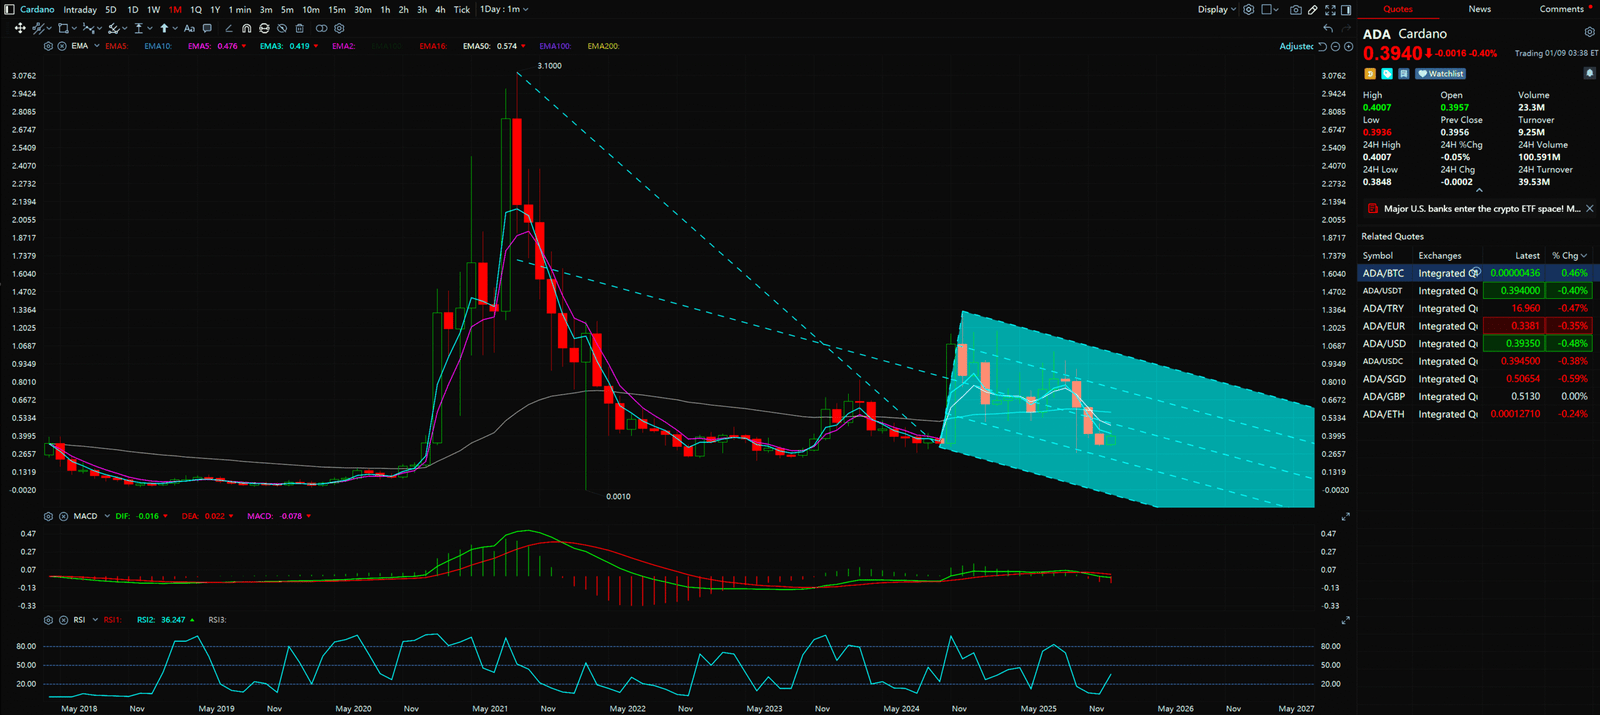
Monthly Timeframe for ADA (Cardano)
4-Hour Timeframe for ADA (Cardano)
For continuous, real-time analysis of these developing market structures, visit www.chart-blitz.com.
Fundamental news tells you what happened. Technical analysis predicts what will happen. To master the professional framework that separates market signal from noise, explore our exclusive models at www.chart-blitz.com.
Sources:
- TradingView – ADA/USD Real-time Charts
- CoinMarketCap – Cardano (ADA) Market Data & News
- CoinGecko – Cardano (ADA) Crypto Quotes
【Disclaimer】 The content herein is for educational purposes and reflects the author’s personal opinion only; it is not investment advice. All financial investments, including cryptocurrencies, carry significant risk, and you could lose your entire capital. To support this site, this article may contain affiliate links. While we strive for accuracy, we cannot guarantee all information is complete or error-free. Please conduct your own research and be fully responsible for your own investment decisions.