The speculator’s chief enemies are always boring from within. It is inseparable from human nature to hope and to fear
William Delbert Gann – 1949
Bitcoin (BTC) is back in the headlines, smashing past $90,000 with targets of $100k being thrown around by every media outlet. When even your friends who never trade start asking, “Is it too late to buy?”, my alarm bells start ringing. As a former banker with 20 years of experience on the trading floor, I’ve seen this movie before. When the news tells you to buy, it’s usually when the Smart Money is preparing to sell. Today, I won’t bore you with generic analysis. I will take you behind the curtain to see the market through the lens of an institutional trader.
【Analysis Benchmark Statement】
All technical analysis below is based on a price snapshot locked in on Nov 27, 2025, 16:08 (HKT): BTC = 91,345 USD.
This price snapshot provides a stable reference point for analysis. All support, resistance, and projected paths are relative to this benchmark. Market prices are highly volatile; readers should treat this report as an “analytical map,” not a real-time quote.
Catalyst & Fundamental View (Rearview Mirror): The Sugar-Coated Poison?
Over the last 24 hours, sources like CoinDesk and Yahoo Finance have highlighted growing expectations for Fed rate cuts and a surge in call options targeting $100k. Market sentiment is in “Extreme Greed.” However, to a banker, this news screams “Liquidity Trap.” For whales to offload their positions, they need retail buyers. The “Max Pain” theory in options markets suggests that Market Makers often suppress prices before expiry to kill late bulls. The better the news, the more cautious you should be.
Multi-Timeframe Technical Deep Dive (The Predictive Lens): Charts Don’t Lie
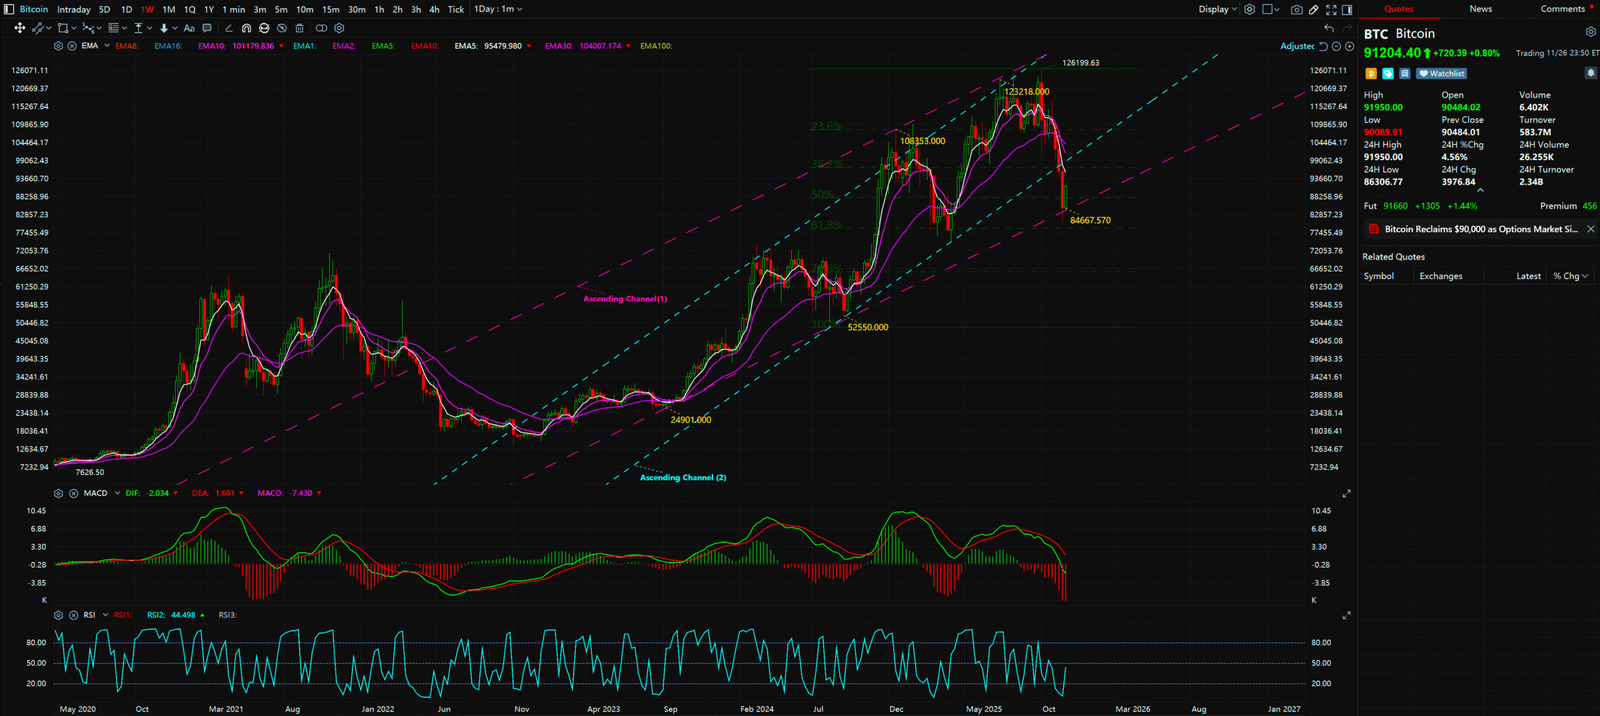
1. Weekly Chart: The Whale’s “Double Bull” Trap Retail traders lose money because they obsess over 15-minute charts. Smart Money looks at the Weekly. From the user-provided charts, BTC has been respecting a pristine “Ascending Channel” since early 2023. While price has rejected off the channel top (~$120k trajectory), this is not the end. It is a deceptive “halftime break.”
- The MACD “Double Bull” Setup: This is a setup rarely taught to retail. Look at the MACD indicator. The Green Line (Fast) has dipped below the 0-axis, looking weak. BUT, the Red Line (Slow) is holding firmly ABOVE the 0-axis! In institutional strategy, we call this “Mid-Air Refueling.” It’s like pulling back a slingshot. As long as the Red Line stays positive, a crossover of the Green Line back up triggers a massive “Double Bull Buy Signal.” Whales are currently shaking out weak hands to clear the runway for this violent upside move.
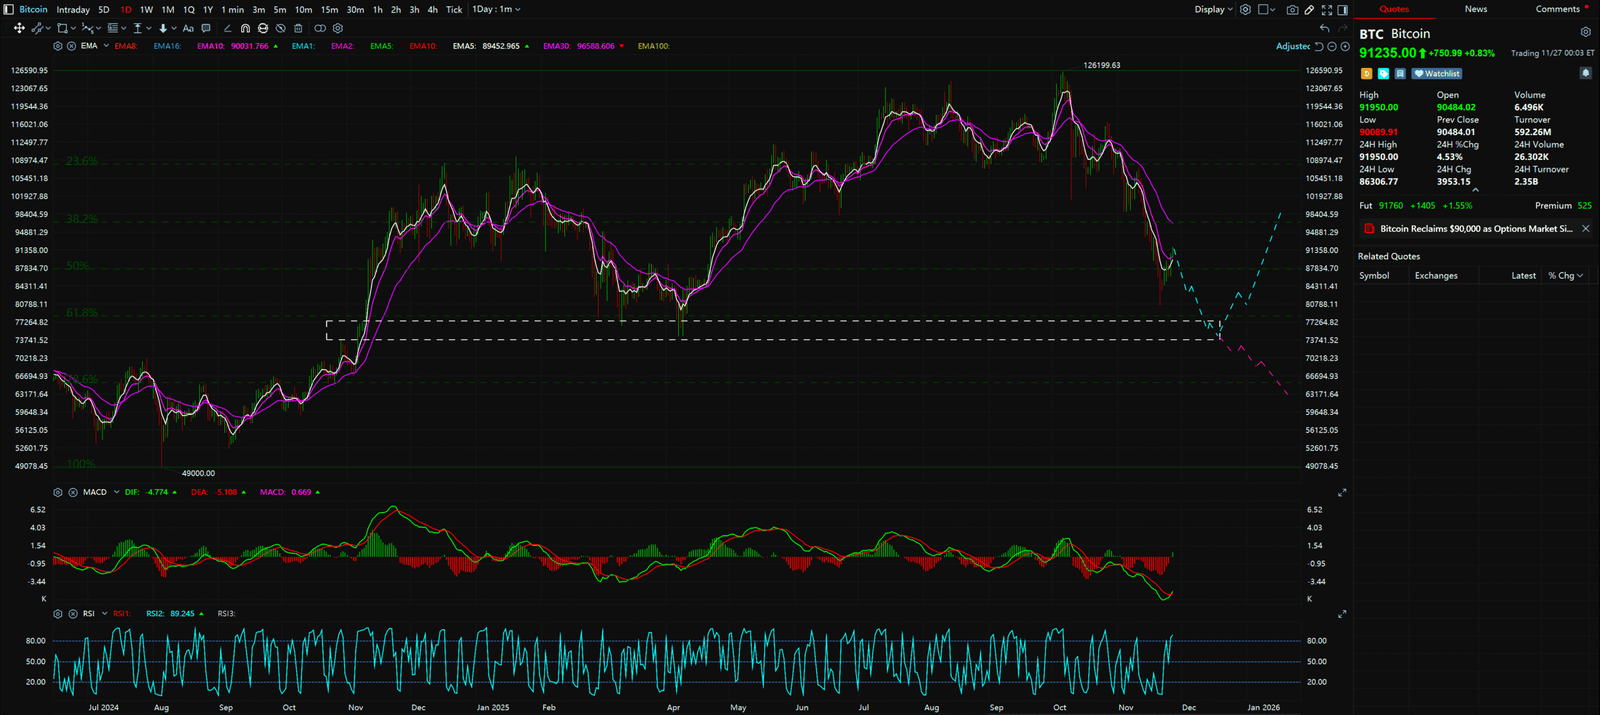
2. Daily Chart: The Golden Accumulation Zone Just because the macro trend is up doesn’t mean you buy at $91,345. The difference between a banker and a gambler is the obsession with Risk-Reward Ratio.
- Fibonacci & S/R Flip: BTC is currently retracing, having broken the 50% Fibonacci level. It is heading straight for the institutional “Sniper Zone.” Fix your eyes on the $73,620 – $77,199 range.
- Past: Before Nov 2024, this was an unbreakable “Ceiling” (Resistance).
- Present: According to the “Support & Resistance Flip” law, this ceiling has hardened into a concrete “Floor.” It also aligns perfectly with the 61.8% Golden Ratio. This is where the institutional Buy Limit orders are stacking up.
Synthesis & Unique Insight: The Banker’s Script
Combining the Weekly and Daily views, the script is clear: There is a temporary “Trend Divergence.” The Weekly is bullish, but the Daily needs a deep wash. In the next 1-2 weeks, expect a panic-inducing drop, possibly piercing $80k, causing media to scream “Bear Market.” This is the trap. When retail panic-sells, they are feeding liquidity into the $73,620 – $77,199 zone. Once price stabilizes here, the Weekly MACD will likely trigger its Golden Cross, launching the true impulse wave toward $120,000.


Key Takeaways
In summary, BTC is at a fascinating and pivotal crossroads. The long-term uptrend remains intact, and the short-term correction appears to be nearing its conclusion. Whether the price can successfully bounce off the “$73,620 – $77,199 Powerful Trampoline” will be key.
- Key Resistance: $98,000 – $100,000 (Psychological)
- Key Support (Golden Buy Zone): $73,620 – $77,199 (Watch closely)
- Stop Loss (Invalidation):$73,000 (A daily close below here breaks the structure; get out.)
Our goal is not to provide a crystal ball, but to offer a clear, logical, and actionable framework by simplifying professional analysis.
Unlocking Technical Analysis: Power Moves with Diagrams !
Weekly Timeframe for (BTC) Bitcoin
Daily Timeframe for (BTC) Bitcoin
For continuous, real-time analysis of these developing market structures, visit www.chart-blitz.com.
Fundamental news tells you what happened. Technical analysis predicts what will happen. To master the professional framework that separates market signal from noise, explore our exclusive models at www.chart-blitz.com.
Sources:
- Yahoo Finance: Bitcoin rises above $90,000
- CoinDesk: Bitcoin Re-takes $90K
- Forex.com: BTC Re-Tests 90K Analysis
【Disclaimer】 The content herein is for educational purposes and reflects the author’s personal opinion only; it is not investment advice. All financial investments, including cryptocurrencies, carry significant risk, and you could lose your entire capital. To support this site, this article may contain affiliate links. While we strive for accuracy, we cannot guarantee all information is complete or error-free. Please conduct your own research and be fully responsible for your own investment decisions.


