Alright, listen up, traders. How many times have you heard some “guru” on the internet say you should just stick to the default MACD settings (12, 26, 9)? They claim that optimizing your parameters just creates more false signals and makes it harder to spot a real entry.
Respectfully, that’s boomer talk. While they might have a basic grasp of the indicator, they’re missing out on its true potential. Today, I’m here to debunk that myth and share an exclusive, battle-tested MACD setup that I’ve used to consistently get ahead of the market.
This isn’t just a minor tweak. This is a complete overhaul that, when paired with the right timeframe, will help you filter out the noise and pinpoint incredible entry points with surgical precision. You’ll be able to spot the bottom for your favorite high-growth stocks and cryptos before 99% of other traders and analysts even know what’s happening. Get ready to boost your confidence and your portfolio.
The Flaw in Conventional Wisdom vs. The Power of a Cheat Code
Let’s cut the crap and get straight to a case study. We’ll use the popular stock Palantir (PLTR) to show you the night-and-day difference between the “standard setup” and our “God-tier setup.”
First, let’s define our high-probability entry rule: the “Double Bull Buy Signal.” This is my personal go-to strategy. It occurs when the MACD line and the Signal line form a golden cross, AND both lines must be trading above the zero line. This is the ultimate confirmation of bullish momentum, giving you the green light to go long.
Exhibit A: The Standard MACD (12, 26, 9) on the Weekly Chart
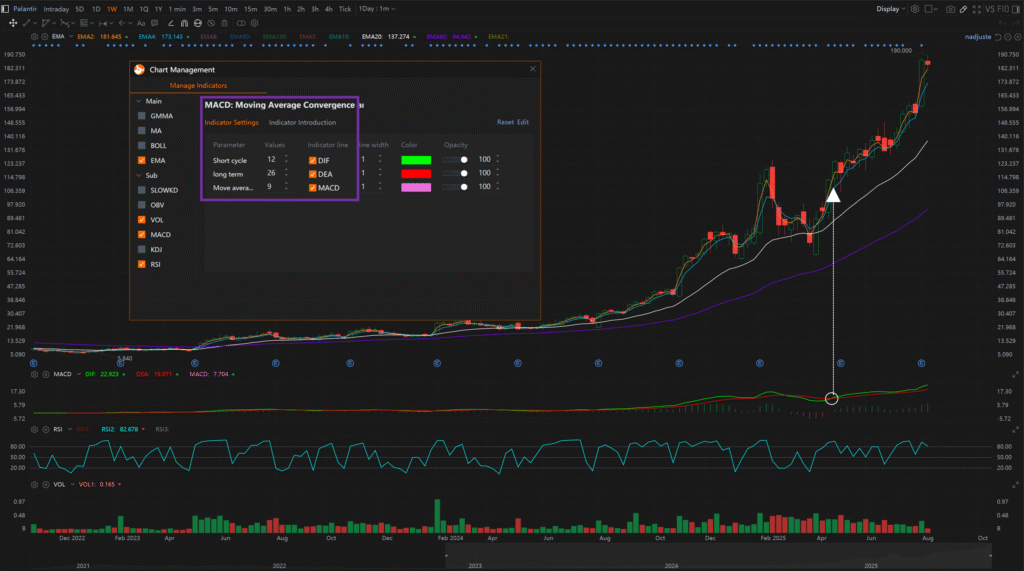
Take a look. Using the default settings that everyone and their grandma uses, you would have gotten exactly ONE “Double Bull Buy Signal” on Palantir’s weekly chart since the bear market bottom last October. Just one. And it didn’t even show up until late April 2025, after the stock had already skyrocketed from its lows to a whopping $123 per share. By the time you get this signal, you’re not catching a trend; you’re just providing exit liquidity for the early birds.
Exhibit B: The Optimized MACD (1, 20, 3) on the Weekly Chart
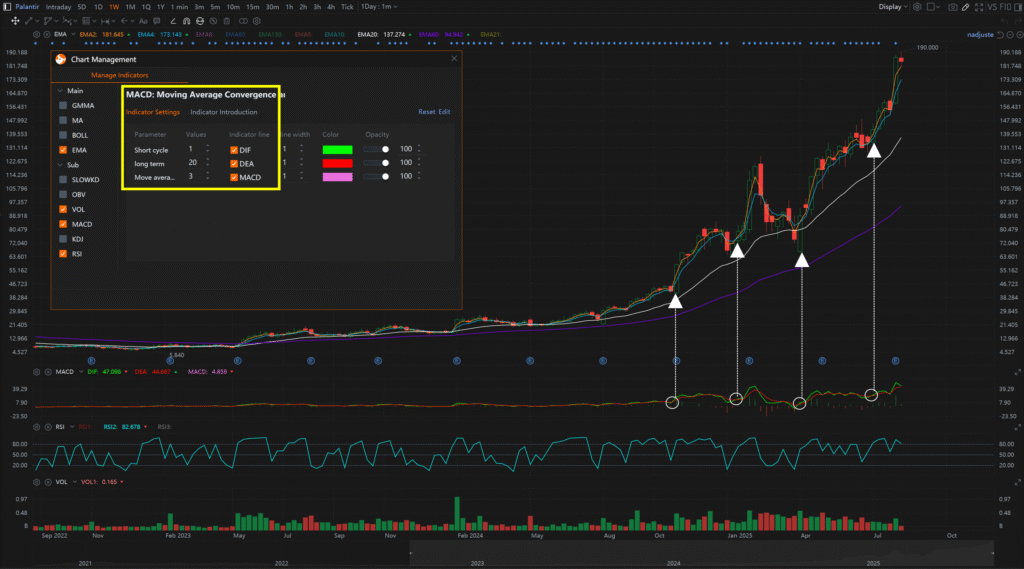
Now, prepare to have your mind blown. Using our custom-tuned (1, 20, 3) parameters on the exact same Palantir weekly chart, this setup flashed FOUR perfect entry signals since last October. That’s right, four!
Each “Double Bull Buy Signal” was a masterclass in precision, identifying the absolute bottom of each dip right before the next major leg up. The first signal appeared when the price was still consolidating at the lows, allowing for a stress-free entry. Every subsequent signal perfectly nailed the lowest point of each pullback, giving you multiple chances to load up your bags.
The result? With our setup, you’re not just getting in earlier; you’re getting in at picture-perfect prices, allowing you to sit back and capture the explosive upside. Your returns will absolutely crush those still stuck with the default settings. This is what winning from the starting line feels like.
【The Secret User Manual】
A final heads-up. This high-octane MACD setup (1, 20, 3) is a specialized tool. It’s designed for speed and accuracy, so you need to follow two critical rules to make it work for you:
- What to Trade: This is exclusively for high-volume, trending assets. Think popular U.S. stocks like TSLA, NVDA, or PLTR, and major cryptocurrencies like BTC and ETH. Don’t use it on low-volume penny stocks; the noise will chop you up.
- Best Timeframe: Because these settings are highly sensitive, you need to filter out the daily chop. The perfect partners for this strategy are the weekly and monthly charts. Using a longer timeframe helps you identify the macro trend and catch the truly massive waves.
Hope this killer setup helps you all on your journey to financial freedom. Remember, in the trading game, your informational edge is your greatest weapon. Happy hunting.
