Alright, all you lightning-fast Day Traders, Crypto short-swing masters, and tech wizards aiming to catch every tiny market turn! Today, we’re unlocking a “modded,” upgraded version of the Stochastic Oscillator, an indicator especially popular in Asian markets – the KDJ Indicator! It inherits the DNA of Stochastics but adds a J line, like putting a Turbocharger on a sports car, making signals react even faster and more sensitively! But is faster always better? How do you handle this “extreme Stoch”? Let’s break it down!
What the heck is KDJ? How’s it different from Stoch? Why the J?
KDJ is essentially a variation of the Stochastic Oscillator. It’s also a momentum oscillator designed to judge the price’s relative position within its recent high-low range, thereby identifying overbought/oversold conditions and potential turning points.
It has three lines, also oscillating generally between 0 and 100 (but the J line can exceed this range!):
- %K Line: Same concept as the Slow Stochastic %K line. Typically based on the RSV (Raw Stochastic Value) calculated over a period (e.g., 9 periods), then smoothed with an SMA (e.g., 3 periods). It reflects the price position, reacting relatively fast.
- %D Line: Same concept as the Slow Stochastic %D line. It’s a moving average (e.g., 3-period SMA) of the %K line. It’s the smoothed version of %K, acting as the signal line, providing more stability.
- %J Line (The Core Difference!): This is KDJ’s unique feature! Its calculation is usually 3 * %D – 2 * %K or 3 * %K – 2 * %D (minor variations exist across platforms, but the principle is the same).
- Purpose: By using a weighted difference between the K and D lines, it amplifies the volatility of the K line relative to the D line. This allows the J line to turn earlier than both K and D, providing potentially leading signals!
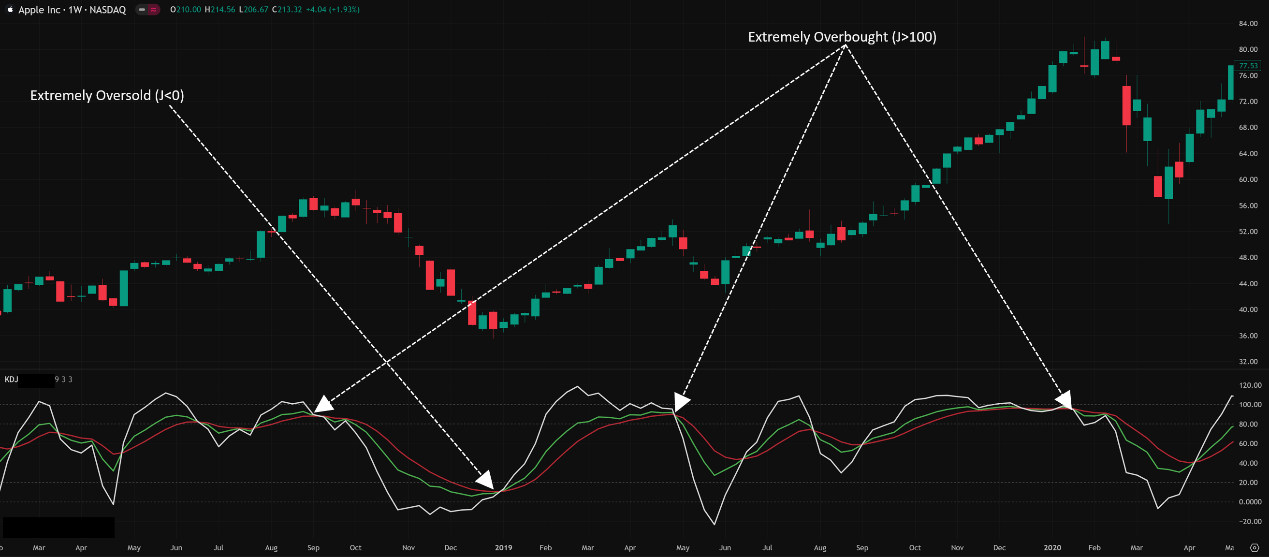
- Characteristic: The J line’s value can go beyond the 0 to 100 range! It can hit 110 or -10, for example. This overshoot beyond the normal “percentage” range is precisely its signal for extreme overbought/oversold conditions!
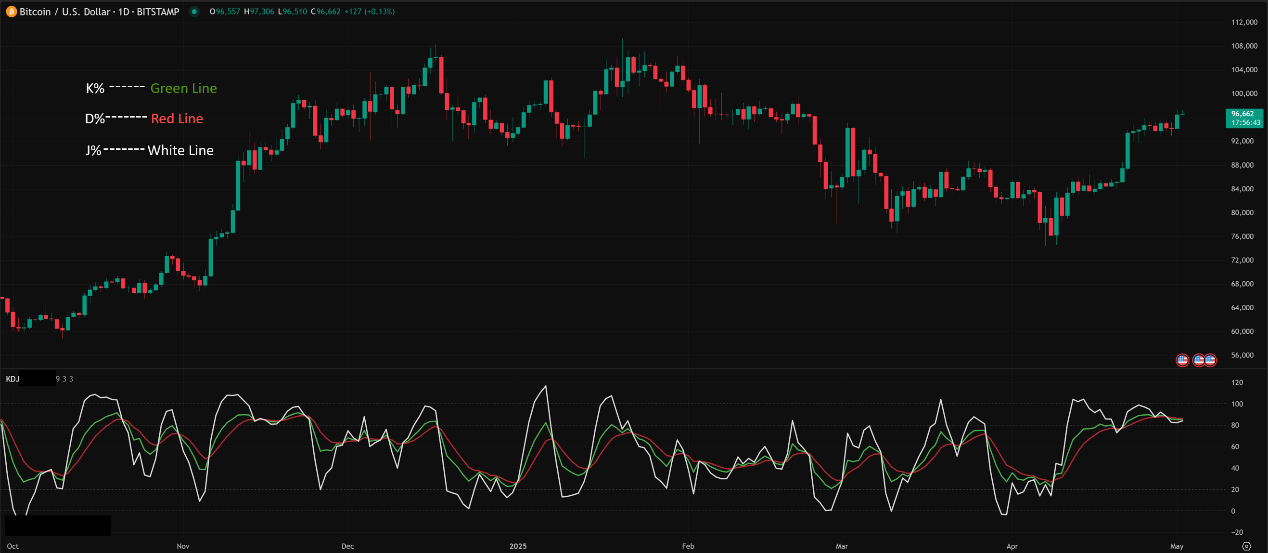
「KDJ Structure: K, D Lines + Hyper-Sensitive J Line (Can Exceed 0/100)」
Biggest difference from Stochastic: The addition of the J line! The J line makes KDJ react even more sensitively and rapidly to price changes. Theoretically, it can catch turning points earlier, but this also means more noise and false signals!
KDJ’s Origin Story & Design: The Pursuit of Extreme Sensitivity
KDJ’s origins are less clear-cut than Stochastic’s. It’s widely understood to have evolved from Stochastics and gained immense popularity, particularly in Asian markets (especially Hong Kong, Taiwan, Mainland China). It lacks a single, recognized Western inventor. Think of it as a “mod” or “optimization” developed by the trading community seeking faster signals than the standard Stochastics offered.
- Design Philosophy:
- Inherit Stoch’s core idea of judging momentum via closing price’s position within the recent range.
- Address the perceived lag in Stoch’s %K/%D signals.
- Introduce the J line to amplify volatility via the K/D difference, hoping its earlier turns and ability to exceed 0/100 would provide earlier, stronger OB/OS or reversal signals.
Simply Put: If Stochastics is a sensitive sports car, KDJ is that car tuned aggressively, with some stability controls removed, resulting in faster acceleration and turning, but significantly increased handling difficulty and risk!
「KDJ Logic: Stochastic + J Line Amplifier」

KDJ Basic Plays (Beginner’s Standard Ops):
Basic KDJ usage builds on Stochastics, but with special attention to the J line.
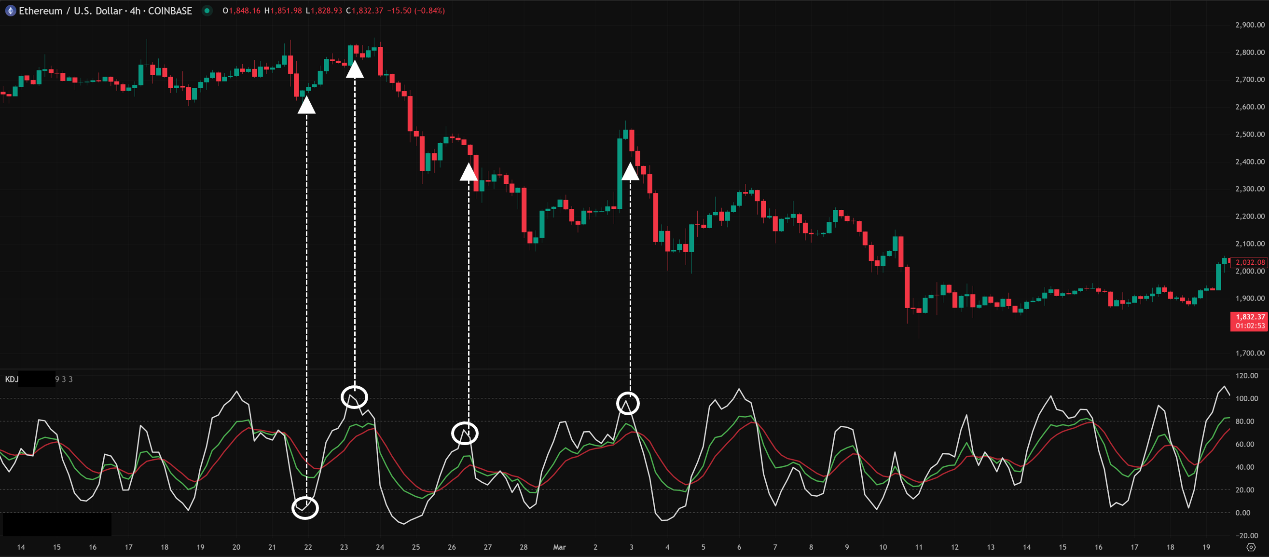
- Overbought/Oversold Zones (OB/OS – J Line is Key!):
-
- Traditional levels are 80/20.
- Overbought: K, D, and J lines all enter the >80 zone. Especially when the J line goes > 100, it signals an extremely overbought condition, high risk of a short-term pullback.
- Oversold: K, D, and J lines all enter the <20 zone. Especially when the J line goes < 0, it signals an extremely oversold condition, potential for a short-term bounce.
- Usage: Similar to Stoch, don’t fade immediately! Wait for the lines to exit the OB/OS zones (e.g., J line falls back below 100, or K/D lines drop below 80) as an initial confirmation.
「KDJ Overbought/Oversold: J Line Exceeding 0/100 is Key」
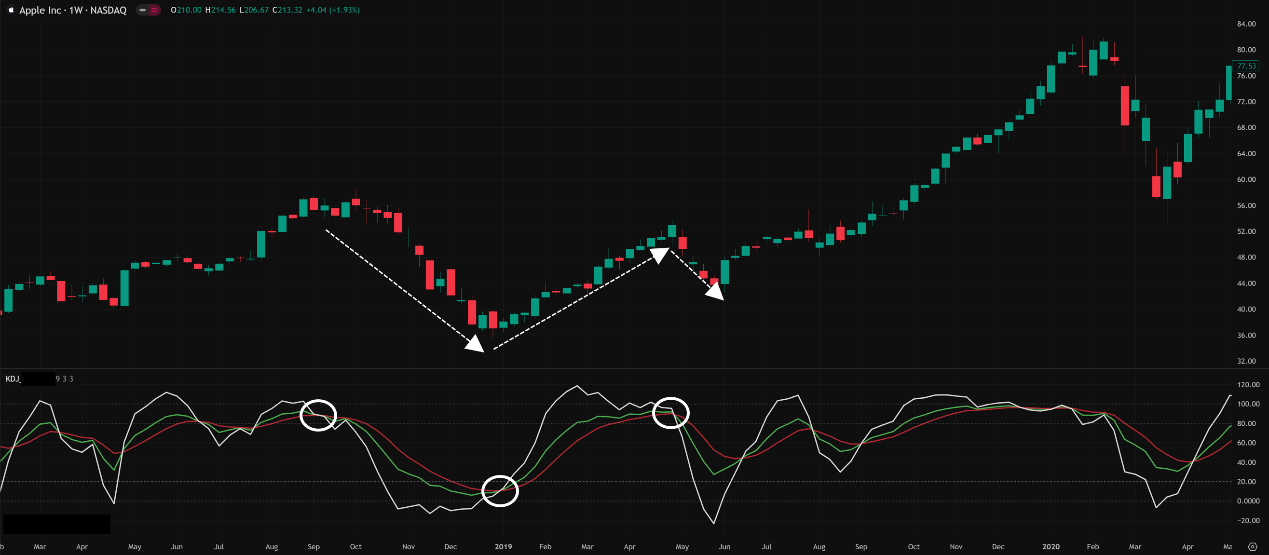
2. KDJ Crossovers (Golden/Death Cross – Combine with J Line Context):
-
- Golden Cross (Bullish): K line crosses above D line.
- Strong Golden Cross: Occurs near the 20 oversold zone, AND the J line is also turning upwards from a low level → Higher reliability buy reference signal.
- Weak Golden Cross: Occurs between 50-80, or when J line is pointing down, less reliable.
- Death Cross (Bearish): K line crosses below D line.
- Strong Death Cross: Occurs near the 80 overbought zone, AND the J line is also turning downwards from a high level → Higher reliability sell reference signal.
- Weak Death Cross: Occurs between 50-20, or when J line is pointing up, less reliable.
- Golden Cross (Bullish): K line crosses above D line.
- Trap: Still lots of false crosses! Especially those happening between 20-80 are often just noise.
「KDJ Crossovers: Combine Zone & J Line Direction」
3. J Line Turn (Fastest Warning):
-
- Since J is the most sensitive, it usually turns first at high (>80) or low (<20) levels.
- A J line turning down from extreme levels (>100) or up from extreme lows (<0) is a very noteworthy early reversal warning.
- However, it’s also the least reliable signal, potentially just a minor pullback/bounce. Must wait for K/D line confirmation!
KDJ Advanced Plays (Pro Level Strats – Taming the Sensitive Beast):
- Divergence (Works on KDJ Too!):
- Same principle as Stoch/RSI divergence, but the J line can sometimes make divergence patterns look more “exaggerated” or appear “earlier” (potentially more prone to false signals too).
- Bullish Divergence: Price LL, but K/D/J lines (especially watching the smoother D line) make a Higher Low (HL) → Potential bottom.
- Bearish Divergence: Price HH, but K/D/J lines make a Lower High (LH) → Potential top.
- Hidden divergence applies as well.
「KDJ Divergence: Early Warning of Momentum Exhaustion」
2. J Line “Hook” Reversal:
-
- When the J line reaches an extreme high (e.g., >90 or >100) and then suddenly hooks down sharply; or drops to an extreme low (e.g., <10 or <0) and then suddenly hooks up sharply.
- This “hook” pattern is considered by some traders a stronger short-term reversal signal, especially when confirmed by a K/D cross or other analysis.
「J Line “Hook”:Hook up/down sharply predict trend reversal 」
- KDJ Pattern Analysis:
- Some traders draw trendlines, head & shoulders, W/M patterns directly on the KDJ lines, believing breaks on the indicator might precede price breaks. This is more subjective and requires experience.
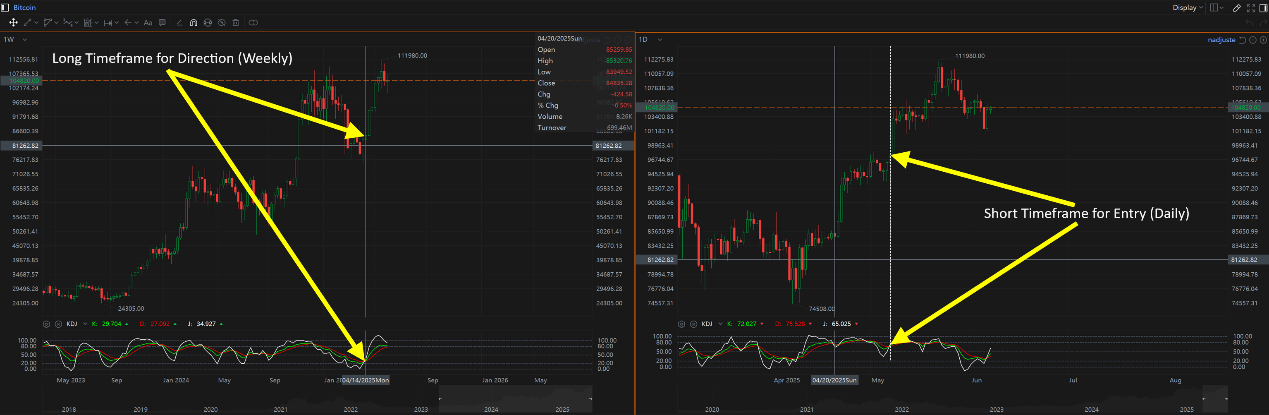
- Multi-Timeframe Resonance (Key to Improving Reliability!):
- Example: Weekly KDJ shows a bullish golden cross (major direction bullish), then wait for Daily KDJ to show a golden cross in the oversold zone for a more precise entry timing.
- Or: Daily KDJ shows J<0 extreme oversold + bullish divergence, then look for an H1 KDJ golden cross upwards to increase confidence in a short-term bounce.
- Core Idea: Use longer timeframe KDJ for direction/major state, use shorter timeframe KDJ for entry timing.
「KDJ Multi-Timeframe Resonance Strategy」
KDJ Parameter/Timeframe Breakdown (How to Set It Right?):
Core Parameters: (N, M1, M2)
- N: Lookback period for RSV calculation (like Stoch %K Lookback). Default = 9.
- M1: Smoothing period for %K. Default = 3.
- M2: Smoothing period for %D. Default = 3.
- Standard Default: (9, 3, 3). This is the most common setting, especially popular in Chinese-speaking technical analysis circles.
Parameter Settings Analysis & “Hottest” Combo Discussion:
- Why (9, 3, 3) Became Mainstream:
- It offers extremely fast responsiveness, meeting the demand in many Asian markets (especially historically with T+0 or high intraday volatility) for catching short-term swings.
- Relatively simple calculation, easy to understand and popularize.
- Common Directions for Change (Experimental):
- Slowing it Down (e.g., 14, 3, 3 or 18, 3, 3):
- Goal: Reduce sensitivity, filter noise, make signals more stable, similar to Stoch(14,3,3).
- Effect: KDJ becomes less “wild,” fewer false crosses and extreme J values, but loses its “fast” characteristic.
- Changing M1/M2 Smoothing (e.g., 9, 5, 5):
- Goal: Further smooth K and D lines, hoping to make crossovers more reliable.
- Effect: Increases lag.
- Slowing it Down (e.g., 14, 3, 3 or 18, 3, 3):
- Which “Unique” Combo is Hottest/Most Effective?
- For KDJ, there isn’t a recognized “unique” combo significantly hotter than (9, 3, 3). Because KDJ’s core selling point is its sensitivity, slowing it down is like putting a speed limiter on a Ferrari.
- The key isn’t finding magic parameters, but learning how to manage the sensitivity of (9, 3, 3)!
- **Conclusion: The “hottest” / most effective combo is likely using the default (9, 3, 3) on specific timeframes with the right strategy.
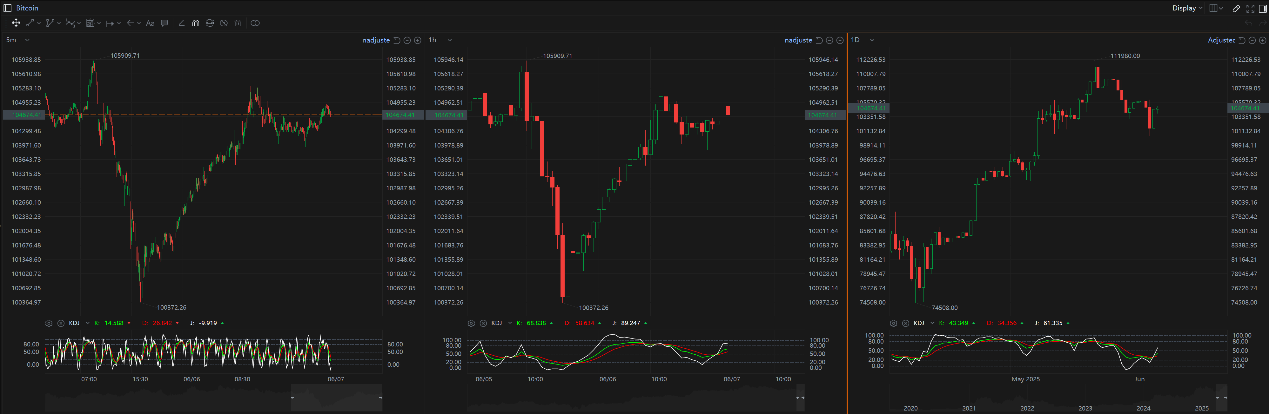
Timeframe Analysis:
- Ultra Short-Term (M1, M5, M15):
- (9, 3, 3) KDJ is extremely active here! Generates tons of crosses and J line extremes.
- Usage (High-Risk Scalper Plays):
- Might only watch for extreme J values (<0 or >100) combined with reversal candle patterns for scalps.
- Might use very short-term divergences.
- Risk: Flooded with false signals! Requires lightning-fast execution, iron discipline, and risk control!
- Intraday / Short Swing (H1, H4):
- (9, 3, 3) is still commonly used here. Signals become slightly more stable than on ultra-short TFs.
- Usage:
- K/D crosses confirmed in OB/OS zones.
- Look for clearer divergence patterns.
- J line hooks can be observed.
- Highly recommended to use with multi-timeframe analysis! Use Daily for major direction.
- Swing / Long-Term (Daily, Weekly):
- (9, 3, 3) might be TOO fast! On longer timeframes, (9, 3, 3) KDJ can generate many meaningless short-term fluctuations.
- Consider Longer Parameters: Like (14, 3, 3) or (18, 3, 3), or even longer with more smoothing, making it behave more like traditional Stoch(14,3,3) or slower, capturing major swings.
- Usage: Primarily focus on long-term divergences or the indicator staying in OB/OS zones for extended periods.
「KDJ (9,3,3) Timeframes: Shorter = More Sensitive/Noisy」
Summary: Which Unique Parameter Combo + Timeframe is Hottest & Most Effective? How to Use It?
- Parameters: (9, 3, 3) is the classic, most common choice that embodies KDJ’s sensitivity. Try (14, 3, 3) if you find it too fast. No absolute “best.”
- Timeframe: H1, H4 are where (9, 3, 3) KDJ is more actively used with some reliability. Daily/Weekly might need longer parameters like (14, 3, 3). M15 or lower is extremely high risk.
- Hottest / Most Effective Usage = Embrace its Sensitivity + Filter Rigorously:
- J Line is Core! Pay close attention to J’s extreme values (<0 / >100) and turns – it’s the earliest (but least reliable) warning.
- Use K/D Crosses for Confirmation, especially those occurring near 80/20 zones.
- Divergence is Still King! Learn to spot divergence on KDJ (especially the D line).
- Multi-Timeframe Resonance is Essential! Use longer TFs for context, shorter TFs for timing.
- ALWAYS Combine with Price Action, S/R, Trendlines, even Volume! KDJ’s false signals NEED to be filtered.
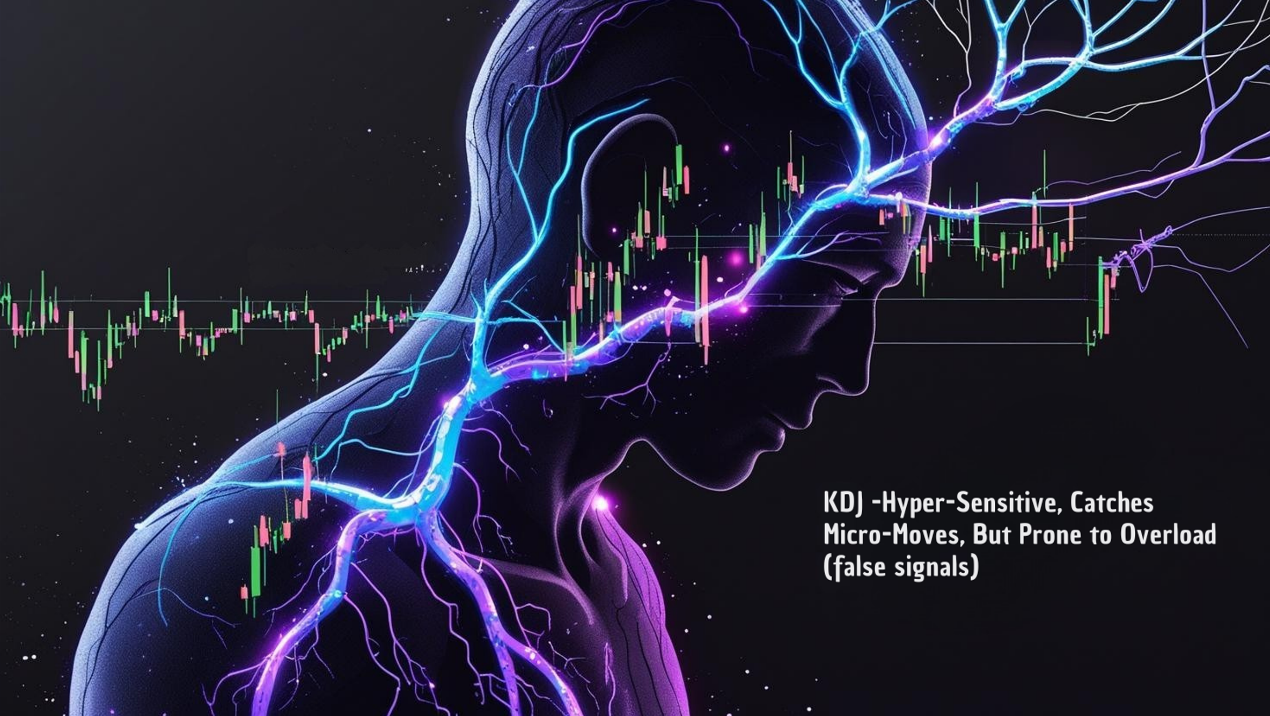
KDJ: The Market’s “Nerve Endings,” Catching the Slightest Touch
KDJ, through the amplification of the J line, pushes Stochastic’s sensitivity to the extreme. It’s like the body’s nerve endings, sensing the faintest touch. Pros:
- Extremely Fast Reaction, theoretically spotting turns earlier.
- J Line Extremes (<0 / >100) offer unique OB/OS signals.
- High recognition in Asian markets.
But the cons are equally critical:
- Extremely Sensitive = Tons of Noise/False Signals! Especially in ranges.
- OB/OS still fails in strong trends.
- Difficult to master, demands excellent filtering skills and discipline.
「KDJ: The Market’s Hyper-Sensitive Nervous System」
KDJ is a very sharp, short blade. Used well, it can give an edge in short-term skirmishes. Used poorly, its sensitivity can easily lead to “self-inflicted wounds.” It’s better suited for experienced, disciplined traders with robust filtering mechanisms.
Next Steps:
- Add KDJ (using default 9, 3, 3) to your H1 and H4 charts.
- Carefully observe how the J line turns earlier than K/D and how it breaks 0/100.
- Practice identifying KDJ golden/death crosses, especially near 80/20.
- Focus on identifying KDJ divergence, comparing it to Stoch/RSI divergence.
- Test repeatedly in Demo! Get a feel for KDJ’s sensitivity and false signals, find filtering methods that work for you.
Hope you master this high-speed weapon and catch those fleeting market opportunities! ⚡️🎯💰