Alright, all you Trend Surfing pros, Crypto channel experts, and Captains looking for a stable route through market volatility! Today, we’re unlocking another killer channel indicator, often compared to Bollinger Bands (BB) but with a smoother, gentler personality – the Keltner Channels (KC)! If you sometimes find BBs too wild, faking you out with sharp breakouts, then KC might be your jam. It tries to define the normal price fluctuation range in a more “averaged” way!
What the heck are Keltner Channels (KC)? Why are they often paired with BBs but still different?
Like BBs, KC is a volatility-based channel indicator. Its goal is also to draw a dynamic range around price, helping us gauge trends and potential breakouts/reversals.
It typically consists of three lines:
- Middle Line: Usually an N-period Exponential Moving Average (EMA). (Note: Classic KC used SMA, but the modern, more common version uses EMA!)
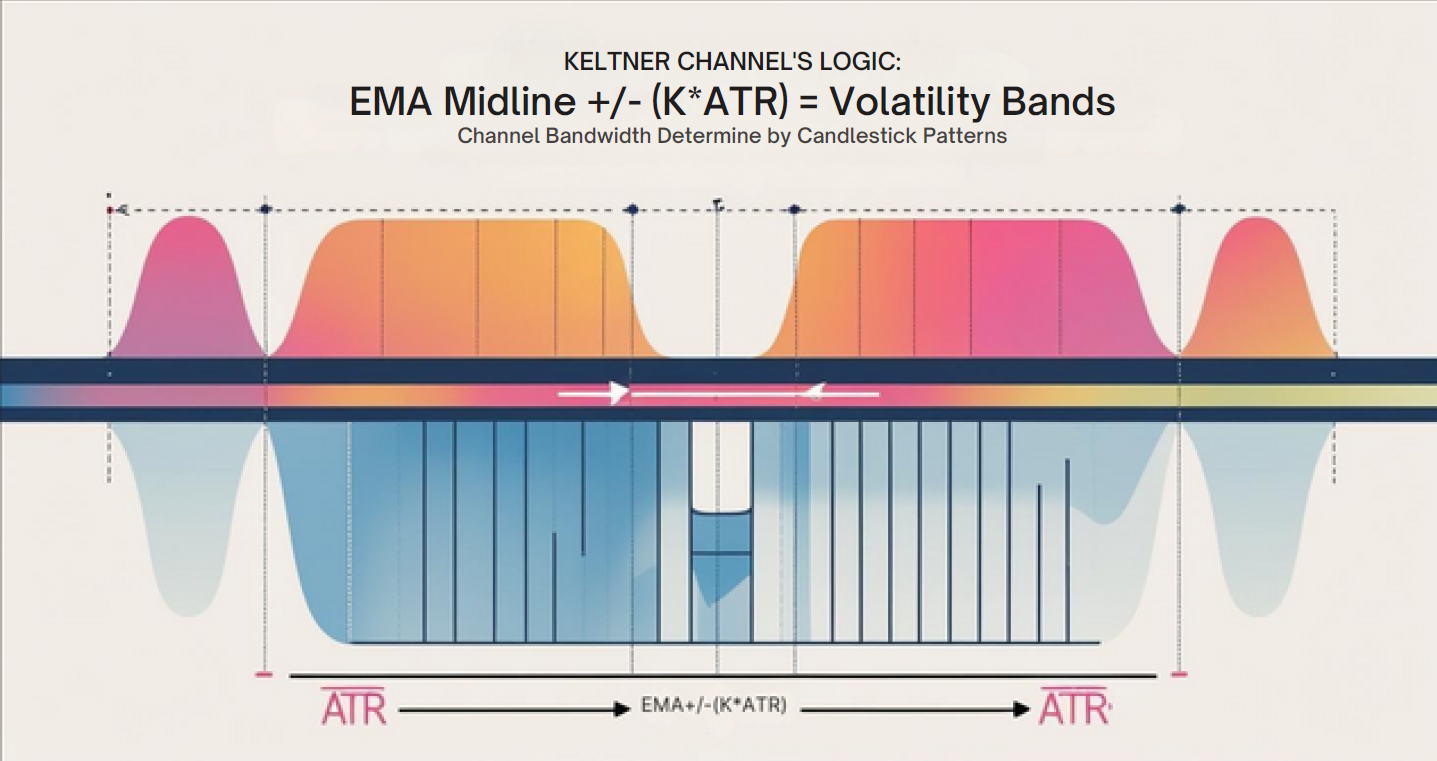
- Upper Band: Middle Line + K times the N-period Average True Range (ATR).
- Lower Band: Middle Line – K times the N-period Average True Range (ATR).
- ATR (Average True Range): Another gem from Master Wilder, measuring the average “true” range of price fluctuation over a period (it accounts for gaps).
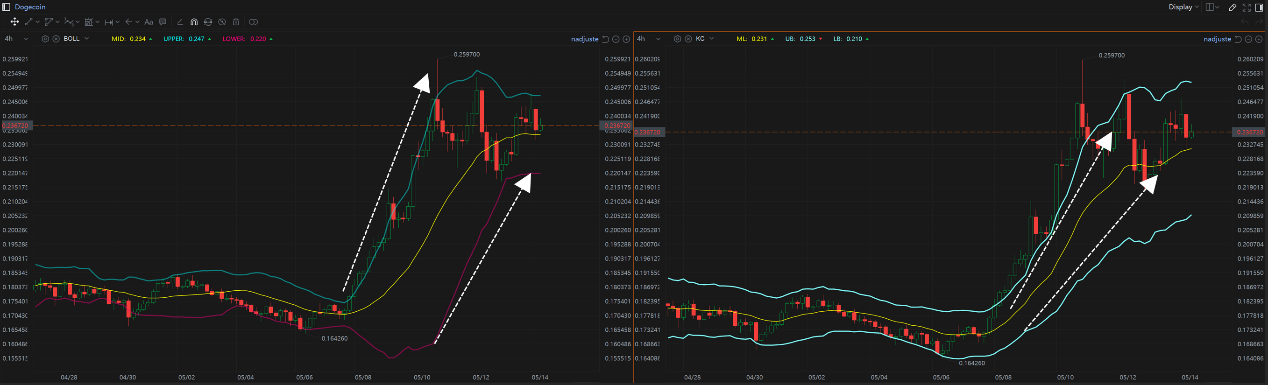
- Core Difference vs. BB:
- BB uses Standard Deviation: Measures price dispersion relative to the average. It’s sensitive to single extreme price spikes, which can cause the bands to suddenly widen/narrow dramatically.
- KC uses Average True Range (ATR): Measures the average range of price movement. It averages the daily ranges, making it less sensitive to single outliers. The channel expansion and contraction are typically smoother and more stable.
「KC vs. BB: ATR (Smoothed Range) vs. Standard Deviation (Statistical Dispersion)」
KC’s Origin Story & Design: The Quest for Smoother Channels
Keltner Channels were first introduced by Chester W. Keltner in his 1960 book “How To Make Money in Commodities.” However, his original version used an SMA for the middle line and added/subtracted an SMA of the daily high-low range (not ATR) for the bands.
Later, in the 1980s, renowned trader Linda Bradford Raschke (a trading legend!) popularized a modified version using an EMA for the middle line and Wilder’s ATR for calculating the band distance. This EMA + ATR version of KC is the one most commonly used today and is generally considered more effective!
- Design Philosophy (EMA+ATR Version):
- Define “Normal” Volatility Range: Use ATR to estimate a relatively stable, average daily price fluctuation range. The upper/lower bands represent the average trend (EMA) plus/minus a multiple (K) of this normal daily range.
- Smoother Channels: Compared to BB, ATR is less sensitive to outliers, making the channel boundaries more stable. This might be better suited for trend following and breakout confirmation, reducing fakeouts caused by volatility spikes.
- Identify Trends & Potential Breakouts: Price consistently trading above/below the channel or breaking out can be used as trend signals.
Simply Put: If BB is like a hyper-reactive bodyguard who sometimes jumps at shadows, KC is like a seasoned veteran bodyguard – calmer, smoother movements, less likely to be startled by minor disturbances. Both protect you (help define the range), but with different styles.
「Keltner Channels Logic: EMA Midline + ATR Volatility Bands」
KC Basic Plays (Beginner’s Standard Moves):
Basic KC usage shares similarities with BB, but with emphasis shifted due to its smoother nature.
- Trend Identification & Following:
- Gauge Direction: Price consistently trading above the Middle Line EMA, with the channel angled upwards → Uptrend.
- Gauge Direction: Price consistently trading below the Middle Line EMA, with the channel angled downwards → Downtrend.
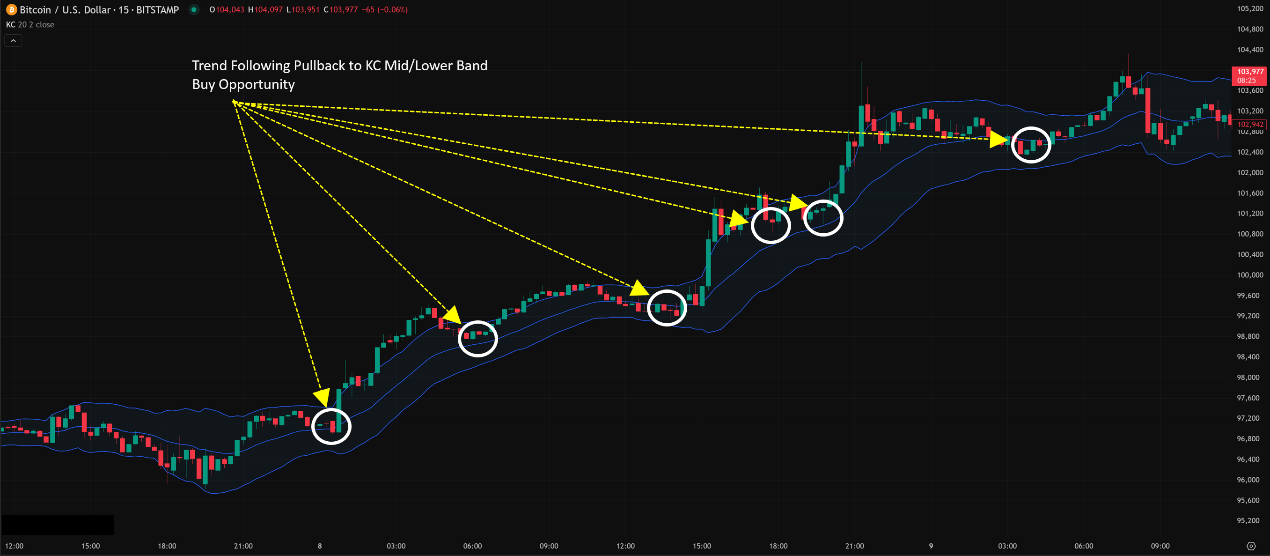
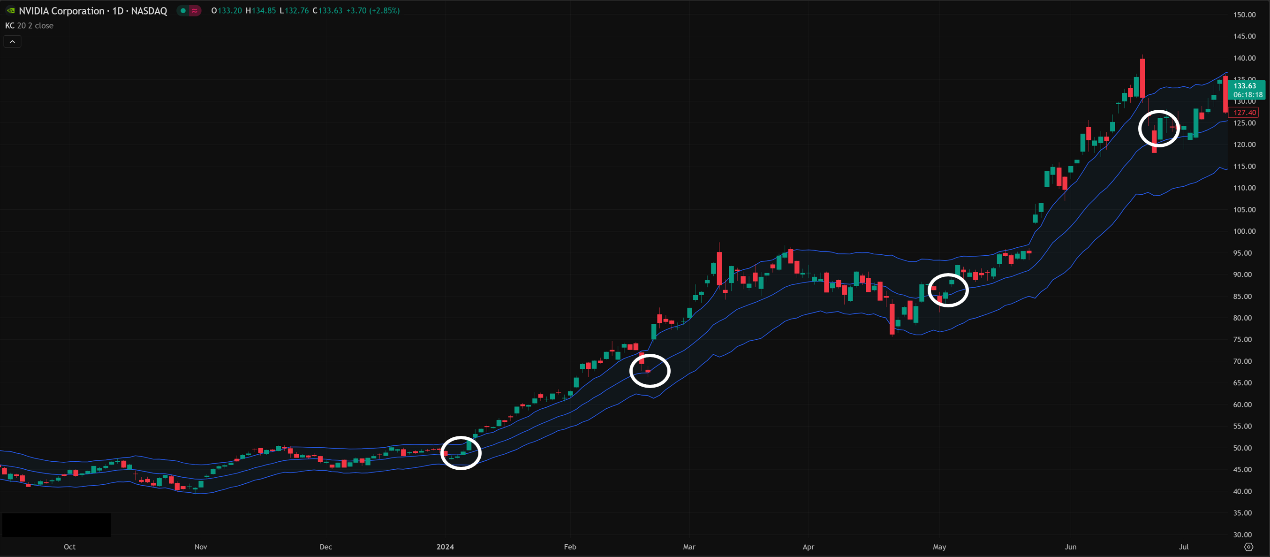
- Trend Following Entries: In an uptrend, pullbacks towards the Middle Line EMA or even the Lower Band (especially the lower band) that find support are potential buy/add-on opportunities. Vice versa for downtrends. KC’s smoothness might make its middle/lower band support more reliable than BB’s in some cases.
「KC Trend Following: Pullbacks to Channel Support」
2. Breakout Signals (A Strength of KC!):
-
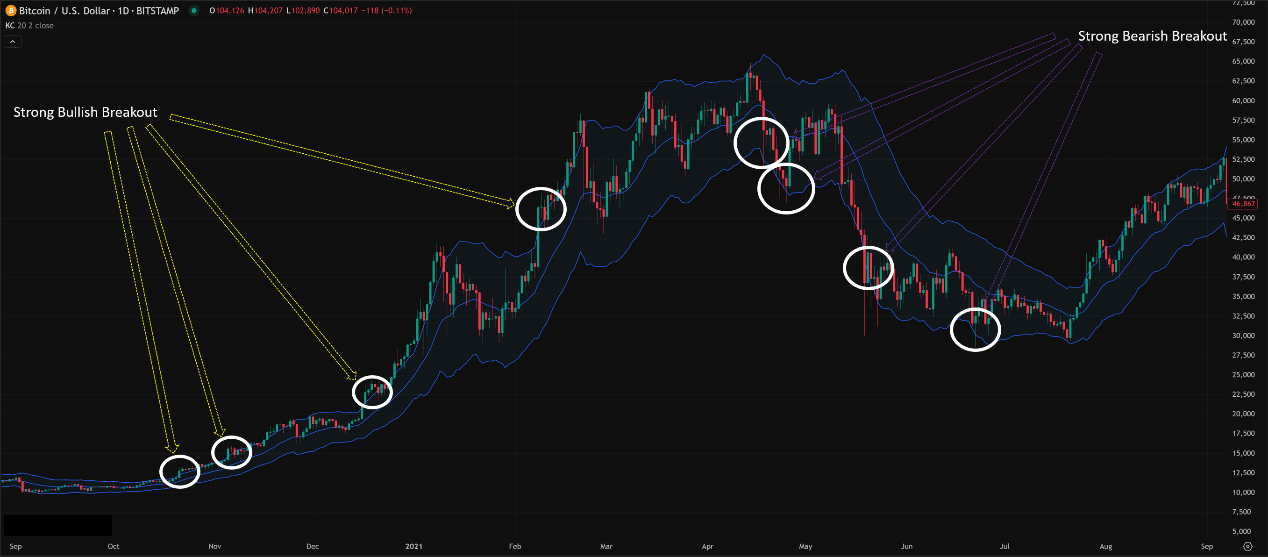
- Breakout Above Upper Band: Price closes strongly above the upper band. Often signifies the start or acceleration of an uptrend! Signals are stronger if the breakout occurs after a period of channel narrowing or consolidation.
- Breakdown Below Lower Band: Price closes strongly below the lower band. Often signifies the start or acceleration of a downtrend!
- Usage: Because the KC bands are relatively stable, breakout signals are often considered more reliable with fewer false breakouts compared to BBs. Many trend-following strategies use KC breakouts as entry signals.
- Note: After a breakout, watch if price can consistently stay outside the channel or if it quickly pulls back inside. Consistently “walking” outside the band indicates strong trend momentum (similar concept to BB’s Walking the Bands).
「KC Core Use: Trend Breakout Signals」
3. Overbought/Oversold / Counter-Trend? (Used Less Often!):
-
- Just like BBs, price touching the KC upper/lower bands does NOT automatically mean OB/OS! In strong trends, price can hug the bands for long periods.
- Only in very obvious ranging markets (channel flat and relatively narrow) might touches of the upper/lower bands be cautiously considered for counter-trend mean reversion trades, often using a narrower multiplier K (e.g., 1.0 or 1.5). But this isn’t the primary intended use of KC.
KC Advanced Plays (Pro Level – Mastering the Smooth Channel):
- Volatility Contraction/Expansion:
- While not quantified like BBW, you can still visually assess changes in KC channel width.
- Channel noticeably narrowing (similar to a Squeeze, but usually less extreme than BB’s) → Foreshadows a potential increase in volatility and a possible breakout.
- Channel noticeably widening → Confirms an increase in volatility, usually accompanying a trending move.
- Middle Line EMA as Key Support/Resistance:
- In confirmed strong trends, the KC’s Middle Line EMA acts as an excellent dynamic S/R line. Pullbacks to the EMA are prime trend-following entry/add-on points. Its reliability is often considered higher than the BB’s middle band SMA.
「KC Advanced: Middle Line EMA as Reliable Trend Support」
3. Combining with Other Indicators for Breakout Confirmation (Confirmation is Key!):
-
- While KC breakouts are relatively reliable, combining them increases confidence.
- Volume: Breakouts above/below bands accompanied by a significant volume increase are much more likely to succeed.
- Momentum Indicators (e.g., RSI, MACD, ADX):
- Price breaks Upper Band + RSI > 50 & rising / MACD bullish cross / ADX > 25 → Confirms upside momentum.
- Price breaks Lower Band + RSI < 50 & falling / MACD bearish cross / ADX > 25 → Confirms downside momentum.
KC Parameter/Timeframe Breakdown (What Settings are Smooth Criminal?):
Core Parameters: (N, M, K)
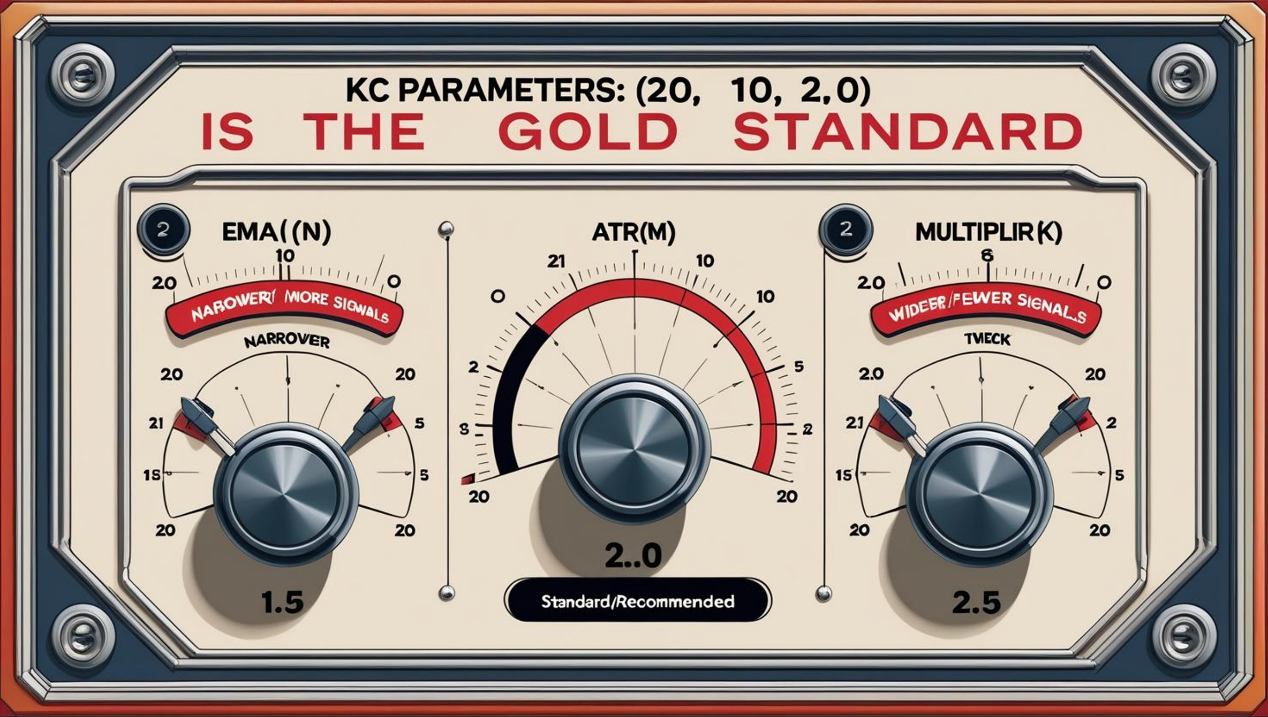
- N (EMA Period): Period for the Middle Line EMA. Default = 20.
- M (ATR Period): Period for calculating ATR. Default = 10.
- K (ATR Multiplier): Multiplier for ATR. Default = 2.0.
- Standard Default: (20, 10, 2.0). This is the most common setting, popularized after Linda Raschke’s modifications.
Parameter Settings Analysis & “Hottest” Combo Discussion:
- Is (20, 10, 2.0) the Best? It’s the most common, well-balanced setting, suitable for most markets and timeframes, especially Daily / H4 charts.
- Effects of Changing Parameters:
- Changing N (EMA Period):
- Shorter N (e.g., 10): Middle line faster, channel tighter, better for short-term. Trend-following stability decreases.
- Longer N (e.g., 50): Middle line smoother, better for long-term trends, but increases lag.
- Changing M (ATR Period):
- Shorter M (e.g., 5): ATR more sensitive, channel width reacts more to short-term volatility spikes.
- Longer M (e.g., 20): ATR smoother, channel width more stable, reflects longer-term average range. (10 is a very standard ATR period).
- Changing K (Multiplier):
- Smaller K (e.g., 1.0, 1.5): Channel narrows. Price touches/breaks bands more often. Suited for wanting more signals or potentially for range trading (high risk).
- Larger K (e.g., 2.5, 3.0): Channel widens. Price rarely touches/breaks bands. Suited for filtering most noise, focusing only on very strong breakouts.
- Changing N (EMA Period):
- Which “Unique” Combo is Hottest/Most Effective?
- No single combo is universally hailed as “hottest.” However, some common variations are worth noting:
- Combo 1 (Slightly Narrower – Maybe Better for Ranges/Short Reversals?): (20, 10, 1.5)
- Usage: In ranges, touches of the 1.5x ATR band might be better counter-trend references.
- Combo 2 (Slightly Wider – Noise Filter / Strong Trend Confirm): (20, 10, 2.5)
- Usage: Only very strong breakouts will close outside the 2.5x ATR band, useful for confirming powerful trends.
- Combo 3 (One of Linda Raschke’s variations – Faster Reaction?): (10, 10, 2.5)
- Uses a shorter EMA(10) with wider bands, trying to catch trends earlier while filtering noise.
- Combo 1 (Slightly Narrower – Maybe Better for Ranges/Short Reversals?): (20, 10, 1.5)
- Conclusion: The default (20, 10, 2.0) remains the most robust, widely used combo! Beginners should absolutely start here. If you have a clear reason (e.g., want more signals vs. less noise), consider slightly adjusting K based on extensive backtesting.
- No single combo is universally hailed as “hottest.” However, some common variations are worth noting:
「KC Parameters: (20, 10, 2.0) is the Gold Standard」
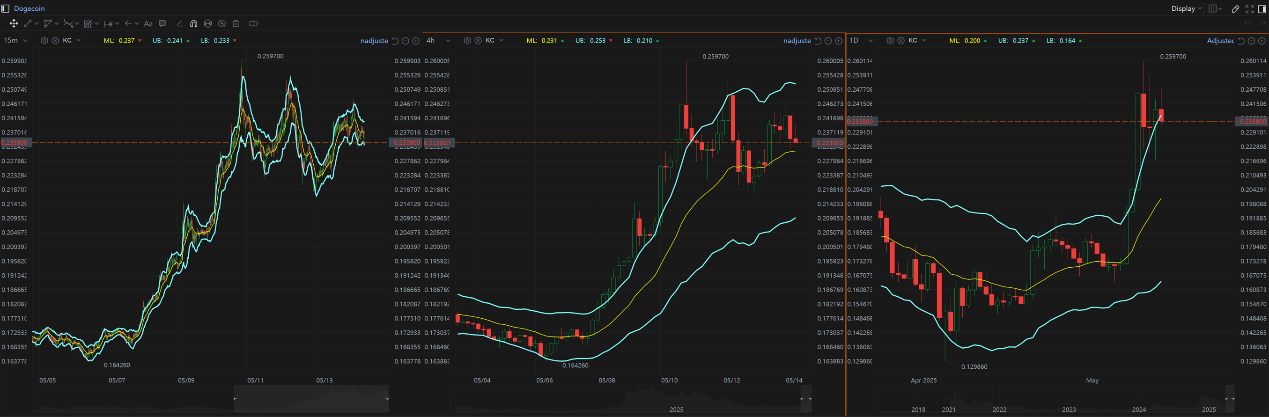
Timeframe Analysis:
- All Timeframes Applicable!
- Effectiveness & Focus:
- Ultra Short-Term (M1, M5, M15):
- Channel changes quickly, frequent breakouts. Might primarily use breakout strategies with very tight risk control for scalping. Middle line S/R less reliable.
- Intraday / Short Swing (H1, H4):
- Prime KC territory! Breakout strategies and pullback-to-EMA entries are key plays. Channel width changes also provide context.
- Swing / Long-Term (Daily, Weekly):
- Very reliable! Channels better reflect major trend volatility ranges. Breakout signals carry more weight. Middle Line EMA is significant long-term trend S/R.
- Ultra Short-Term (M1, M5, M15):
「KC Timeframes: Longer = More Stable Trend/Channel」
Summary: Which Unique Parameter Combo + Timeframe is Hottest & Most Effective? How to Use It?
- Parameters: Default (20, 10, 2.0) is the most reliable choice. Tweaking K (1.5 or 2.5) is a common experiment, needs testing.
- Timeframe: H1/H4/Daily are core application zones. Weekly for major trends. M15 or lower requires high skill.
- Hottest / Most Effective Usage = Trend Following Breakouts + Middle Line Pullbacks:
- Core Strategy: Trend-Following Breakouts! Wait for price to CLOSE above the upper KC band (buy) or below the lower KC band (sell/short). MUST combine with major trend direction! (e.g., filter with 100/200 EMA).
- Secondary Strategy: Pullback to Middle Line EMA in Trends! In a confirmed uptrend/downtrend, wait for price to test the EMA and show a confirmation candle – excellent add-on/entry point.
- Observe Channel Width for volatility context.
- ALWAYS Confirm with Volume and Price Action! Validate breakout or S/R hold effectiveness.
KC: The Market’s “River Channel” – Defining Normal Flow, Highlighting Floods
Keltner Channels use ATR to build a smoother channel that better reflects the average volatility range. It’s like the main channel of a river:
- Pros:
- Channels are relatively smooth, less prone to drastic widening/narrowing from outliers compared to BB.
- Breakout signals are relatively reliable, fewer false breakouts.
- Middle Line EMA provides good trend S/R.
- Cons:
- Reacts slower to sudden volatility spikes than BB (also a pro).
- Squeeze patterns are less defined and less predictive than BB Squeeze.
- Counter-trend usage is less common than with BB.
「Keltner Channels: The Market Price’s Smooth Riverbed」

Keltner Channels are a trend trader’s solid companion. If you prefer smoother channel breakout strategies with potentially fewer false signals, or want a reliable EMA pullback entry line, KC is an essential tool for your arsenal.
Next Steps:
- Add Keltner Channels (use default 20, 10, 2.0) to your H1, H4, Daily charts.
- Compare them side-by-side with Bollinger Bands (20, 2) on the same chart. Note differences in band width changes and breakout points.
- Focus on identifying price CLOSE breakouts above/below the bands and observe subsequent action.
- Watch how price interacts with the Middle Line EMA during trends.
- Backtest! Test strategies based on KC breakouts or Middle Line pullbacks.
Hope you navigate the market rivers smoothly and catch those big trend fish with KC!🌊🎣📈📉