The speculator’s chief enemies are always boring from within. It is inseparable from human nature to hope and to fear
William Delbert Gann – 1949
As a blue-chip project in the Decentralized Finance (DeFi) space, the price action of Maker (MKR) consistently captures the market’s attention. Recently, fundamental news surrounding MKR has been mixed. On one hand, market sentiment appears bullish; on the other, on-chain data reveals an increase in exchange balances, sparking concerns of potential sell-offs. However, fundamental news merely provides the “what” to analyze; the prediction of “when” and “how” the market will move must return to rigorous technical chart analysis.
Analysis Benchmark Statement All subsequent technical analysis is based on a price snapshot locked in on October 8, 2025, 14:33 (UTC+8): MKR = $1,813.70 USD. This price snapshot provides a stable reference point for the analysis. All support, resistance, and projected paths are relative to this benchmark. As market prices are highly volatile, readers should treat this report as an “analytical map,” not a real-time price feed.
Catalysts and Fundamental View (The Rear-view Mirror) From a fundamental perspective, the discourse around MKR is fraught with contradiction. While some reports suggest strong momentum, platforms like Coindesk and other on-chain data aggregators have pointed out a significant short-term increase in MKR supply on exchanges. This is a cautionary signal, as it could imply that some holders are moving tokens to exchanges in preparation for a potential sale. This fundamental “noise” creates a stark contrast with the structural strength shown on the charts.
The Predictive Lens: A Multi-Timeframe Technical Deep Dive
Multi-Timeframe Technical Deep Dive (The Predictive Lens) The core of this analysis comes from interpreting the provided monthly and daily charts.
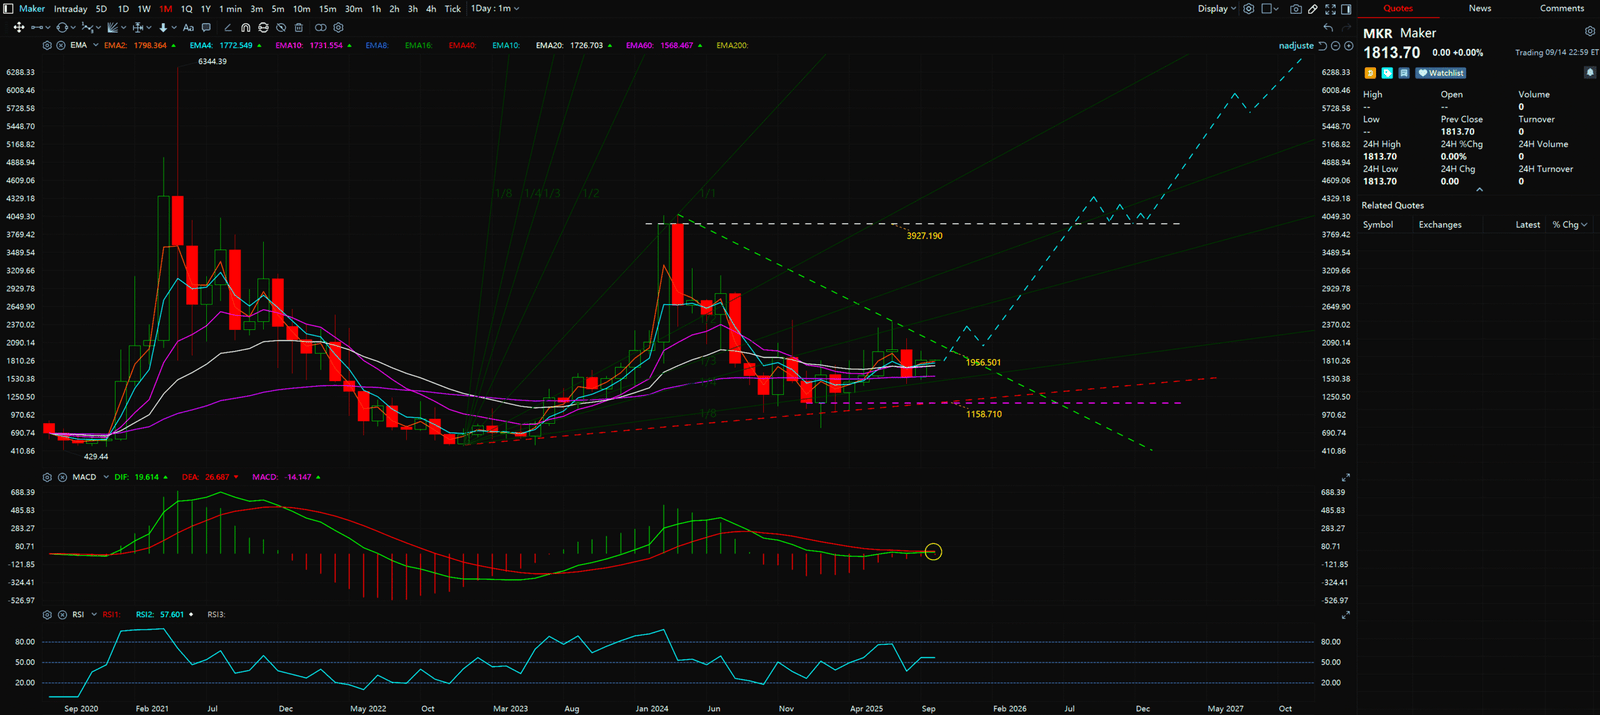
- Monthly Chart (Long-Term Structure): From the provided monthly chart, a Horizontal Triangle Pattern is clearly in construction. After its 2021 high, the price formed a Lower High around $3927.19, and after its 2022 low, it established a Higher Low around $770. This is a classic “lower highs and higher lows” consolidation structure. According to Elliott Wave Theory, such Horizontal triangle often appear as a Wave 4, heralding a subsequent Wave 5 impulse move of a similar magnitude to Wave 3 upon a breakout. Although the MACD indicator’s fast line (DIF) is temporarily below the slow line (DEA), both lines are firmly positioned above the zero-axis, confirming that the market is in a long-term bull market correction, not a bear reversal.
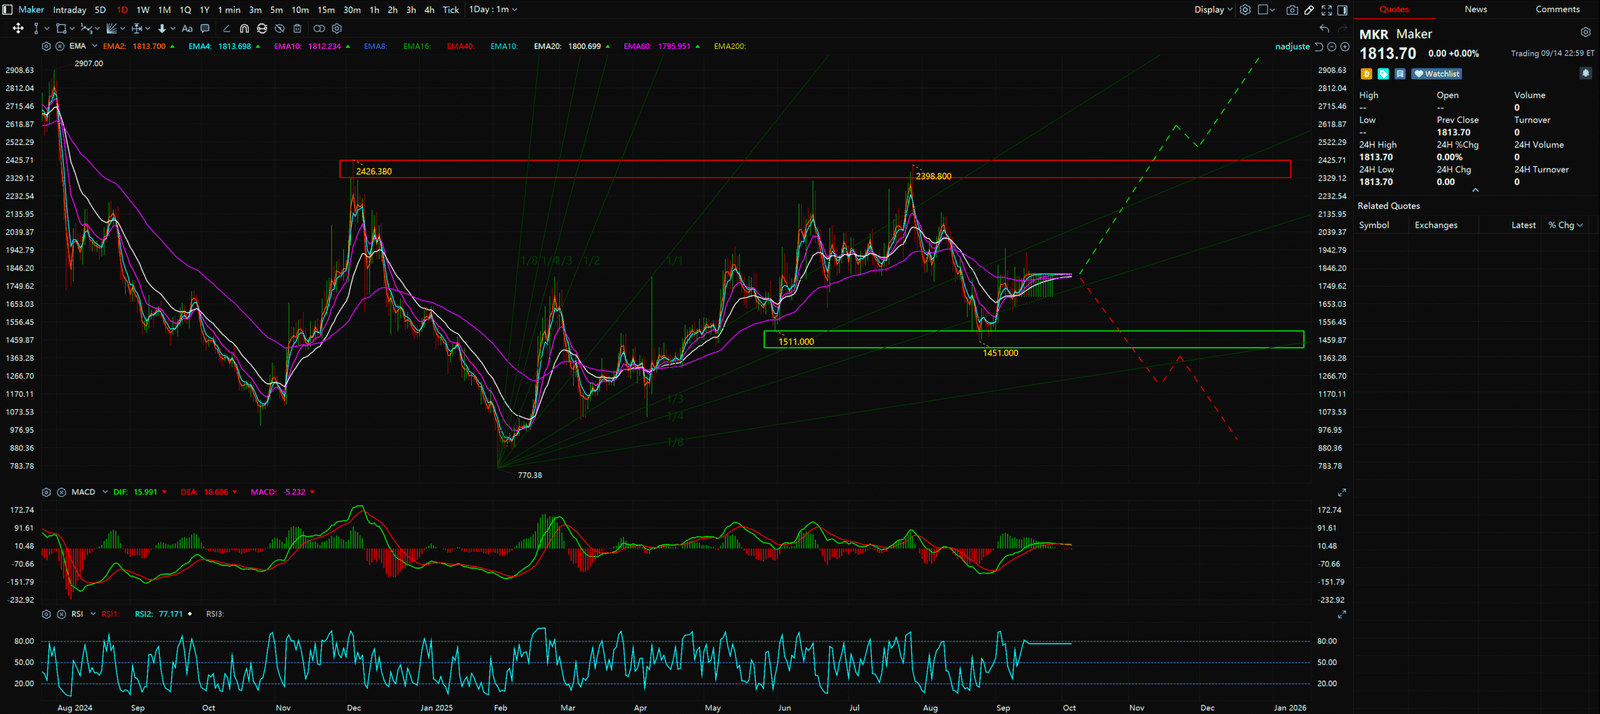
- Daily Chart (Mid-Term Tactics): Switching to the daily chart, the market structure becomes even clearer. The price topped out near $2426 in December 2024 and subsequently found robust support around $1511 in both June and August 2025, forming a solid bottoming range. The current price has successfully bounced from the upper boundary of this support zone and is holding firm above the Gann Fan’s 1×4 ascending line, indicating strong buying interest. The MACD on the daily chart mirrors the monthly, with both lines above the zero-axis, validating the effectiveness of the mid-term uptrend.
Synthesis Analysis & Unique Insight
Synthesizing the monthly and daily charts leads to a clear conclusion: MKR is at a critical juncture of “long-term bullish, mid-term bottoming.” The Horizontal triangle on the monthly chart offers immense potential for long-term appreciation, while the double-bottom support ($1511) and stabilizing structure on the daily chart provide a solid foundation for this long-term scenario. The fundamental “noise” about rising exchange balances, when juxtaposed with the powerful technical structure, is more likely a smokescreen for accumulation or a tactic to induce panic. As long as the price respects the key support level on the daily timeframe, a breakout to the upside is the higher probability event.


Key Takeaways
Summary / Key Price Levels:
- Core Resistance (Upside Trigger): $1956 (Monthly downtrend line), $2426 (Daily previous high)
- Core Support (Invalidation Point): $1511 (Daily double-bottom neckline), $1158 (Monthly triangle lower bound)
For continuous, real-time analysis of these developing market structures, visit www.chart-blitz.com.
Fundamental news tells you what happened. Technical analysis predicts what will happen. To master the professional framework that separates market signal from noise, explore our exclusive models at www.chart-blitz.com.
Sources:
- https://coinmarketcap.com/currencies/maker/
- https://www.coingecko.com/en/coins/maker
- https://www.coindesk.com/tag/mkr/
Unlocking Technical Analysis: Power Moves with Diagrams !
Monthly Timeframe for Maker (MKR)
Daily Timeframe for Maker (MKR)