When you make a trade, you should have a clear target of where you expect to get out
William Delbert Gann – 1949
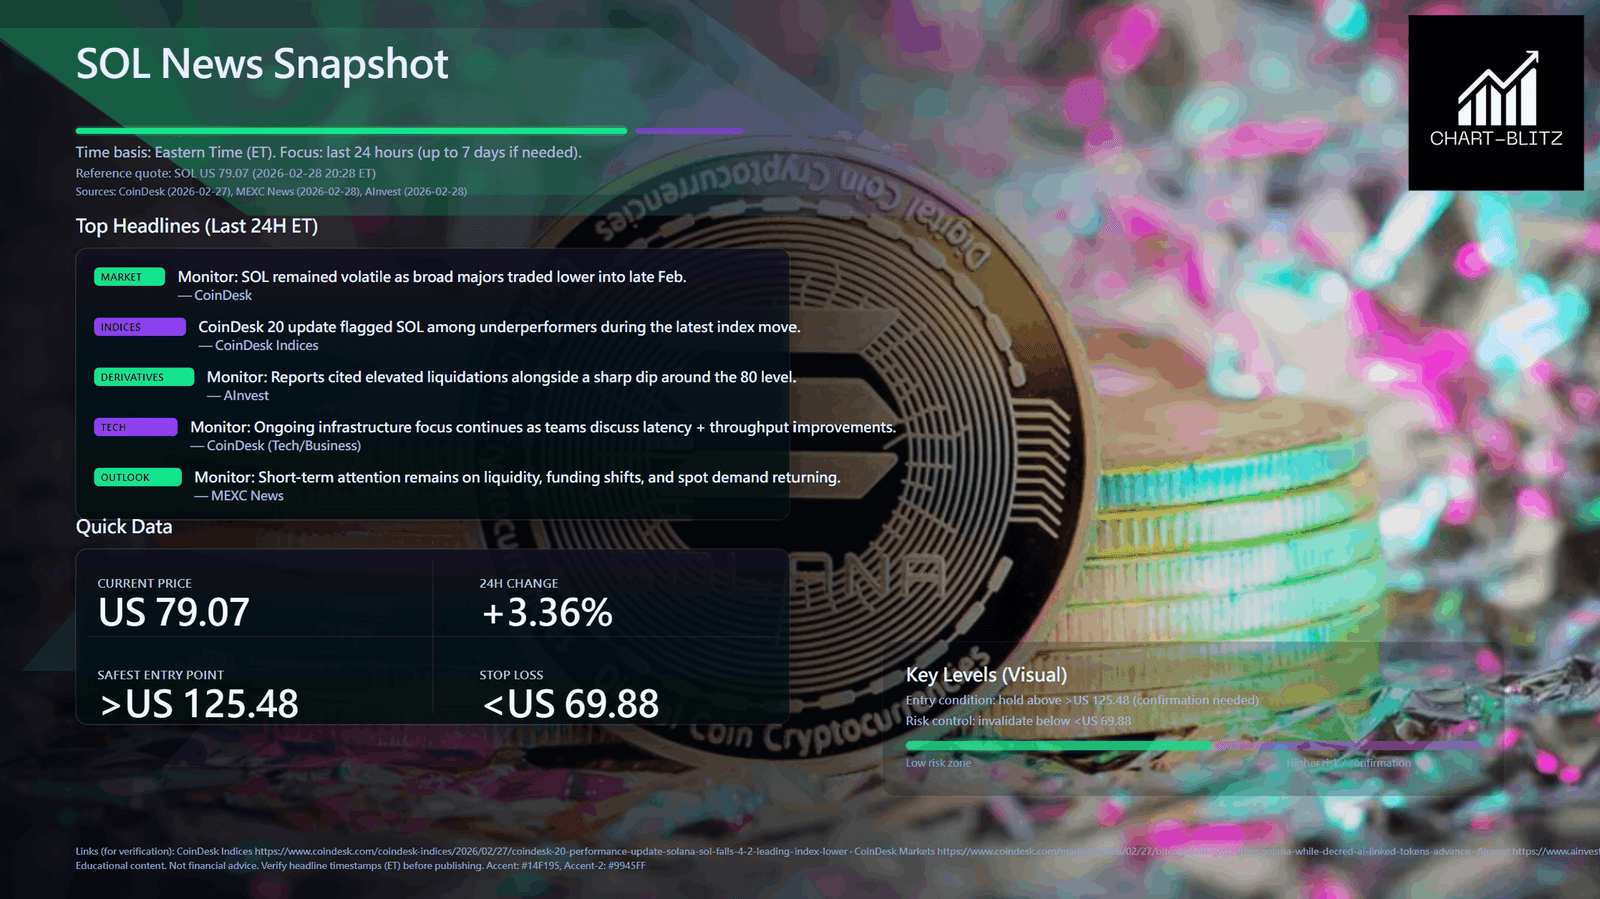
You See “Good News,” I See “Bait”. This morning, I habitually opened Bloomberg and CoinDesk for my morning briefing, and the screens were lit up with headlines about Solana’s (SOL) ecosystem recovery, technical upgrades, and warming on-chain data. The headlines were screaming positivity. If you are a rookie just entering the market, or a retail investor who religiously believes in “value investing,” looking at the current price of US 79 compared to the previous highs of over US 200, you must be trembling with excitement. A voice in your head is likely whispering: “It’s dropped so much, and with all this good news, it’s a gift from heaven! If I don’t All-in now, I’ll miss the boat.”
Stop. Stop right now.
Before you click that green “Buy” button, listen to some hard truths. As an ex-trader who spent 20 years in Wall Street and Hong Kong banking trading rooms, handling flows of hundreds of millions of dollars, I have seen too many retail traders die on these “perfect bottom-fishing opportunities.” I must brutally tell you a fact: The financial market is never a charity. News media is often the cheapest, and most effective, “hunting rifle” for whales.
When the whole world tells you to buy, it is usually when the whales are preparing to “distribute” (sell). Today, I won’t talk to you about vague faith, nor will I give you ambiguous nonsense. I will use the coldest data, the most real charts, and the banker’s exclusive tool—VPFR (Volume Profile Fixed Range)—to deconstruct why the current price of US 79 is not a bottom, but a carefully designed “Liquidity Trap.”
【Analysis Baseline Statement】
All technical analysis below is based on the price snapshot locked on February 28, 2026: SOL = USD 79.01. This snapshot provides a stable reference point. All support, resistance, and projected paths are relative to this baseline. Market prices change instantly; please view this report as an ‘analytical map,’ not a real-time quote.
Catalysts & Fundamental View (Rearview Mirror: Engineered Noise)
Over the last 24 hours, news about SOL has been overwhelming. CoinDesk reports that SOL remains volatile but watched, with tech teams discussing latency and throughput improvements; MEXC News says short-term attention remains on liquidity and spot demand returning.
Sounds positive? Like the whole world is backing SOL? Wrong. This is a textbook “Exit Liquidity” manufacturing process.
In the trading room, we live by a golden rule: “Buy the Rumor, Sell the News.” You have to understand that real Smart Money received the intel months ago when prices were lower and nobody cared. They have already built their positions with low-cost chips. What do they need now? They need someone to take over their bags at a high price.
The news coming out now has one purpose: To create enough Market Depth. Only when masses of retail traders see the news and rush in to buy does the market have enough liquidity for whales to “dump” their massive holdings onto you without crashing the price instantly.
If you rush in at US 79 because of this news, congratulations, you are not an investor; you have successfully become the “ATM” and “Exit Liquidity” for institutional investors.
Multi-Timeframe Technical Deep Dive (Predictive Lens: The Brutal Truth)
Ignoring the news noise, we put on the Banker’s X-Ray glasses—Volume Profile Fixed Range (VPFR) and Market Structure—and you will see a completely different world.
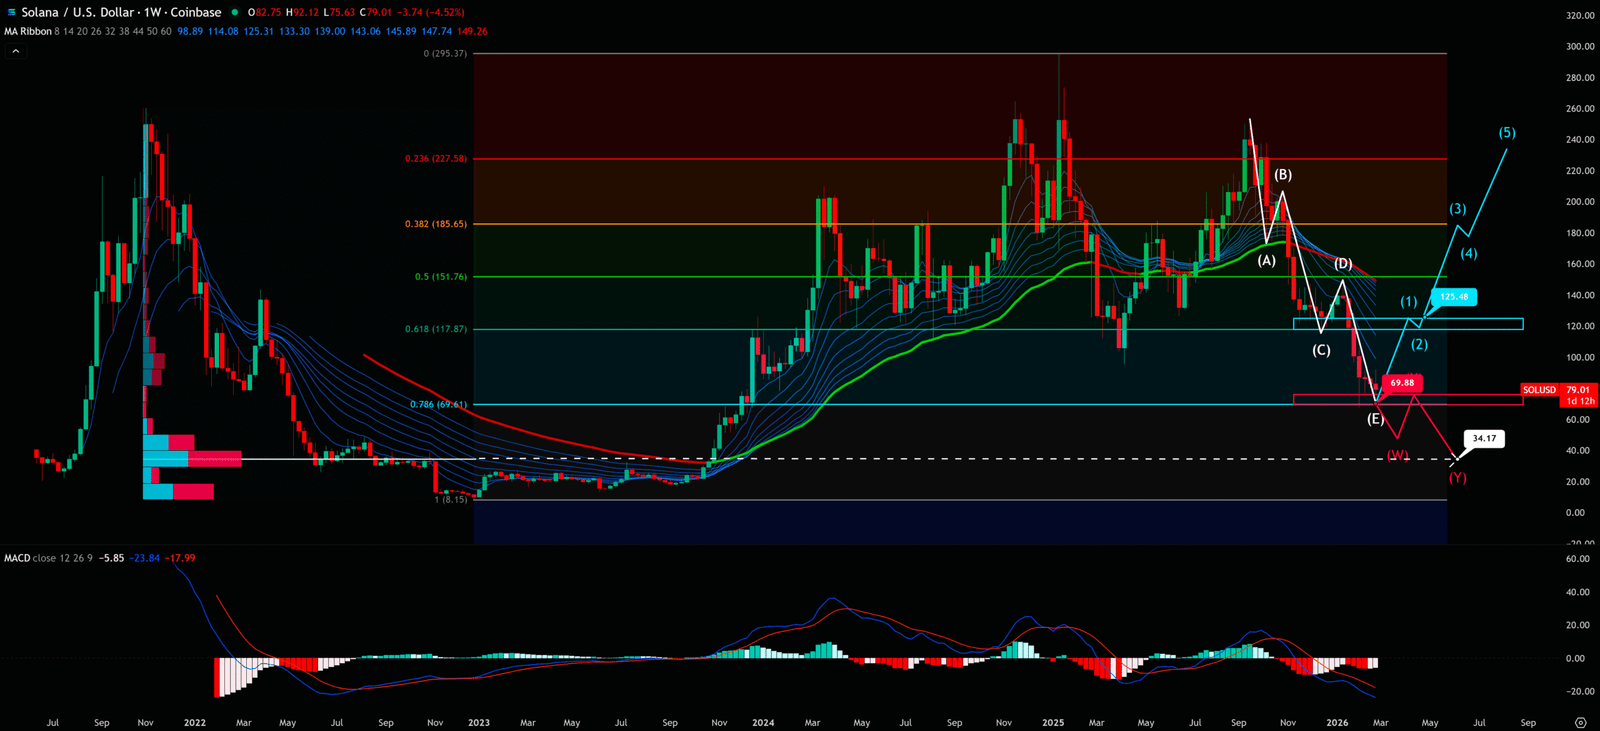
1. Weekly Chart: Finding the Whale’s “Hole Card” From the current weekly chart structure, we see an extremely ugly pattern: “Lower Highs, Lower Lows.” In technical analysis, this is the absolute definition of a Bear Market, meaning sellers are completely dominating the rhythm.
But we need to look deeper. I used the VPFR indicator to trace the volume distribution of SOL’s entire massive cycle from 2021 to 2022. I found a statistic that would chill the spine of any bull:
- POC (Point of Control): The price level with the highest historical volume, where institutional cost is most concentrated, is not 7979, nor 6060, but way down in the abyss at US 34.17.
What does this mean? It means US 34.17 was the core “Original Cost Basis” for Smart Money before the last bull run. According to the principle of “Support and Resistance Flip,” until the price tests this “Super Support” again, big players have little incentive to rebuild massive positions. They would rather wait for the price to drop back to where they think it’s “valuable” than help you carry the sedan chair halfway up the mountain.
- The Vacuum Zone: The current price of US 79 is in a “Vacuum Zone” with no resistance above and no support below. Buying here is like trying to catch a falling knife in mid-air. According to physics, objects fall fastest in a vacuum; similarly, price drops often exceed your imagination in vacuum zones lacking volume support. Betting on a bounce here carries sky-high risk and negligible reward.
Weekly Timeframe for SOL (Solana)


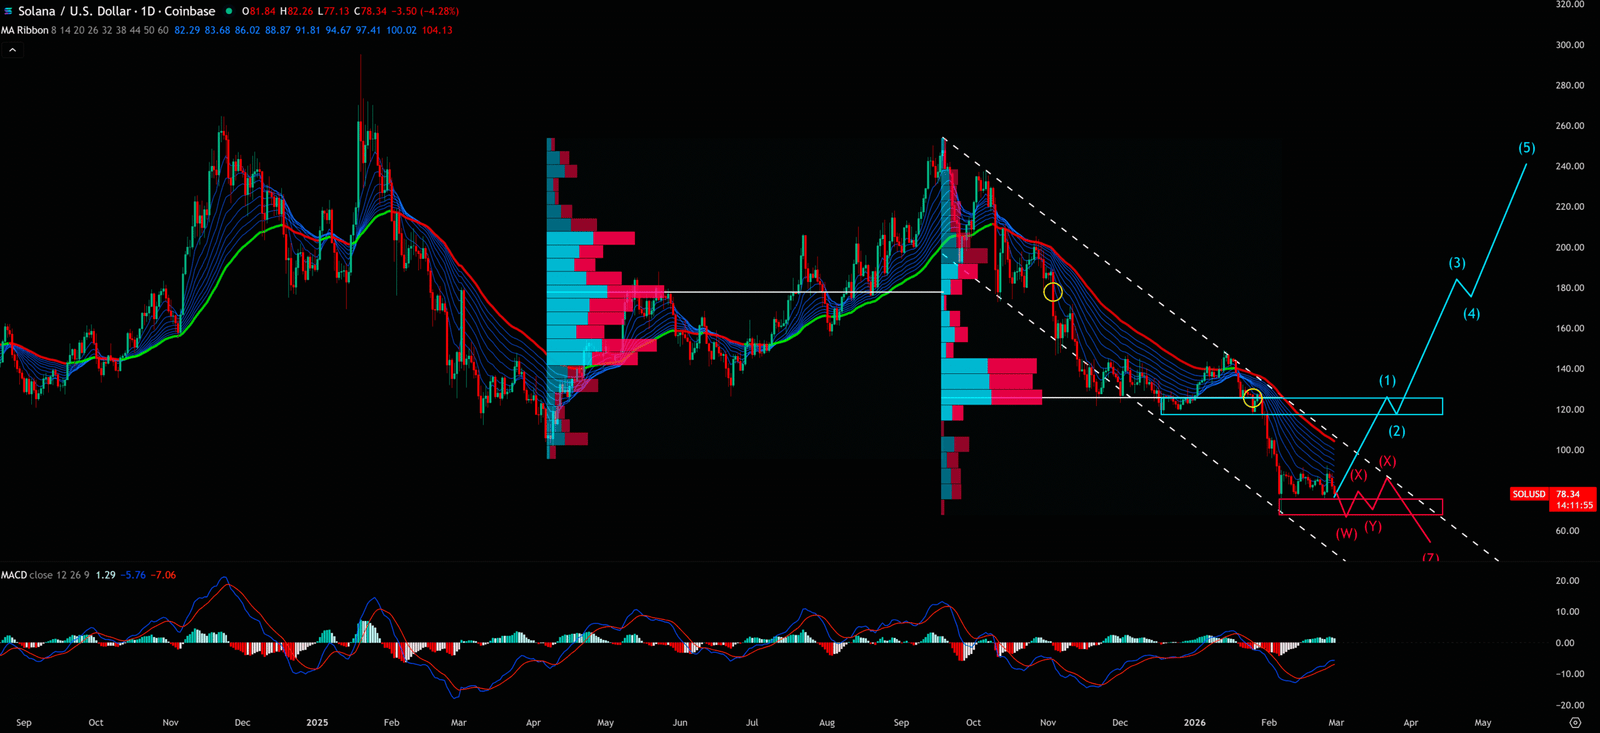
2. Daily Chart: The US 125.48 Wall of “Bag-Holders” Switching to the Daily chart, the situation is even more desperate. SOL attempted a rebound earlier, but every time it hit a brick wall near US 125.48. Why US 125.48? It’s no coincidence.
VPFR gives the answer again: US 125.48 is where the most “bag-holders” (trapped buyers) have accumulated over the past year. Imagine thousands of retail investors who bought at US 125.48 in late 2025 believing the news, now trapped. They have endured long suffering, praying every day: “Just let it go back to US 125.48 so I can break even, and I swear I’ll never trade again!” So, as soon as the price approaches US 125.48, these “bag-holders” will sell frantically just to get out with their capital. This forms an iron “Supply Wall.” Unless there is super positive news combined with astronomical volume, it is impossible to break through in the short term.
The daily chart has just broken short-term support, and the MACD lines are running below the zero axis, indicating that bearish momentum still dominates. Any “pause” in the drop is likely just a “Dead Cat Bounce”—an opportunity for whales to sell one last round.
Daily Timeframe for SOL (Solana)
Synthesis & Unique Insight: Banker vs. Retail Mindset
- The Retail Mindset: “It’s dropped so much, it must be cheap, right? The news says there’s an upgrade! If I don’t buy, I’ll miss out!” — This is trading based on “Hope” and “FOMO.”
- The Banker Mindset: “Where is the liquidity? Where are the stop losses? There’s a bag-holder wall above and a vacuum below. I won’t buy a single share until I see Confirmation.” — This is trading based on “Probability” and “Risk Management.”
The current SOL path is clear. We are at the tail end of a “Distribution” phase and are about to enter the “Capitulation” (Panic Selling) phase.
The Potential Crash Script: The current price of US 79 is just steps away from the critical defense line at US 69.88. US 69.88 is where many medium-to-short-term traders have placed their Stop Loss orders. Once whales push the price below US 69.88 (with a 0.5% buffer), it will trigger a Cascade Effect:
- Long stop losses triggered (becoming market sell orders).
- Massive liquidations in the futures market.
- Price freefalls straight down through the vacuum, targeting US 34.17.
Key Takeaways
Summary / Key Levels: Patience is a Skill. Here is my operational plan:
⛔ Critical Support (Stop Loss / The Line of Death): < US 69.88
- This is the final line of defense. If the Daily candle closes below US 69.88, the downtrend accelerates into a vacuum. (Invalidation level; execute mercilessly)
- Action: If you are holding, this is your hard Stop Loss. Do not hope. Do not pray. If this breaks, the floor is gone.
🛡️ The Safe Entry (The Banker’s Trigger): > US 125.48
- Want to go Long? Not yet. Sit on your hands. Unless BTC can break US 125.48 with a strong bullish candle and hold above it for 3 consecutive days.
- Logic: Only a reclaim of this level proves that the overhead “bag holders” have been absorbed. That is the only high-probability entry.
Our goal is not to provide a crystal ball, but to offer a clear, logical, and actionable framework by simplifying professional analysis.
Conclusion: Patience is the Ultimate Strategy
If you are a Prospective Buyer (No Position): Now is absolutely NOT the time to enter. You must “Wait.” Wait like a hunter for the prey to fall into the trap.
- Strategy A (Sniper): Wait patiently for the price to drop near US 34.17. When you see the market wailing, and the news says “Crypto is Dead,” combined with massive volume support, THAT is your golden opportunity to scale in. This is what Buffett means by “Be greedy when others are fearful.”
- Strategy B (Confirmation): Do not consider buying unless SOL prints a massive green candle closing firmly above US 125.48, confirming that the overhead supply has been absorbed. Otherwise, every bounce is a scam.
If you are a Holder (Trapped):
- Stare at US 69.88. This is your last line of defense, your lifeline. If the daily close breaks this level, execute your stop loss immediately.
- I know it hurts, and admitting a mistake is hard. But a short pain is better than a long one. Preserve your capital, and buy back double the amount at US 34.17. This is the banker’s wisdom of “retreating to advance.”
Remember, Cash is a position too.
Unlocking Technical Analysis: Power Moves with Diagrams !
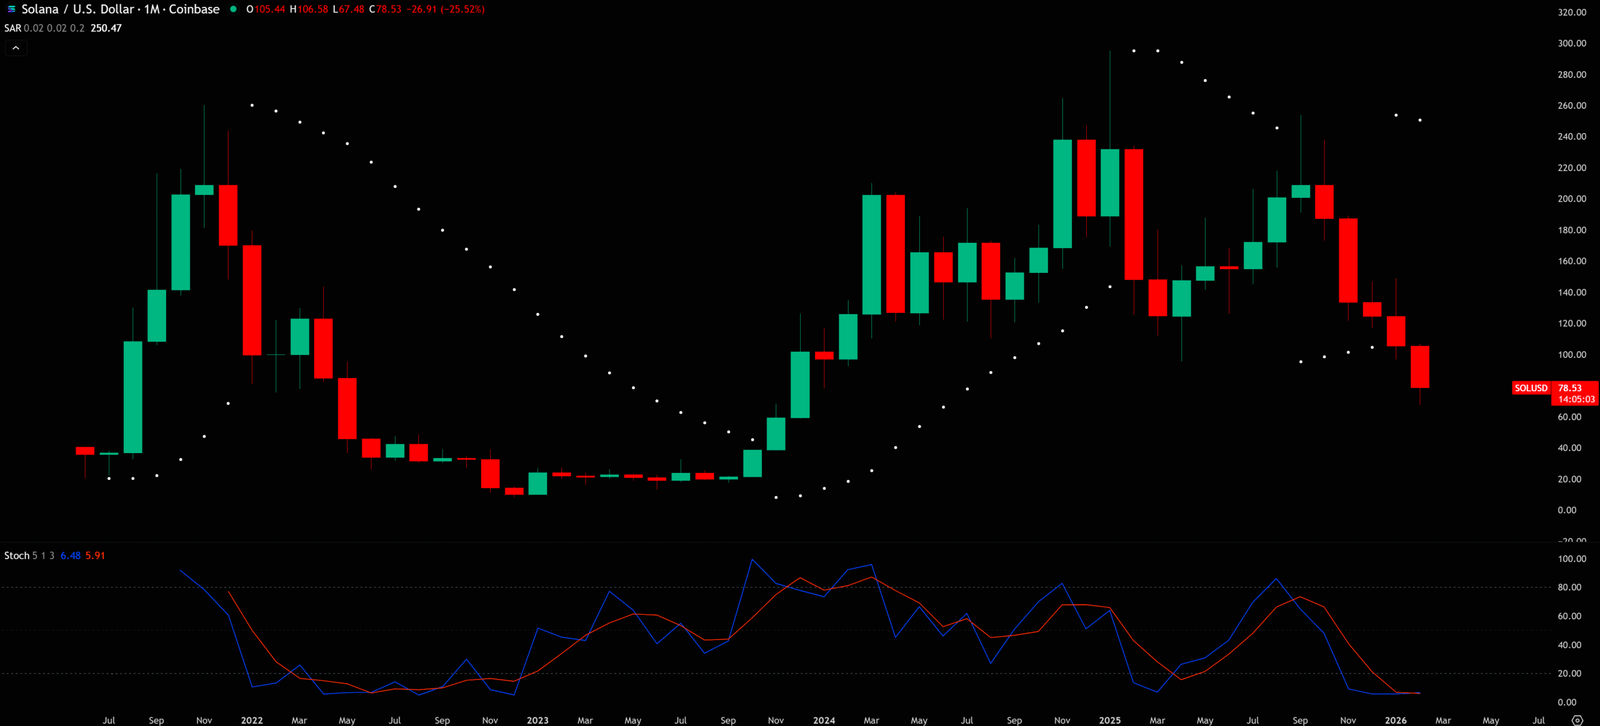
Monthly Timeframe for SOL (Solana)
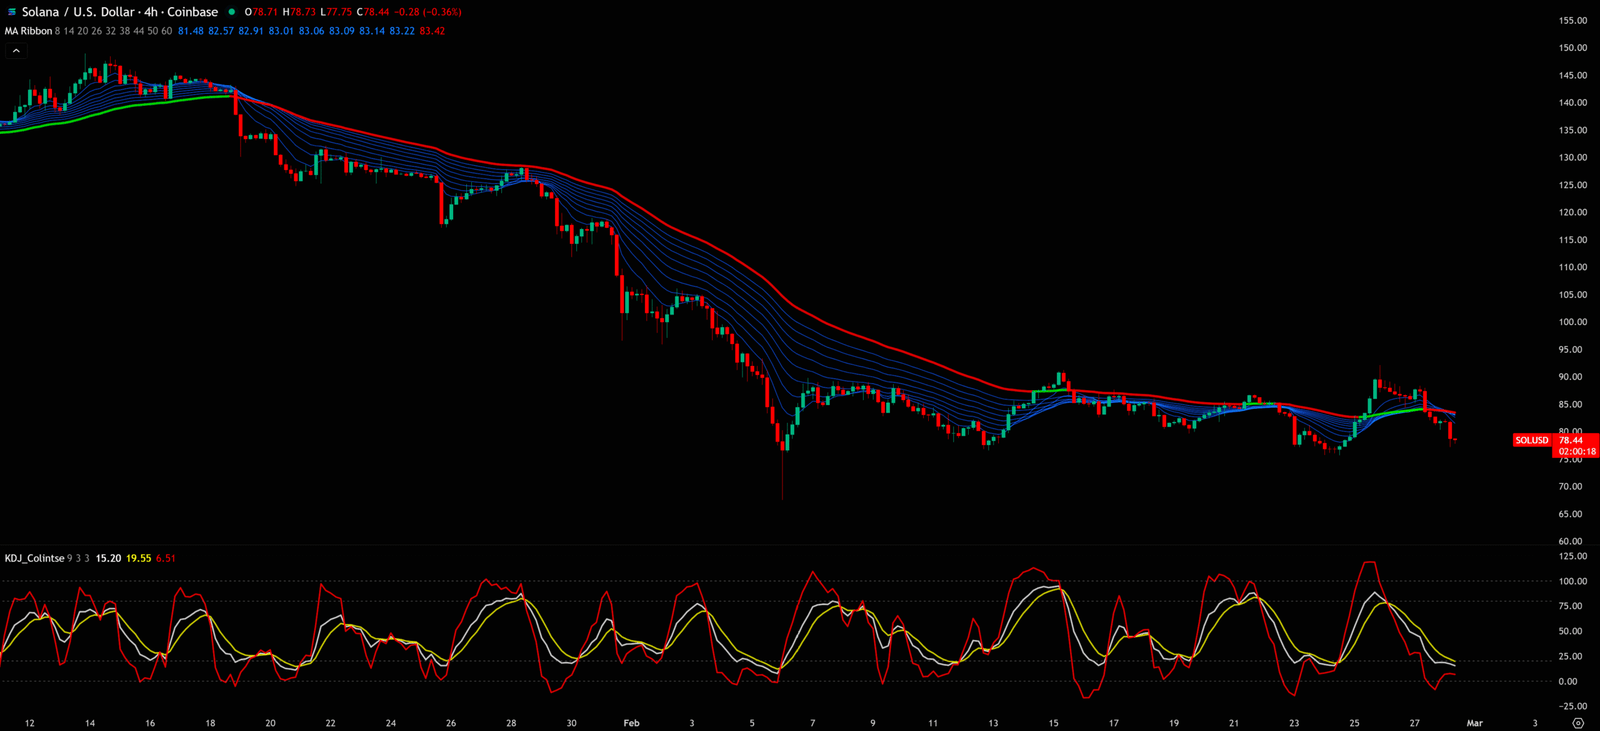
4-Hour Timeframe for SOL (Solana)
Charts don’t lie, but you have to learn their language.
Want to see our full, interactive chart breakdown? If you want to learn how to draw Fibonacci Retracement Ratio yourself, identify S/R Flips, and stop trading blind. Please browse the following『Further Reading』links. Fundamental news tells you what happened. Technical analysis predicts what will happen. To master the professional framework that separates market signal from noise, explore our exclusive models at www.chart-blitz.com.
Further Reading:
- https://www.chart-blitz.com/macd-mastery-decode-market-swings-like-a-pro-dont-miss-out/
- https://www.chart-blitz.com/volume-profile-vpfr-find-the-real-battle-zones-on-the-chart/
- https://www.chart-blitz.com/fibonacci-retracement-the-magic-numbers-behind-every-support-resistance/
- https://www.chart-blitz.com/ribbon-strategy-surfing-trends-with-the-moving-average-ribbon/
- https://www.chart-blitz.com/stochastic-oscillator-short-term-traders-secret-weapon/
- https://www.chart-blitz.com/kdj-indicator-triple-line-magic-for-fast-paced-trading/
- https://www.chart-blitz.com/parabolic-sar-spot-explosive-moves-before-anyone-else/
【Disclaimer】 The content herein is for educational purposes and reflects the author’s personal opinion only; it is not investment advice. All financial investments, including cryptocurrencies, carry significant risk, and you could lose your entire capital. To support this site, this article may contain affiliate links. While we strive for accuracy, we cannot guarantee all information is complete or error-free. Please conduct your own research and be fully responsible for your own investment decisions.