The speculator’s chief enemies are always boring from within. It is inseparable from human nature to hope and to fear
William Delbert Gann – 1949
Hey fellow crypto traders! Felt the thrilling roller coaster ride of Solana (SOL) recently? One moment it’s soaring, the next it takes a dive, leaving everyone on edge.
Don’t worry! We’re cutting through the complexity. Right now, whether SOL is about to stage a massive “V-shaped rebound” or if it’s time to be cautious, the entire story hinges on one magic number: US$168.79. Here’s the simple reason why this price level is so crucial.
ANALYSIS BENCHMARK STATEMENT:
- All technical analysis below is based on a price snapshot locked in on October 15, 2025, 16:16 (UTC+8): SOL = 203.00 USD.
- This price snapshot provides a stable reference point. Market prices change in an instant; readers should treat this report as an “analytical map,” not a real-time quote.
The Predictive Lens: A Multi-Timeframe Technical Deep Dive
Multi-Timeframe Technical Deep Dive (The Predictive Lens) To see the full picture, we must tune out the noise from the news and focus on the clues provided by the charts themselves.
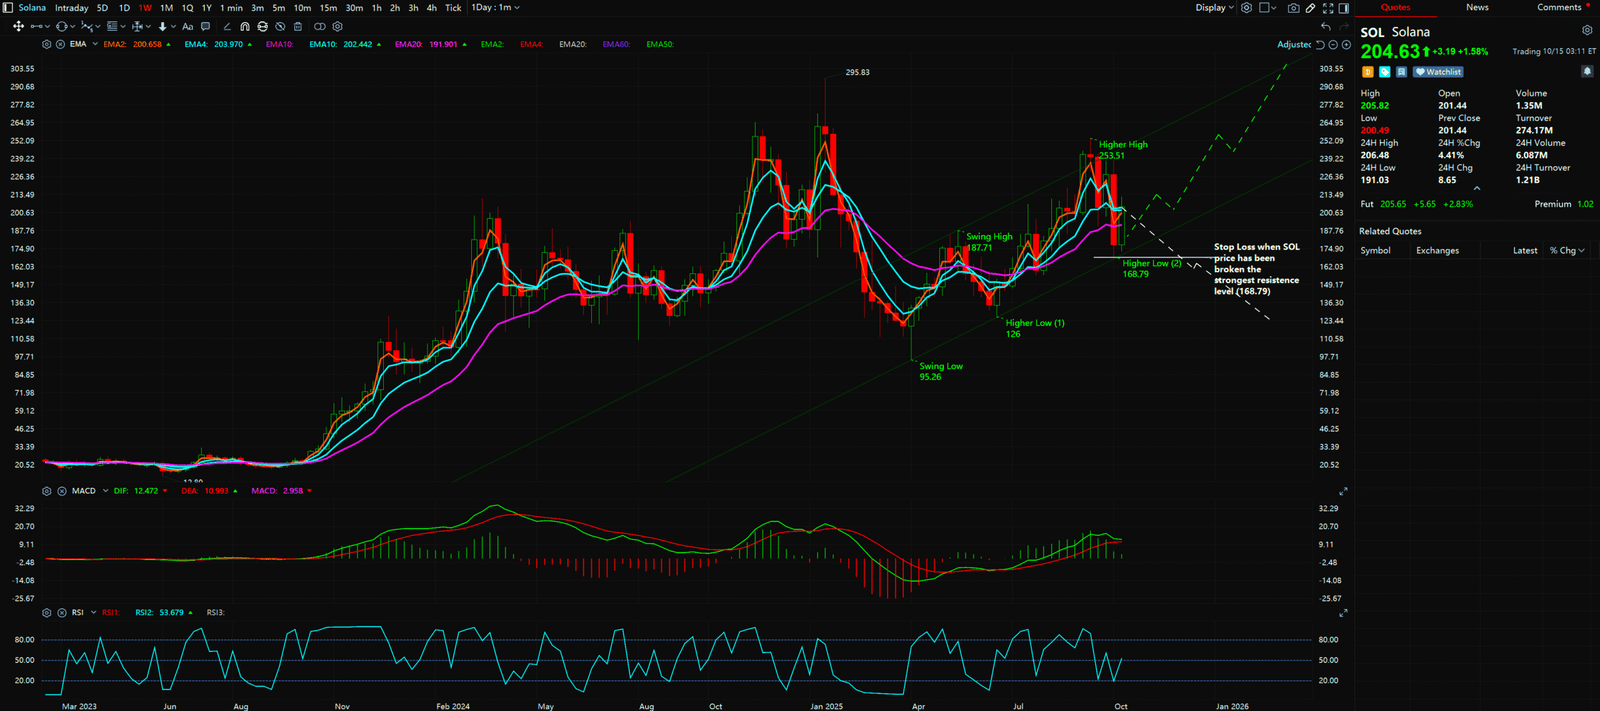
The Big Picture: SOL is Still on an Uphill Climb. Let’s take a step back. From your provided weekly chart, we can see SOL has been on a beautiful “uphill path”:
- Higher Highs: The peaks it creates are successively higher ($187.71 -> $253.51).
- Higher Lows: Even when it pulls back, the low points aren’t as low as the previous ones ($95.26 -> $126).
This is a classic “uptrend.” The recent sharp drop is like taking a break at a pavilion, and US$168.79 is the foundation of this “pavilion.”
The Magic Number: Why is US$168.79 the Key to Everything?
This price level is a significant “Higher Low” on the chart, serving as the last line of defense for the bulls. Two scenarios are now playing out:
- Scenario A (The Bull Case): The V-Shaped Rebound 🚀
- The Plot: SOL’s price drops to around US$168.79, and like a basketball hitting the court, it finds strong support and “bounces” back up powerfully.
- The Signal: If this happens, it signifies the uptrend remains intact and could be the starting point for the next bull run.
- Scenario B (The Bear Case): The Breakdown Trap ⚠️
- The Plot: SOL’s price not only touches US$168.79 but smashes right through it. This is like the final defensive wall being breached.
- The Signal: This is a dangerous alarm, suggesting the “uphill path” may be over. Risk management becomes paramount.
What Do the Experts’ Tools Say? A Simple Look at MACD
Is one price level enough? Let’s cross-reference with the MACD indicator:
- Weekly Chart (Long-term): Both MACD lines are above the zero axis, meaning SOL is in a long-term “strong zone,” like a car on the highway.
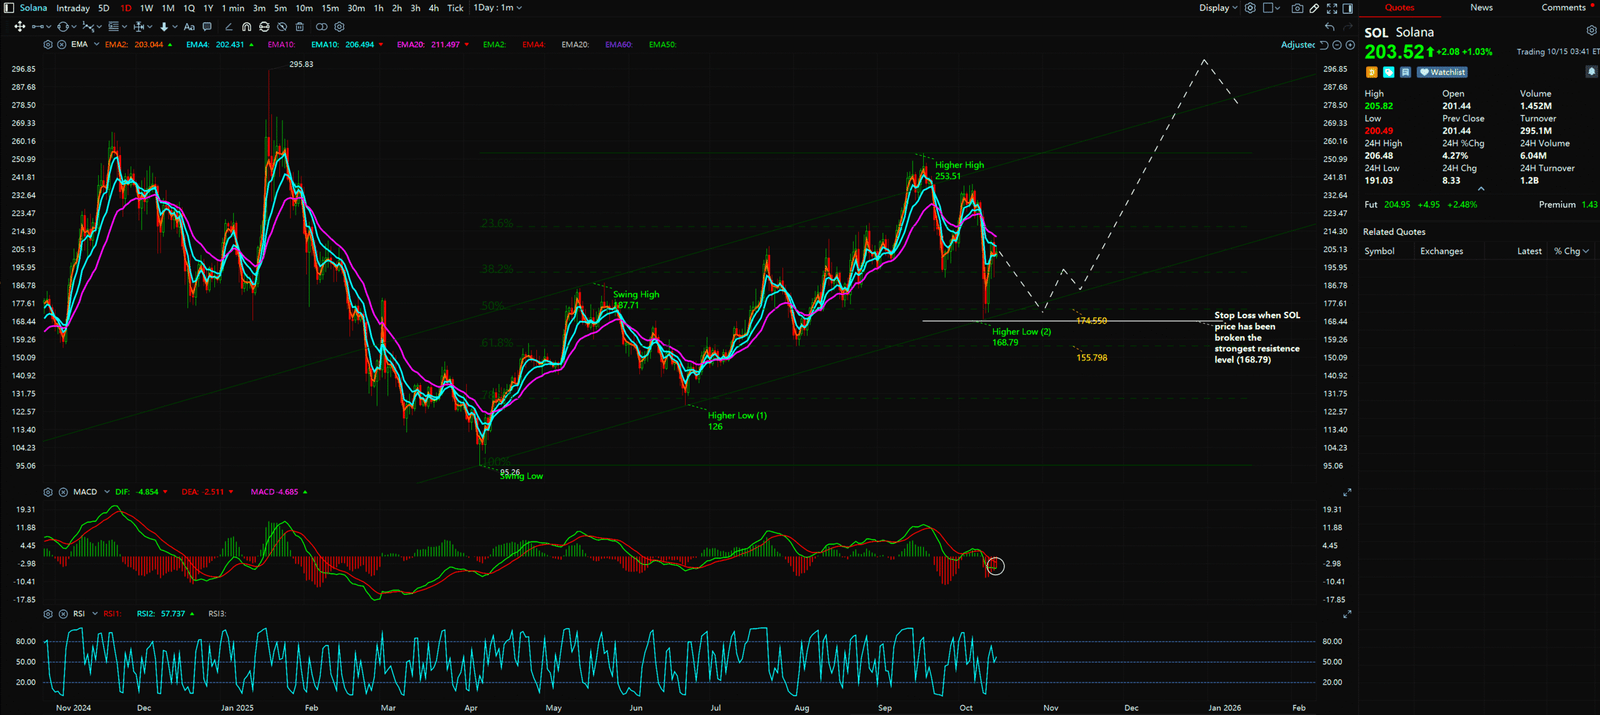
- Daily Chart (Short-term): Both MACD lines have dipped below the zero axis, indicating a short-term “weak zone,” like a car on a bumpy side road.
The combined reading: The long-term trend is up, but there’s short-term pullback pressure. This perfectly aligns with our “fortress siege” scenarios!


Key Takeaways
Summary / Key Price Levels: Now is the time for observing, not guessing.
- Core Battlefield / Major Support: $168.79 USD
- Initial Upper Resistance: $250.00 USD (Psychological level and near previous highs)
For continuous, real-time analysis of these developing market structures, visit www.chart-blitz.com.
Fundamental news tells you what happened. Technical analysis predicts what will happen. To master the professional framework that separates market signal from noise, explore our exclusive models at www.chart-blitz.com.
Sources:
- https://cointelegraph.com/tags/solana
- https://www.coindesk.com/price/solana/
- https://www.theblock.co/latest
Unlocking Technical Analysis: Power Moves with Diagrams !
Monthly Timeframe for Solana (SOL)
Daily Timeframe for Solana (SOL)