Physical Address
304 North Cardinal St.
Dorchester Center, MA 02124
Physical Address
304 North Cardinal St.
Dorchester Center, MA 02124
The speculator’s chief enemies are always boring from within. It is inseparable from human nature to hope and to fear
William Delbert Gann – 1949
Solana (SOL) has captured the market’s attention, fueled by a powerful narrative of network upgrades like “Firedancer” and surging institutional interest. This wave of positive news serves as the catalyst, drawing widespread focus to the asset. It’s the starting point for our analysis, but it only tells half the story—the part that has already happened.
The Catalyst & The Fundamental View (The Rear-view Mirror): The recent excitement surrounding Solana is not unfounded. Announcements regarding the upcoming Firedancer client, which promises to dramatically increase transaction throughput and network efficiency, have painted a very bullish long-term picture. Major financial institutions have also published reports highlighting SOL’s growing adoption and potential as a legitimate Ethereum competitor. Many market participants see this confluence of positive developments as a straightforward “buy” signal, creating a strong sense of optimism. This fundamental backdrop explains why we are looking at Solana, but it doesn’t provide a precise strategy for how or when to act.
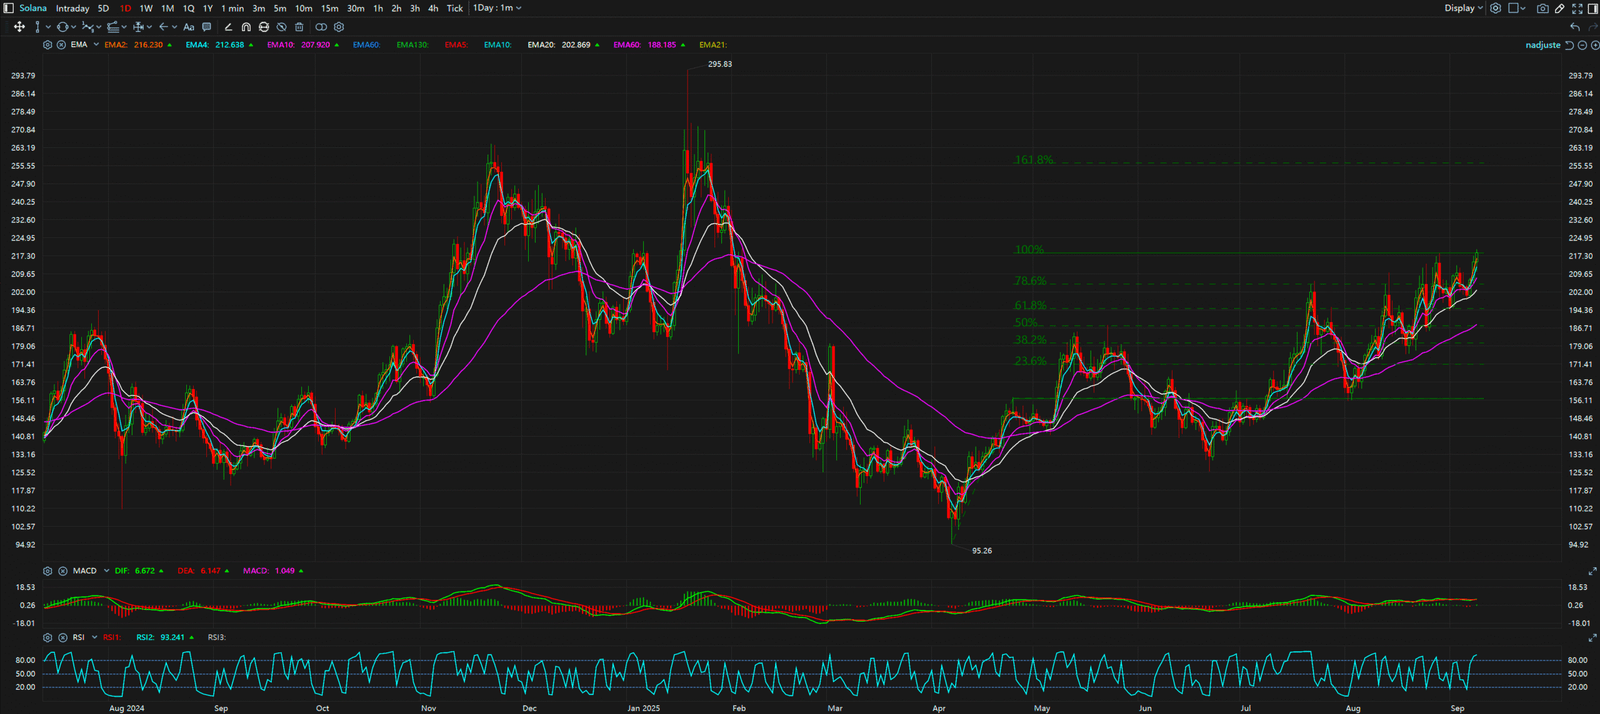
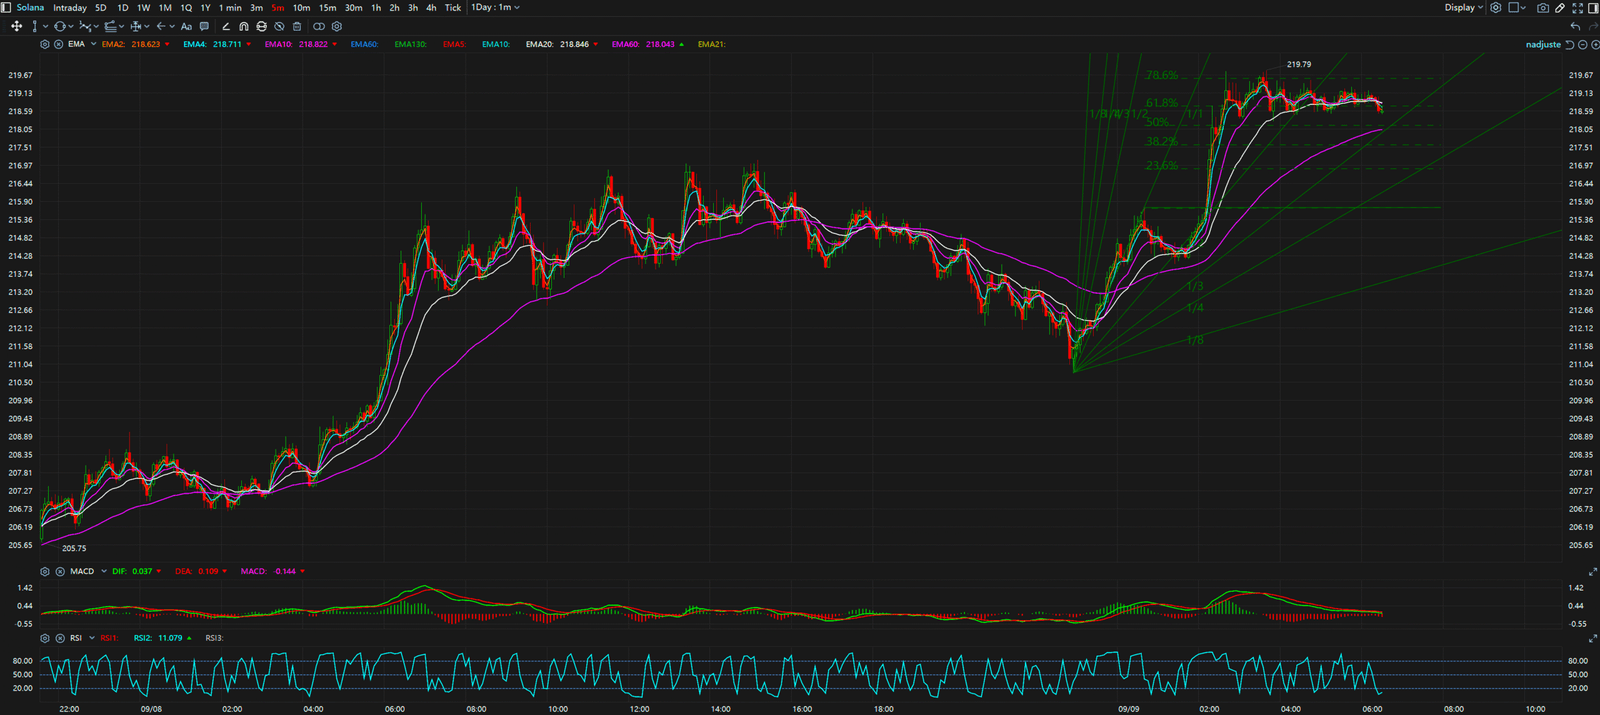
Multi-Timeframe Technical Deep Dive (The Predictive Lens): This is where the real analysis begins, moving from the known past to the probable future. A disciplined look at market structure across multiple timeframes reveals a more nuanced and actionable story.
The crucial insight comes from synthesizing these conflicting timeframes. We have a clear trend divergence: the Daily and 4-Hour charts are strongly bullish, while the 30-Minute and 5-Minute charts are turning bearish.
What does this mean? The weakness seen on the lower timeframes is not a signal that the entire uptrend is reversing. Instead, it is very likely a temporary pullback or consolidation within a much larger bullish structure. The fundamental news has created a macro tailwind, but the short-term price has gotten ahead of itself. This divergence is precisely the setup that professional traders look for. It suggests that the current dip is an opportunity to enter the market at a more favorable price, anticipating a continuation of the dominant daily and 4-hour uptrend. Blindly buying based on the news would have meant entering at the short-term top. A technical approach allows for a strategic entry.


The analysis indicates that Solana’s long-term outlook remains highly positive, but a short-term correction is currently in play. This should be viewed as a potential buying opportunity, not a reason for panic.
For continuous, real-time analysis of these developing market structures, visit www.chart-blitz.com.
True trading advantage comes from decoding these conflicting signals. To learn the professional-grade framework for seeing the market’s real intentions, explore our exclusive models on www.chart-blitz.com.
Sources:
Daily Timeframe for Solana (SOL)

5-Minutes Timeframe for Solana (SOL)
