The speculator’s chief enemies are always boring from within. It is inseparable from human nature to hope and to fear
William Delbert Gann – 1949
The cryptocurrency world is buzzing with Solana (SOL) as payment giant Visa announced the expansion of its USDC settlement capabilities to the Solana blockchain. This fundamental catalyst has ignited a firestorm of interest, painting a seemingly straightforward bullish picture. However, viewing this news as a simple “buy” signal is looking in the rear-view mirror. To predict what comes next, one must turn to the charts, where the real story unfolds.
The Catalyst: A Rear-View Mirror Perspective Visa’s integration is undeniably a landmark achievement for Solana. It provides powerful validation of its high-speed, low-cost infrastructure and opens the door for significant mainstream financial flows. The market’s initial reaction is logical: the prospect of increased utility and adoption has led to a surge in buying pressure. Many will see this news and conclude that SOL is destined for new highs, viewing any price below the current level as a missed opportunity. This perspective, while optimistic, is based on an event that has already happened and is now public knowledge. It tells you why the market is moving, but not how or where it will go next.
The Predictive Lens: A Multi-Timeframe Technical Deep Dive
This is where a disciplined technical framework separates signal from noise. By analyzing Solana’s market structure across different timeframes, a more nuanced, predictive narrative emerges.
- The Daily Chart (The Big Picture): On the daily timeframe, SOL has been in a structural uptrend for several months, characterized by a clear pattern of Higher Highs (HH) and Higher Lows (HL). The 20 and 60-period EMAs are in a bullish cross, confirming the long-term upward momentum. However, the recent price surge is now rapidly approaching a major historical resistance level—a previous all-time high where significant selling pressure has previously occurred. This is a critical juncture.
- The 4-Hour Chart (The Immediate Trend): Zooming in, the 4-hour chart shows the direct impact of the Visa news. A powerful impulsive wave has shattered a recent consolidation range. The trend is unequivocally bullish, printing aggressive Higher Highs and Higher Lows. This confirms the short-to-medium term strength.
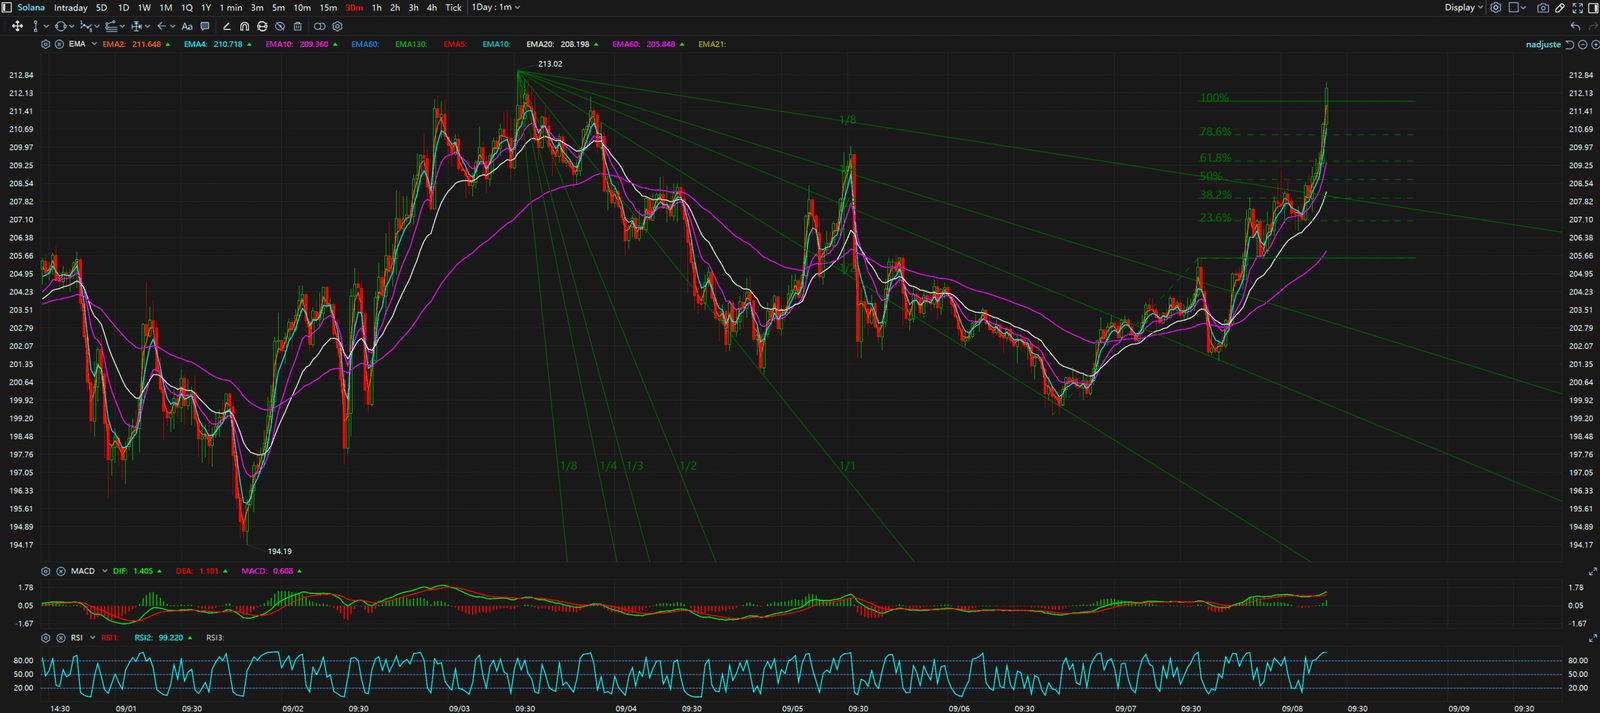
- The 30-Minute Chart (The Emotional Engine): On the 30-minute chart, the price action is almost parabolic. While the structure is still technically a series of HH and HL, the steepness of the ascent is a warning sign. The Relative Strength Index (RSI) is deep in overbought territory and is beginning to show signs of bearish divergence—where price makes a new high, but the RSI fails to do so. This hints that the initial burst of buying momentum is starting to wane.
The 5-Minute Chart (The First Cracks): This is where the earliest signs of a shift appear. After the peak euphoria, the 5-minute chart is starting to print the first Lower High (LH), failing to break the immediate previous peak. This is the first indication that sellers are beginning to challenge the buyers and that the relentless upward push is pausing.
Synthesis and The Professional’s Viewpoint
Here lies the crucial insight: a trend conflict across timeframes. The Daily chart shows a strong uptrend but is nearing a major obstacle (resistance). The 4-hour chart is strong. But the 30-minute and 5-minute charts are flashing warning signs of exhaustion and a potential short-term reversal. This is not a signal to short Solana. The high-timeframe trend is still powerfully bullish. Instead, this multi-timeframe divergence suggests that chasing the pump at the current price is a high-risk, low-reward proposition—a classic FOMO trap. The professional approach is to wait. The analysis predicts that a pullback or consolidation is likely. This pullback would serve to shake out the late, emotional buyers and would form the next Higher Low on the 4-hour and Daily charts. That consolidation, likely around the top of the previous 4-hour resistance zone, is the true, strategic entry opportunity.


Key Takeaways
The Visa news was the spark, but market structure is the map. While the long-term outlook for Solana is fundamentally stronger, the immediate price action is over-extended.
- Key Resistance: The historical daily high at [Insert Price Level]. A failure to decisively break this level will confirm the need for a consolidation.
- Key Support: The breakout level from the previous 4-hour consolidation range at [Insert Price Level]. This is the primary zone to watch for a potential dip-buying opportunity.
For continuous, real-time analysis of these developing market structures, visit www.chart-blitz.com.
True trading advantage comes from decoding these conflicting signals. To learn the professional-grade framework for seeing the market’s real intentions, explore our exclusive models on www.chart-blitz.com.
Sources:
Unlocking Technical Analysis: Power Moves with Diagrams
Daily Timeframe for Solana (SOL)

30-Minutes Timeframe for Solana (SOL)