The big money is not in the individual fluctuations, but in the main movements. That is, not in reading the tape but in sizing up the entire market and its trend.
Jesse Livermore – 1923
Here we go again. 🤦 The financial media headlines are just now, with an air of grand discovery, reporting that “U.S. brokerages broadly beat second-quarter profit estimates, benefiting from increased market volatility and a rebound in retail investor engagement.” (Source: Reuters, August 2025). They report this as if it’s breaking news, describing a reality that was cemented on the price charts months ago. While mainstream analysts are still busy calculating P/E ratios and dissecting management’s carefully scripted conference calls, trying to unearth “growth drivers” from polished press releases, those of us who read the charts simply look at our screens and let out a quiet sigh. For anyone who understands the language of the market, this is all ancient history. This so-called “good news” is nothing more than the breadcrumbs Wall Street leaves behind after they’ve finished their feast, tossed to the retail crowd to lure them into buying at the top and providing the liquidity for the next cycle of fleecing. The script of this game never changes, only the actors and the lines they recite.
The Fundamental Statement: A Meticulously Staged Wall Street Production
To understand this grand production, we must first examine the official script—the story Wall Street wants you to believe. It goes something like this: the U.S. securities brokerage and dealing industry is a colossal market, valued in the hundreds of billions. According to the latest industry reports, it’s projected to grow at a steady compound annual growth rate (CAGR) of 5.8% through 2027 (Source: Grand View Research). The pillars of this growth narrative are the perpetual accumulation of wealth, the great wealth transfer from retiring Baby Boomers, and the rise of a new generation of investors (Millennials and Gen Z). On this grand stage, the key players each have their perfectly cast roles.
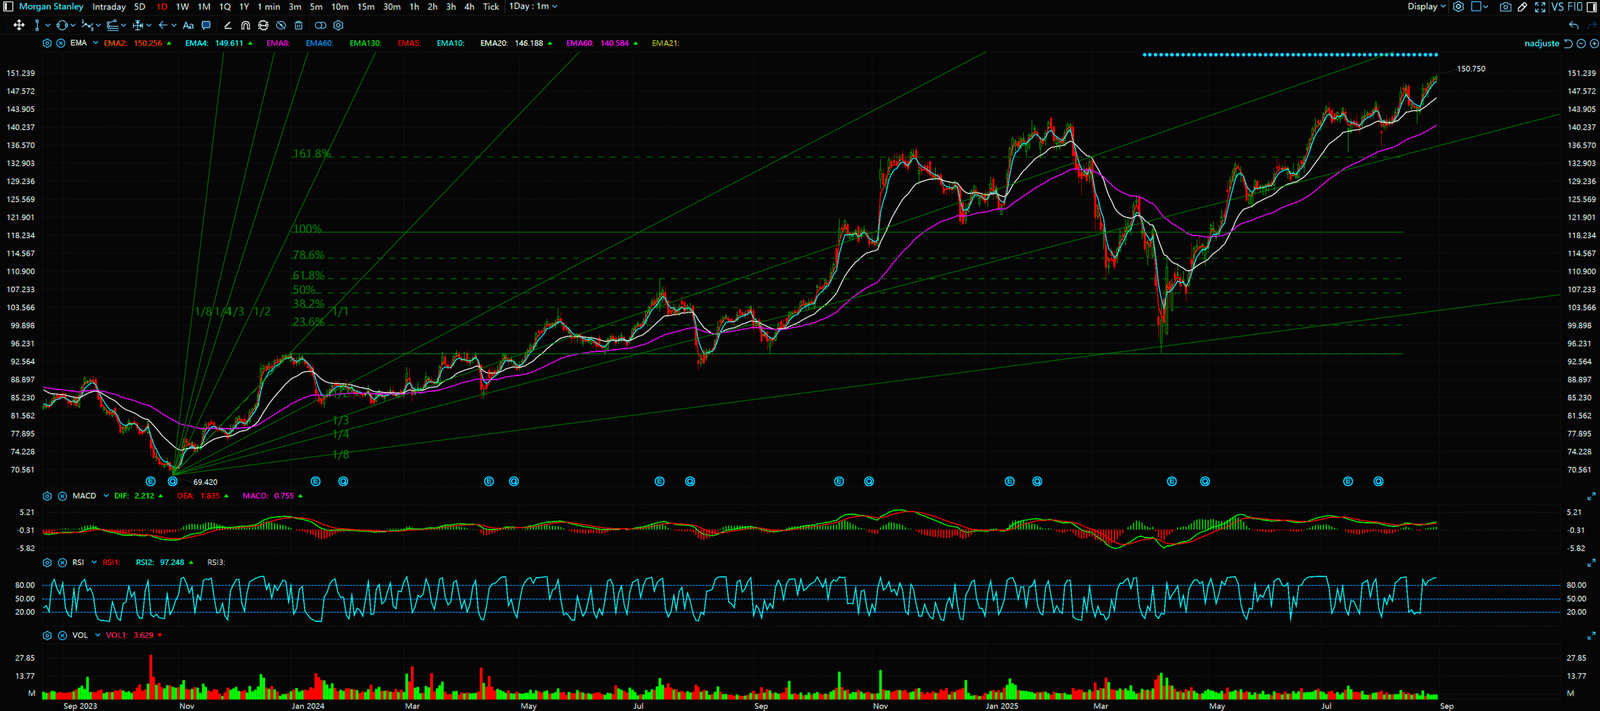
- The King 👑: Morgan Stanley (MS)
- The Official Script (Core Advantage): As the blue-blooded aristocrat of Wall Street, Morgan Stanley’s core advantage is its unparalleled “Wealth Management” empire. Through strategic acquisitions like E*TRADE and Eaton Vance, it has not only solidified its dominance in the high-net-worth client segment but also extended its powerful reach into the mass affluent market. Its client assets, now exceeding $10 trillion (Source: MS Q2 2025 Earnings), form a seemingly impenetrable moat, generating a steady, predictable stream of fee-based revenue. Wall Street will tell you that this service-based model makes it incredibly defensive during market downturns, a paragon of “value investing.”
- The Achilles’ Heel: What the script conveniently omits, however, is how slowly and ponderously this elephant turns. Its massive organizational structure and deep-rooted dependence on high-net-worth clients make it appear sluggish and lacking in innovation when faced with nimble fintech disruptors and their revolutionary business models. Its cost structure is exorbitantly high, and any significant market downturn erodes its profitability far more than outsiders can imagine. The integration of E*TRADE, while painted as a masterstroke, is fraught with ongoing cultural clashes and technical integration headaches—a potentially massive, hidden liability.
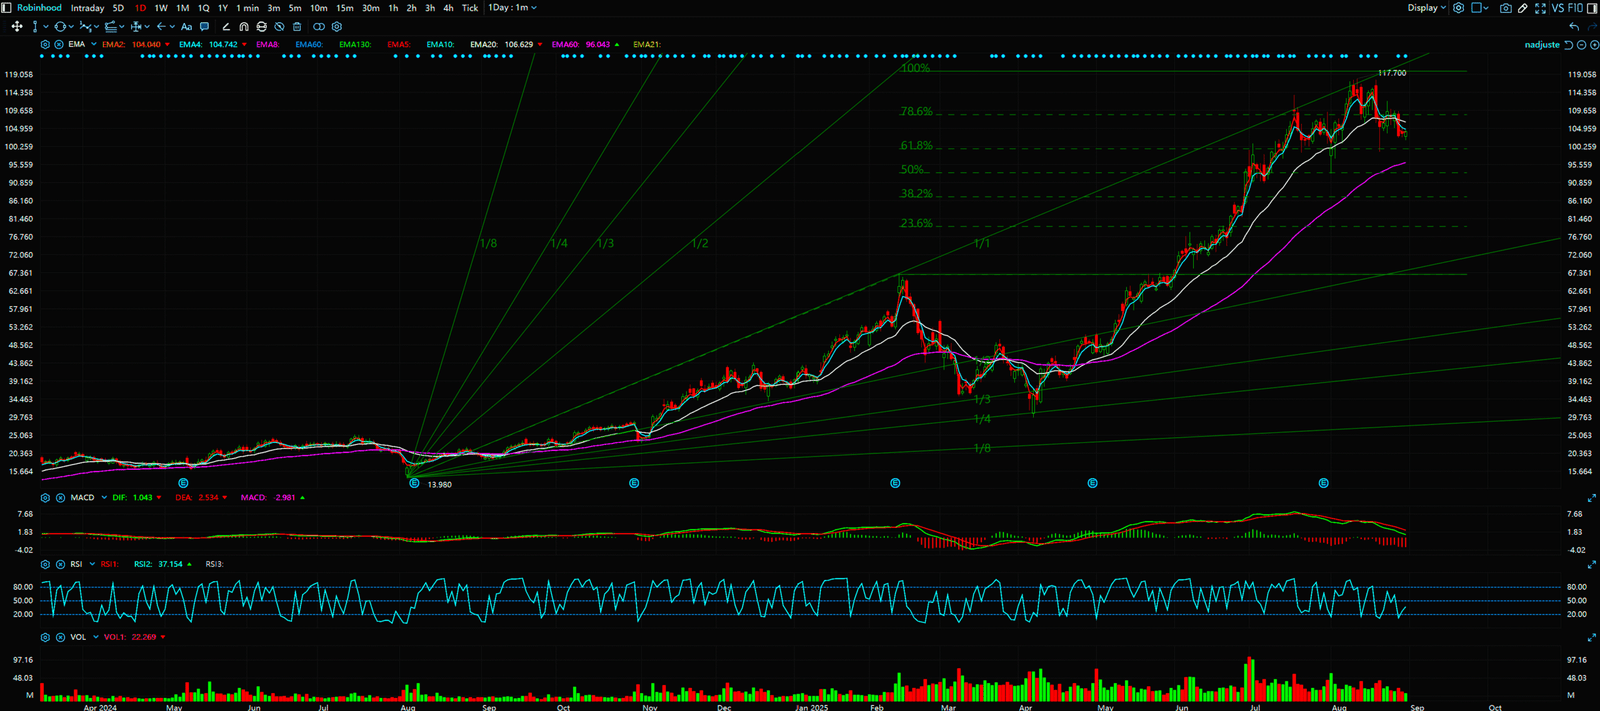
- The Challenger ⚔️: Robinhood (HOOD)
- The Official Script (Core Advantage): Robinhood is the rebel and revolutionary of this drama. Its core advantage is its “User Experience” and the “commission-free” model that successfully “gamified” investing. It has attracted over 23 million monthly active users (Source: Robinhood Q2 2025 Earnings), a vast number of whom had never touched the stock market before. Wall Street pitches it as a pioneer of financial democratization, the very future of the industry, representing limitless growth potential. Its revenue from cryptocurrency and options trading is lauded as a brilliant example of successful diversification.
- The Achilles’ Heel: But the other side of the script tells a different story. Robinhood’s entire existence is precariously balanced on an extremely dangerous factor: heightened speculative market sentiment. Its primary revenue source, the controversial “Payment for Order Flow (PFOF),” is under intense regulatory scrutiny. The moment the market cools and the retail gambling fever subsides, its trading volumes and revenues are poised for a cliff-dive. More fatally, it commands almost zero “trust” from its user base. From the infamous trading restrictions during the GME saga to multiple system outages, its reputation for “robbing the poor to pay the rich” is deeply ingrained. Its user stickiness is built not on a bedrock of trust, but on the shifting sands of speculative mania.
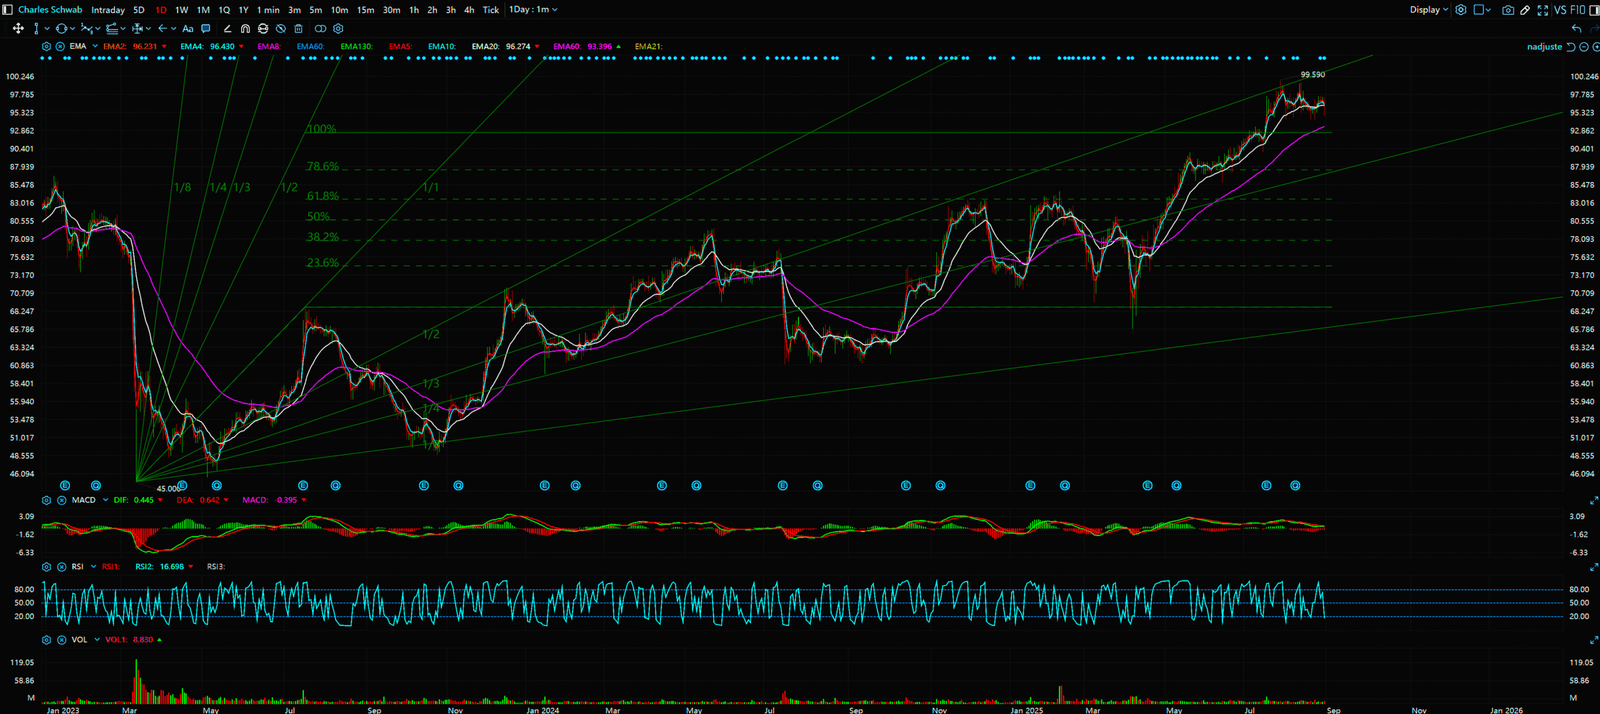
- The Old Giant 🐘: Charles Schwab (SCHW)
- The Official Script (Core Advantage): Charles Schwab is the pragmatic colossus of the industry. It was a first-mover in the commission wars and, through its titanic acquisition of TD Ameritrade, created a super-brokerage monster with over $8 trillion in assets under management (Source: Schwab Q2 2025 Earnings). Its core advantage lies in its immense “Scale” and its “Hybrid Model.” It offers a low-cost platform for self-directed investors while also providing advisory services for those who need guidance, attempting to capture the entire spectrum of the market. The story sounds invincible: scale begets cost advantages, and diversified services beget stability.
- The Achilles’ Heel: The reality is that a “do-everything” strategy often means a “master-of-none” execution. In terms of user experience, it is leagues behind the slick, youth-appealing interface of Robinhood. In high-end wealth management, it cannot compete with the brand prestige and depth of Morgan Stanley. It has become an awkward “man in the middle.” More critically, its business is extremely sensitive to interest rates. In a low-rate environment, its net interest income gets squeezed hard. And the process of integrating TD Ameritrade—the technical complexities, the client attrition, the cultural friction—is far more painful and costly than the sanitized lines in its financial reports would suggest. It’s like an aircraft carrier built by welding two massive ships together; it looks immense, but it’s riddled with structural weaknesses.
The Key Turning Point: But Does Any of This Actually Matter?
Now, let’s take a deep breath and ask the most fundamental question of all: Does any of the above actually matter? Do these lengthy dissertations on market size, client assets, and business models—these “Official Stories” so carefully crafted by corporate PR and Wall Street analysts—actually help you make money in the market?
The answer is an unequivocal NO.
This fundamental information is, at best, a rearview mirror. It tells you what happened in the past and explains why a company’s stock is priced where it is today. But investing is a game about the future. You need a map, not a rearview mirror. When a glowing earnings report is released, you might think you’ve struck gold. In reality, the positive results in that report were priced into the stock by smart money months ago. The “news” you are reading is the leftovers from a banquet you weren’t invited to. The investment decisions you make based on these breadcrumbs are, in essence, you paying for someone else’s profits.
This entire exercise of fundamental analysis is a meticulously designed puppet show. Morgan Stanley’s “stability,” Robinhood’s “growth,” Schwab’s “scale”—these are just scripts held by the actors. They read their lines aloud on stage, determined to make you believe the story is real. But the real players never watch the actors’ lips. They watch the puppeteer’s hands—the flow of capital. And that flow is recorded truthfully and irrefutably in only one place: the chart. The rise and fall of candlesticks, the ebb and flow of volume, the breach of key support and resistance levels—this is the language of the market, the only footprints that money leaves behind.
Let’s conduct a simple thought experiment. Imagine that three months ago, you read an analyst report praising Robinhood’s incredible user growth and the boundless potential of its crypto business. You were captivated by this “growth story” and confidently bought shares of HOOD. And then what? You endured the subsequent long decline or sideways grind, frantically refreshing the news every day, hoping for a sliver of good news to soothe your bleeding account. Now, let’s rewind and play it differently. What if, instead of the news app, you had opened the price chart for HOOD? What would you have seen? You might have noticed that despite the universally positive news, the stock was repeatedly failing at a key resistance level. You would have seen that volume was not confirming the price advances, and that bearish divergences were appearing. The chart was telling you in the clearest possible language: smart money is exiting. This is not an opportunity; it’s a trap. You didn’t need to know about PFOF or user metrics. The chart had already revealed the secret Wall Street didn’t want you to know.


Conclusion: Stop Being a Sheep. Learn to Read the Map.
In the brutal, zero-sum game of the market, you have only two choices: you can either continue to be a docile sheep, content to graze on the stale, expired fundamental fodder the media feeds you while you wait for your turn to be sheared. Or, you can evolve into a formidable hunter and learn to read the only map that matters—the technical chart.
Fundamental analysis gives you a false sense of security. It makes you feel like you’ve grasped a company’s intrinsic value and made a rational decision. But that “value” has already been priced in. Technical analysis does the opposite. It strips away the narratives, the noise, and the lies, and confronts the raw essence of the market: supply, demand, and mass psychology. It doesn’t study what a company should be worth; it studies where capital is actually flowing.
Mastering the ability to read a chart is not magic. It is the single most critical survival skill in this dark forest. It allows you to identify the footprints of money, to align yourself with the Wall Street giants who write the scripts, instead of being a casualty in their play. This is the only path to financial freedom, the only way to escape the fate of being the retail exit liquidity.
Stop driving while staring at the rearview mirror. It’s time to look up and learn to read the map ahead.
Visit our website now. Stop guessing, and start learning the real rules of the game.
Sources:
- Grand View Research, “U.S. Securities Brokerage & Dealers Market Size, Share & Trends Analysis Report.”
- Morgan Stanley, Q2 2025 Earnings Report.
- Robinhood Markets, Inc., Q2 2025 Earnings Report.
- The Charles Schwab Corporation, Q2 2025 Earnings Report.
- Reuters News, August 2025.
Unlocking Technical Analysis: Power Moves with Diagrams
Daily Timeframe (MS)
Daily Timeframe (HOOD)
Daily Timeframe (SCHW)