The big money is not in the individual fluctuations, but in the main movements. That is, not in reading the tape but in sizing up the entire market and its trend.
Jesse Livermore – 1923
It’s almost comical at this point. 😴Just this week, the usual chorus of financial news outlets began parroting the latest market research report, this time from Grand View Research. They breathlessly announced that the global life sciences tools market is projected to swell to an astronomical $250 billion by 2030. They cited a “robust 7.8% compound annual growth rate.” They painted a picture of a golden future, a surefire bet for any investor savvy enough to get in on the action. And as this “news” hits the screens of millions of retail traders, those of us who speak the language of the chart can only lean back in our chairs and sigh. This isn’t news; it’s an obituary for a past opportunity.
This forecast, this “alpha,” is nothing more than a lagging confirmation of a trend that smart money—the institutional giants, the hedge funds, the real players—set in motion months, if not years, ago. While the average Joe was being told to diversify into index funds, these market titans were quietly, patiently, and ruthlessly accumulating positions.
Their movements weren’t broadcast on CNBC. They were etched, candlestick by candlestick, onto the charts of the sector’s key players. The “news” you are reading today is simply the final act of their play. It’s the carefully timed release of information designed to create a wave of public excitement, a frenzy of buying from the retail crowd. And who do you think is selling to this excited crowd at these elevated prices? That’s right. The very same institutions that bought in at the bottom. You’re not getting in on the ground floor; you’re being invited to paint the penthouse, just before the owners sell the building. This entire spectacle is a masterfully orchestrated performance, and the script is what Wall Street calls “fundamental analysis.” It’s a collection of compelling stories, impressive-sounding metrics, and authoritative predictions designed to make you feel intelligent and informed. They’ll tell you about market size, total addressable markets (TAM), competitive moats, and visionary CEOs. It’s a beautiful, coherent narrative. And it is almost entirely useless for the purpose of timing a profitable trade. It’s a rearview mirror, polished to a brilliant shine, giving you a perfect, detailed view of the road that has already been traveled. While you’re admiring that view, you’re hurtling towards a cliff that only the map—the chart—could have shown you.
The “Official Narrative” Wall Street Sells You
But let’s indulge them for a moment. Let’s put on the costume of a fundamental analyst and read the script they’ve prepared for this multi-hundred-billion-dollar blockbuster. The story revolves around three main characters, each with a tale designed to capture your imagination and your capital.
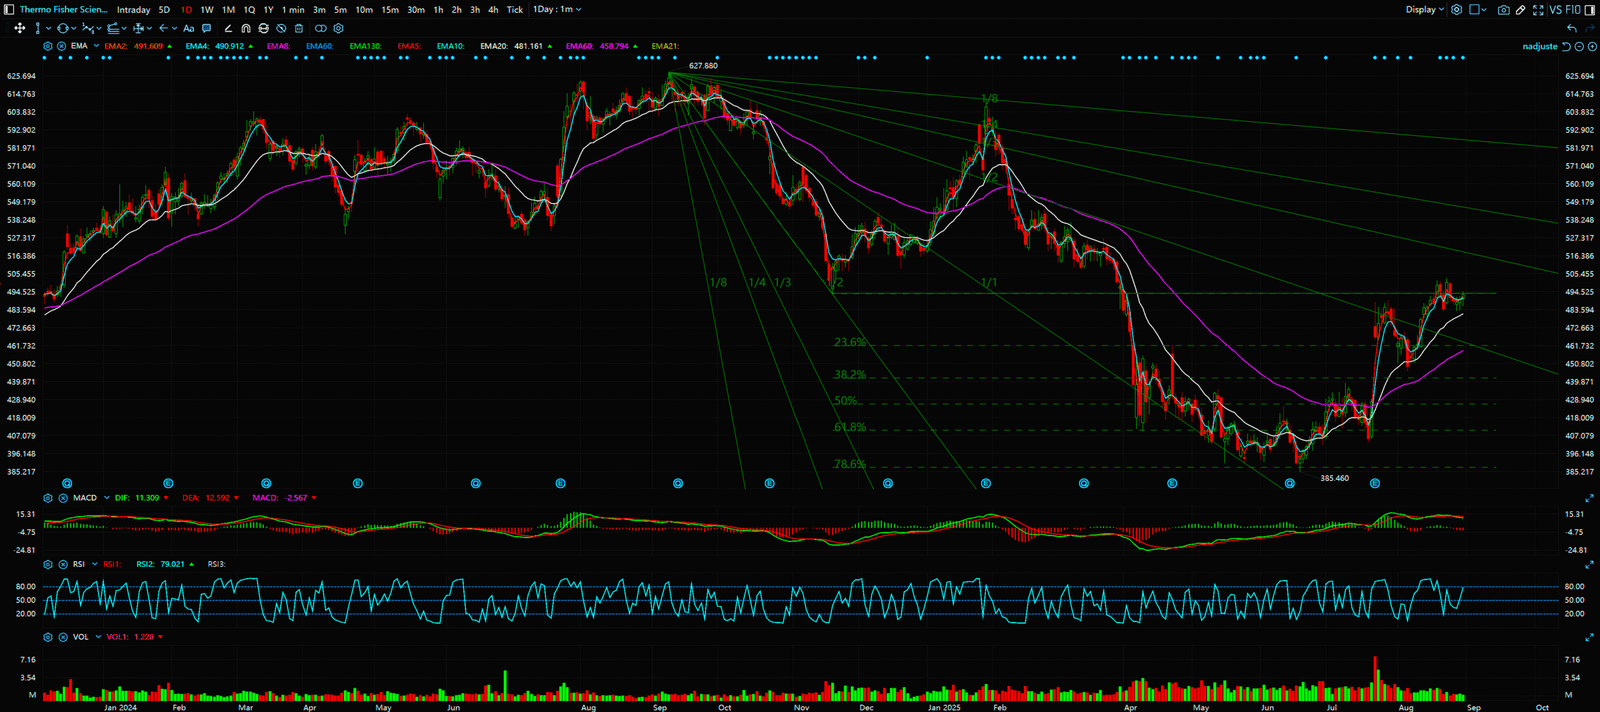
👑 The King: Thermo Fisher Scientific (TMO)
- The Official Narrative (Core Advantage): The script for TMO casts it as the undisputed emperor, the “Amazon.com” of the scientific world. The story is one of absolute dominance through sheer, overwhelming scale. With annual revenues soaring past the $40 billion mark, Thermo Fisher offers a “one-stop-shop” solution that is simply irresistible to its customers. From the most mundane pipette tip to the most dazzlingly complex gene sequencer, they sell it all. This creates a gravitational pull, an “ecosystem” that is almost impossible to escape. Once a lab is built around the Thermo Fisher workflow, the switching costs—in terms of time, money, and retraining—become astronomical. Analysts will coo about this “stickiness.” They will point to a long history of “bolt-on” and transformative acquisitions, like the massive $17.4 billion purchase of PPD, which instantly made TMO a giant in the clinical research services space. The narrative is clear: This is a fortress, an unsinkable aircraft carrier sailing on a sea of predictable, recurring revenue. It’s safe. It’s a blue-chip. It’s a “buy and hold for your grandchildren” stock.
- The Plot Hole (Achilles’ Heel): But the script conveniently leaves out the chapter on the crippling inertia of size. An aircraft carrier may be unsinkable, but it turns with the grace of a tectonic plate. In a world where nimble biotech startups can pioneer revolutionary technologies in a garage, TMO’s gargantuan bureaucracy can be a fatal liability. Its decision-making processes are labyrinthine. Its integration of behemoth acquisitions like PPD is a decade-long saga fraught with cultural clashes and operational friction. The very breadth that is sold as a strength is also a weakness; being a “jack of all trades” means it can be outmaneuvered in niche, high-growth areas by more focused, hungrier competitors. The company is perpetually fighting a war on a thousand fronts, and while the “official story” highlights the victories, the chart often reveals the hidden costs of these campaigns long before they appear as a line item in an earnings report. The King, for all its power, can be slow to react to the assassins creeping up from behind.
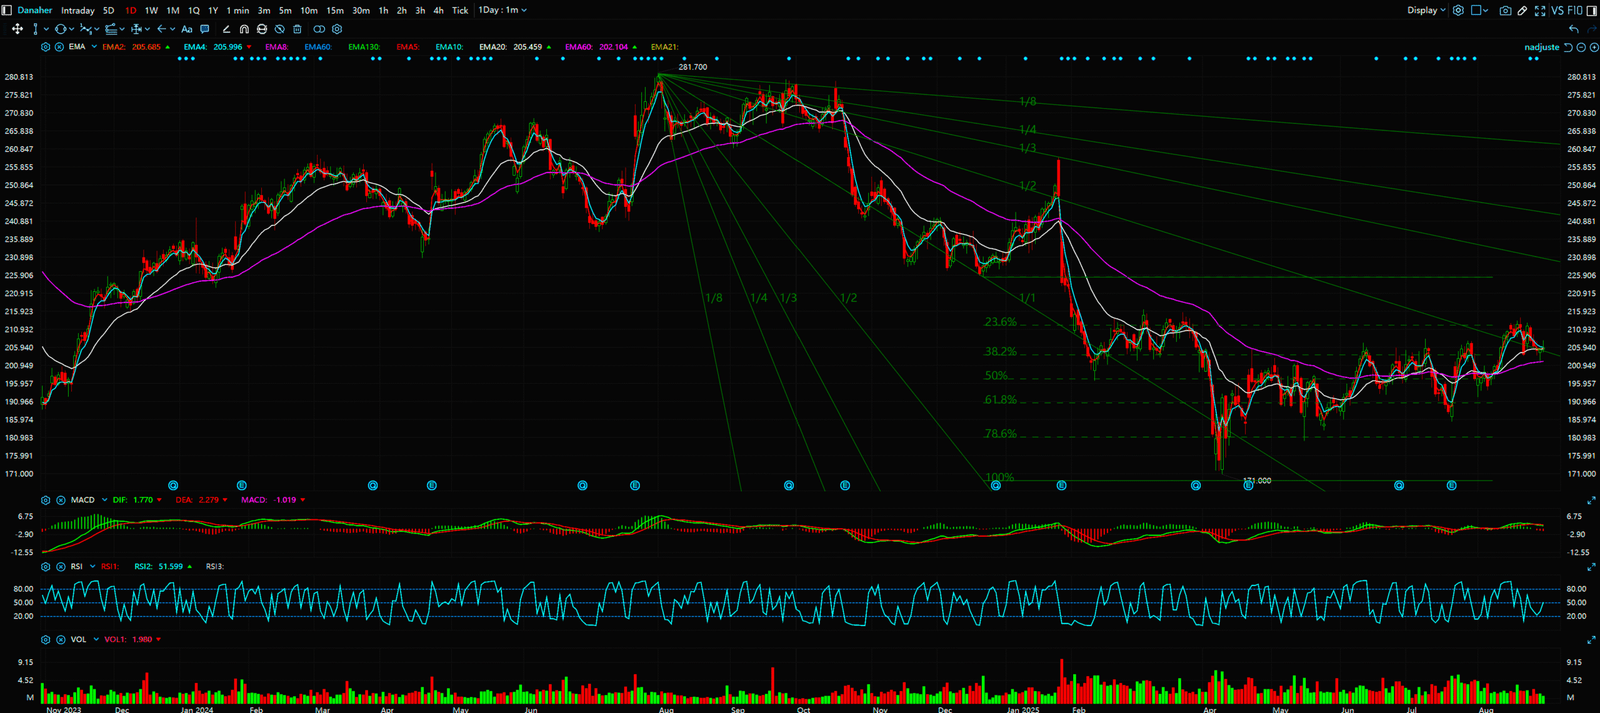
⚔️ The Challenger: Danaher (DHR)
- The Official Narrative (Core Advantage): If TMO is the emperor, DHR is the “Spartan King,” a warrior-company forged in the fires of a relentless, quasi-religious ideology: The Danaher Business System (DBS). Analysts speak of DBS in hushed, reverent tones. It is the secret sauce, the alchemical formula for turning lead into gold. The story of Danaher is a story of perpetual motion and ruthless efficiency. They are not a company; they are a system for acquiring, optimizing, and profiting from other companies. The script is filled with legendary conquests: the acquisition of Pall Corp, a filtration giant; the takeover of Cepheid, a molecular diagnostics leader. In each case, Danaher swooped in, applied the sacred texts of DBS, and miraculously boosted margins and growth. The narrative is intoxicating: this is a company run by the smartest guys in the room, a capital allocation machine that makes no mistakes. They constantly prune their empire, spinning off slower-growth assets like Fortive and Envista, to free up capital for the next high-stakes hunt.
- The Plot Hole (Achilles’ Heel): The glaring flaw in this heroic epic is its complete and utter dependence on the hunt. Danaher is a shark; it must constantly move forward and consume to survive. Its growth is not organic; it is synthetic, fueled by a never-ending stream of acquisitions. This creates a profound, systemic risk. What happens when the M&A pipeline dries up? What happens in a high-interest-rate environment where debt-fueled takeovers become prohibitively expensive? The entire model is predicated on the assumption that there will always be another undervalued, strategically-perfect target to conquer. When that assumption proves false, the growth engine doesn’t just slow down; it seizes up. Furthermore, the company’s identity is intentionally nebulous. Is it a life sciences company? A diagnostics company? An industrial technology firm? This strategic ambiguity, while allowing it to chase opportunities everywhere, can backfire when the market craves clarity. When fear grips the market, investors flee from complexity, and DHR’s “diversified” portfolio can suddenly look like a confusing, incoherent mess.
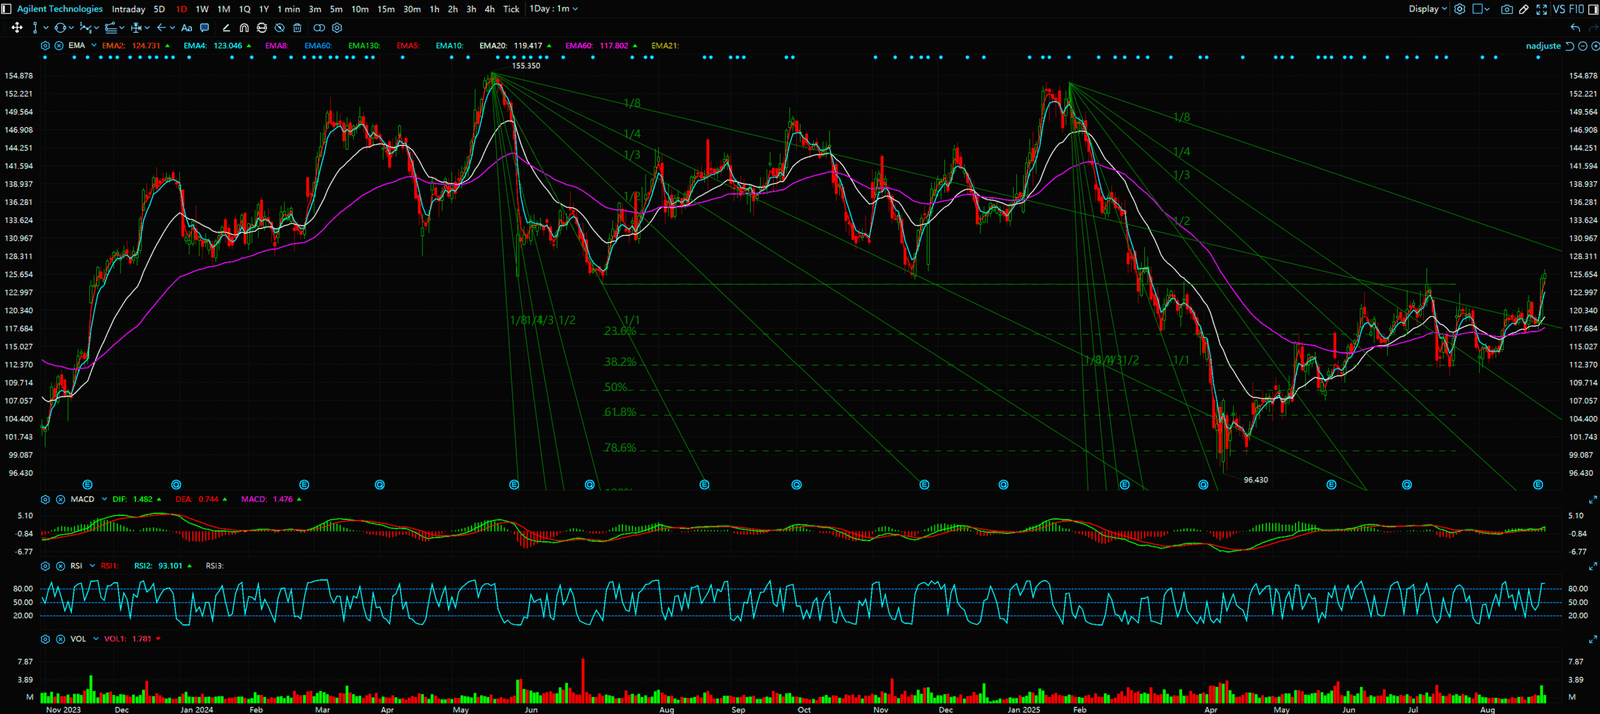
🐘 The Old Giant: Agilent Technologies (A)
- The Official Narrative (Core Advantage): Agilent’s story is one of noble lineage and quiet dignity. Born from the legendary Hewlett-Packard, it carries the DNA of Silicon Valley’s golden age. The script casts Agilent as the “master craftsman,” the trusted elder statesman of the analytical laboratory. In its core domains—liquid chromatography (LC) and mass spectrometry (MS)—its name is the gold standard. Its instruments are the bedrock of quality control and R&D in industries from pharmaceuticals to environmental testing. The narrative here is about trust and reliability. Customers don’t just buy an Agilent machine; they buy into a legacy of precision and support. The “moat” is deep, fortified by decades of patents, proprietary software, and, most importantly, customer loyalty built on the high cost of deviation. Analysts love to point to its stable, high-margin recurring revenue from services and consumables (the “razor/razorblade” model). This, they argue, provides a floor for the stock, a predictable cash flow stream that makes it a “safe harbor” in turbulent times.
- The Plot Hole (Achilles’ Heel): The dark side of “stability” is stagnation. The “master craftsman,” while perfecting his existing art, can be completely oblivious to the artistic revolution happening next door. Compared to Danaher’s predatory aggression and Thermo Fisher’s imperial ambition, Agilent’s strategy often feels passive and dangerously conservative. In the white-hot frontiers of modern biology—single-cell genomics, CRISPR-based tools, spatial biology—Agilent often seems a step behind, content to manage its legacy empire rather than conquer new worlds. The market constantly whispers a nagging question: Is this venerable giant slowly becoming a fossil? Its deep moat protects its castle, but if the surrounding kingdom (its core market) stops growing, that moat becomes a stagnant pond. The “safe harbor” narrative works right up until the moment the tide of innovation goes out for good, leaving the ship permanently beached.
But Does Any of This Actually Matter?
Take a moment. Let all those details, all those carefully crafted stories, wash away. Because when it comes to the raw, brutal, and beautifully simple act of making money in the stock market, they are almost entirely irrelevant noise. They are the rearview mirror.
The fundamental narrative is a tool of persuasion, not prediction. It is the script for a movie that has already been shot. The institutional players—the “smart money”—are the producers and directors. They conducted the casting call months ago, when they saw the early, unproven potential. They financed the production when the stock was trading in obscurity, quietly accumulating their shares from a market that saw no story, no “catalyst.” This accumulation phase is not silent; it screams from the chart for anyone who bothers to look. It appears as unusual volume spikes on up-days, as a stubborn refusal for the price to fall below a certain level, as the slow, grinding formation of a bottoming pattern. These are the footprints. These are the tracks in the mud. This is the evidence.
You, the retail investor, are the moviegoer. You are invited to the premiere only after the film is complete, the reviews are written, and the marketing campaign is in full swing. The “earnings report” and the “analyst upgrade” are the glowing posters and five-star reviews. They are designed to get you excited, to fill you with conviction, to compel you to buy a ticket. But you’re not buying a ticket to a future success; you are buying the ticket from the producers who are now cashing out on their successful project. Your purchase is their exit liquidity. You are the “greater fool.”
Let’s run a simple thought experiment. Let’s say it’s six months ago. You read a dozen reports on the life sciences sector. You are impressed by Agilent’s “defensive characteristics” and “stable recurring revenue.” In a volatile market, it seems like the “smart, conservative” play. You buy the stock, feeling prudent. Meanwhile, a technical trader, who couldn’t tell you the first thing about liquid chromatography, is looking at a chart of Thermo Fisher. He sees a stock that has been in a brutal downtrend for a year, but has recently stopped making new lows. He sees the volume on down-days drying up, a sign of selling exhaustion. Then, he sees a massive spike in volume as the stock breaks above its 50-day moving average. A week later, it successfully retests that average, which now acts as support. He sees the formation of a classic “inverse head and shoulders” pattern, a textbook sign of a major trend reversal. He doesn’t need a story about PPD integration or market share. The chart is the story. He buys TMO.
Fast forward to today. Your “safe” Agilent stock has barely moved, or perhaps even drifted lower, tying up your capital and your mental energy. The TMO position, meanwhile, is up 30%. The fundamental analyst is still trying to explain why TMO went up, writing a new story after the fact. The technical trader doesn’t care why. He only knows that he saw the footprints of the giants, and he followed them. That is the devastating, paradigm-shifting difference between reacting to history and reading the map of the future.


Conclusion: Stop Being the Sheep. Start Being the Hunter.
The market is, and always has been, a battlefield. But it’s not a battle of wits in the way most people think. It is a psychological war designed to facilitate a massive transfer of wealth from the impatient to the patient, from the emotional to the disciplined, from the story-followers to the chart-readers.
You have a choice. You can continue to be a sheep. You can spend your days grazing on the fields of financial news, consuming every article, every analyst report, every forecast. You can let your emotions be governed by the headlines, buying in euphoria and selling in panic. You will live in a state of constant anxiety, your portfolio’s fate dictated by forces you don’t understand. You will be part of the herd, and the herd always gets led to the slaughterhouse.
Or, you can become a hunter. A hunter ignores the cacophony of the jungle. The chirping birds, the rustling leaves—it’s all noise. The hunter looks for one thing and one thing only: tracks. The hunter learns the language of the market’s footprints: the subtle shifts in volume, the classic candlestick patterns, the geometry of trends. The hunter knows that every single piece of fundamental information, every hope, every fear, every secret held by every CEO, is ultimately and inevitably reflected in the raw data of price and volume. The chart is the hunter’s map. It is the only map that matters.
Learning to read this map is not some mystical gift. It is a skill. It is a trade. It is the only trade that can give you a true edge and lead you to financial freedom.
It’s time to burn the storybooks and the rearview mirrors. It’s time to stop being the audience and start being the hunter. Visit our website. Learn to read the map. The hunt is on.
Sources:
- Grand View Research, “Life Science Tools Market Size, Share & Trends Analysis Report,” 2023.
- Thermo Fisher Scientific Inc. (TMO) 2023 Annual Report.
- Danaher Corporation (DHR) 2023 Annual Report.
- Agilent Technologies, Inc. (A) 2023 Annual Report.
Unlocking Technical Analysis: Power Moves with Diagrams
Daily Timeframe (TMO)
Daily Timeframe (DHR)
Daily Timeframe (A)