What’s up, degens and future crypto millionaires!
Tired of staring at charts, getting rekt, and missing every single moonshot? Are you watching price action that looks more like your heart rate during a rug pull?
Today, your resident trading guru is here to drop some serious alpha. I’m talking about a killer combo using two “boomer” indicators, MACD and RSI, that’s so simple it’s almost embarrassing, yet so effective it feels like a crime. Don’t believe me? This exact setup was the golden ticket to catching that insane 77% Bitcoin rally at the end of 2024.
Your Loadout: The Gear You Need
- MACD (Moving Average Convergence Divergence): Just use the default settings (12, 26, 9). Think of this as your trend-o-meter.
- RSI (Relative Strength Index): Crank this baby up to a hyper-sensitive setting of (2). This is your “oversold” alarm bell.
This strategy slaps on the daily chart, but if you’re an impatient scalper, it works just as well on the 1-minute, 5-minute, or 30-minute charts.
The 3-Step Playbook to Ape In Like a Pro
Step 1: Spot the Bottom – The MACD Bullish Divergence
First, you need to hunt for a “Bullish Divergence” on your chart like a hawk.
- In Plain English: The price is making new lows, but the corresponding lows on the MACD indicator are getting higher.
- What It’s Really Saying: “Yo! While the paper hands are panic selling, the whales are secretly loading their bags.” The downtrend is running out of steam, and a bottom is forming. But listen up, this is just a yellow light. Don’t YOLO in just yet.
Step 2: Wait for the Green Light – MACD Lines Cross Above Zero
This is the secret sauce. The absolute game-changer. After you spot the divergence, you need to have the patience of a monk and wait for both the MACD line (the fast one) and the Signal line (the slow one) to blast off above the zero line.
- In Plain English: Both lines move from negative territory (underwater) into positive territory (above water).
- What It’s Really Saying: “It’s on! The bulls have officially taken control of the cockpit.” The trend has flipped, and we are clear for takeoff.
Step 3: Snipe the Entry – RSI(2) Dips Below 20 is Your Go-Time!
Once the MACD lines are chilling above zero, the price will almost always do a little pullback to shake out the weak hands. This is the golden pocket we’re waiting for.
- In Plain English: After the MACD lines confirm the uptrend, wait for a price dip that dunks your hyper-sensitive RSI(2) indicator below the 20 level.
- What It’s Really Saying: “BEST BUY POINT ALERT!” This is your high-probability, low-risk entry. It’s like getting a Black Friday discount on a 100x coin. Stop thinking, start scaling into your position. Let’s ride.
Case Study: Nailing the 77% Bitcoin Pump
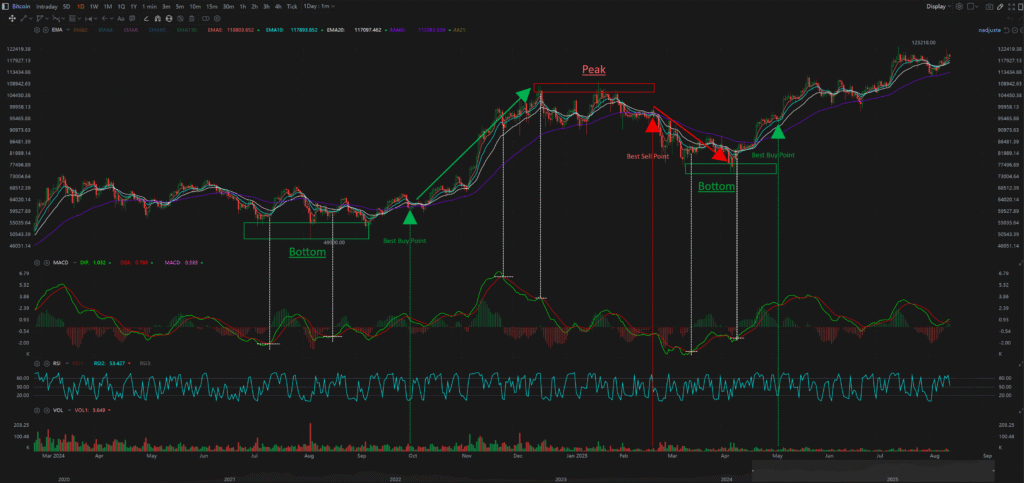
Check the chart. At the end of September 2024, Bitcoin was in the gutter, but the MACD was screaming “Bullish Divergence” (Step 1 ✅).
Then, in early October, the MACD lines finally shot above the zero line (Step 2 ✅).
And the final piece of the puzzle: on October 2nd, the price pulled back, and the RSI(2) took a nosedive below 20. Bingo! That was your Best Buy Point (Step 3 ✅). Sure, the price dipped slightly below the entry a few days later (that’s called a “stop hunt,” designed to scare you), but it quickly reversed and kicked off a face-melting rally, pumping around 77% in just over two months.
See? Stupidly simple, ridiculously effective.
Friendly Reminder (A.K.A. Don’t Get Rekt)
No strategy is a holy grail that prints money 100% of the time. This play is about stacking the odds heavily in your favor. Always set a stop-loss, manage your risk, and for the love of God, don’t degen your entire bag into one trade. Trade smart.
