Hey future market wizards! Tired of staring at charts all day but still want to stack cash like the pros? Let’s cut the crap. Today, I’m giving you a secret weapon that Wall Street elites use daily but won’t broadcast—the Fibonacci Retracement. This isn’t just another indicator; it’s a cheat code designed for smart people like us who want maximum returns with minimum effort in the shortest time possible.
【Why Are These Numbers So Magical? 】
Forget the complex math. All you need to know is this: nature and markets move in a “golden ratio.” Think about it—an artist uses the golden ratio to make a painting look perfect. It’s hardwired into our brains to find it appealing. The same logic applies to trading. When a hot stock or crypto coin pumps hard and then pulls back, traders are psychologically wired to see a certain level as the “sweet spot” to buy back in. That sweet spot is the 61.8% level.
【The Playbook: Your 3-Step Guide to Easy Money】
Alright, let’s get straight to the action. Here’s how you use this powerful hack:
- Find a “Superstar” Asset: First, you need to be watching a stock or crypto that everyone is talking about—something with insane trading volume (think Tesla, Nvidia, Bitcoin, Ethereum). High volume means high interest, and high interest means more traders are watching for the exact same signals. This is what makes the Fib tool so powerful.
- Draw the “Magic Line”: Once the asset has had a massive run-up, grab the Fibonacci Retracement tool on your charting platform. Draw a line from the very bottom of the recent rally (the swing low) to the absolute top (the swing high).
- Hunt the “Golden Pocket”: After you draw the line, you’ll see several retracement levels. The two you need to obsess over are the 50% and 61.8% levels. This area is known as the “Golden Pocket.”
- When the price drops to the 50% level, get your cash ready. It’s game time.
- If it continues down to the 61.8% level, or even dips slightly below it, don’t panic. This isn’t a crash; it’s a discount. This is the sweet spot where big money players are waiting to pounce. When you see the price hit this zone, don’t overthink it. Just pull the trigger and buy.
【No BS, Just Hard Proof】
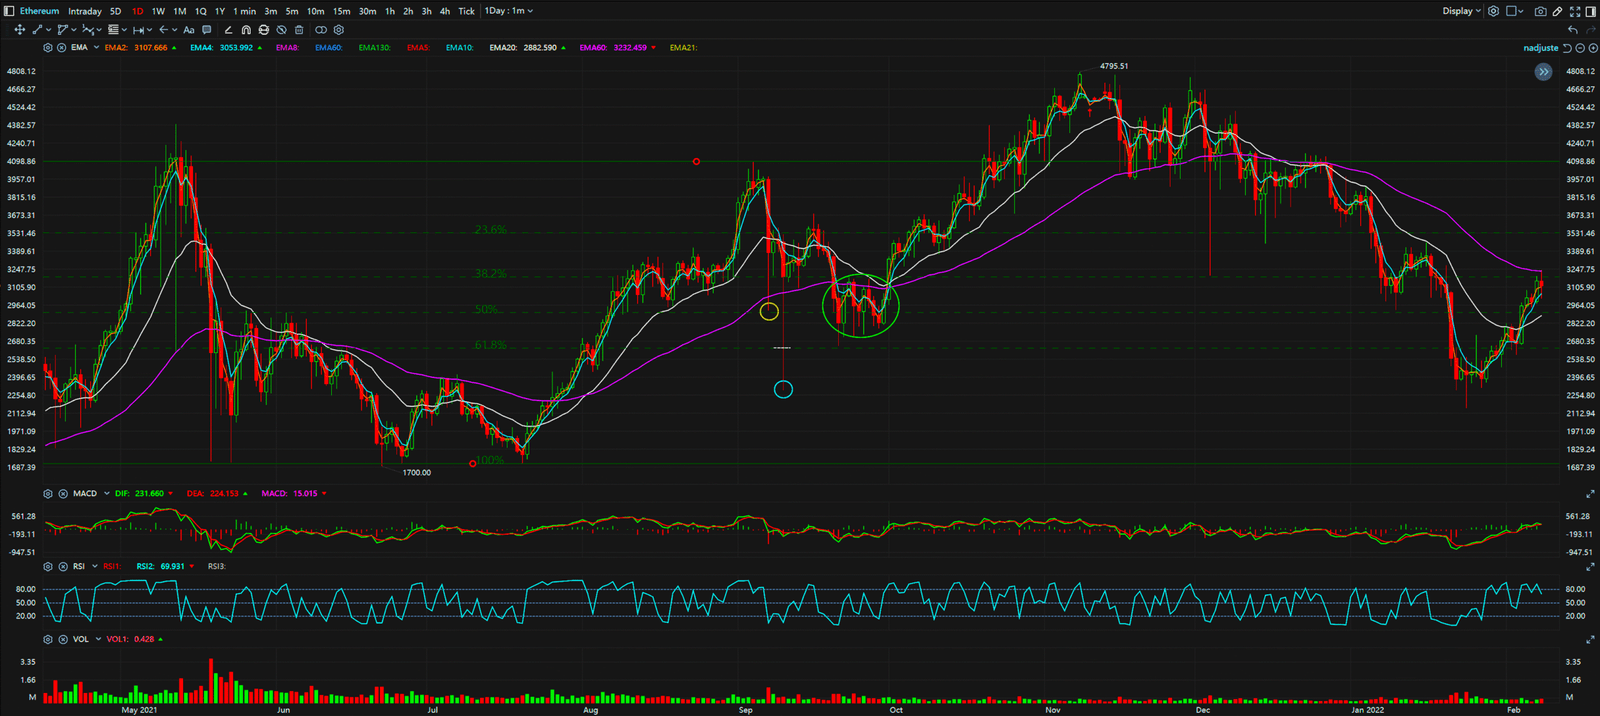
Look at the Ethereum (ETH) chart from 2021. It’s a perfect showcase of this hack in action:
- Yellow Circle Example: On September 7, 2021, ETH nose-dived from its high and tagged $2,925 (right in the 61.8% Golden Pocket). The result? It rocketed to $3,547 the very next day. That’s a massive 21% gain in just 2 days!
- Blue Circle Example: A few days later, on September 10, ETH did it again, hitting $2,298—another prime entry in the golden ratio zone. If you had the guts to buy in, you would have ridden it all the way up to $3,677 six days later, cashing in on a staggering 60% rally!
This strategy doesn’t require you to read boring financial reports or listen to talking heads on TV. It just requires you to have the courage to buy when others are fearful, trusting the proven magic of the Golden Ratio. This is, hands down, the simplest, most stress-free way to lock in serious profits in a short amount of time. Want to be a winner in this game? You need to know the cheat codes.
