To make a success you must have knowledge and know how to apply it
William Delbert Gann – 1949
Listen up, you kids dreaming of flipping stocks for a Lambo. If you still think reading the news and listening to suits on Bloomberg talking about “AI is the Future” is going to set you free, you are destined to be a Sheep forever. Today, I’m going to break your brain and pull you out of the Matrix. Nvidia (NVDA) isn’t a stock; it’s the biggest IQ test in modern financial history. While the world worships Jensen Huang like a god, the real hunters are sharpening their knives to carve up this fat cow right at the top. This analysis is based on data as of this Saturday, January 17, 2026, 11:30 AM ET. We are using the freshest, hottest market data available. By the time you read this, the Wall Street whales might be preparing to dump their bags, and if you don’t wake up now, you’ll be left eating their crumbs. Mark this timestamp, because this could be the watershed moment for your wealth.
Chapter 1: The Official Script — The “Digital Drugs” Wall Street Feeds You
Fine. Since you guys love pretending to be “rational” and obsessed with Fundamentals, let’s play that game. Let’s taste the “Official Feed” Wall Street serves the masses. This data is a placebo to soothe your anxiety and make you feel like you’ve “done your homework.”
1. The Macro “AI Arms Race” The start of 2026 looks different. AI isn’t just ChatGPT writing love letters anymore; it has become a Sovereign AI Arms Race.
- Sovereign AI Rises: Every nation, from Middle Eastern oil states to European powers, refuses to hand their data sovereignty to US tech giants. They are building Data Centers like crazy. Saudi Arabia, UAE, France, Japan—everyone is buying. Nvidia’s H200 and B100 (Blackwell) chips have become the new oil.
- Energy Crisis & Compute Hunger: The biggest Macro theme of 2026 is “Energy.” AI Data Centers are devouring electricity, sending Nuclear Energy stocks to the moon. Wall Street tells you: “Nvidia’s new architecture is X times more efficient, so it’s the savior of the energy crisis!”
- The Application Layer: After the trial and error of 2024-2025, AI Agents are finally deploying at scale in enterprises. From coding to surgery, AI is everywhere. This is Wall Street’s favorite story: “Unlimited Demand.”
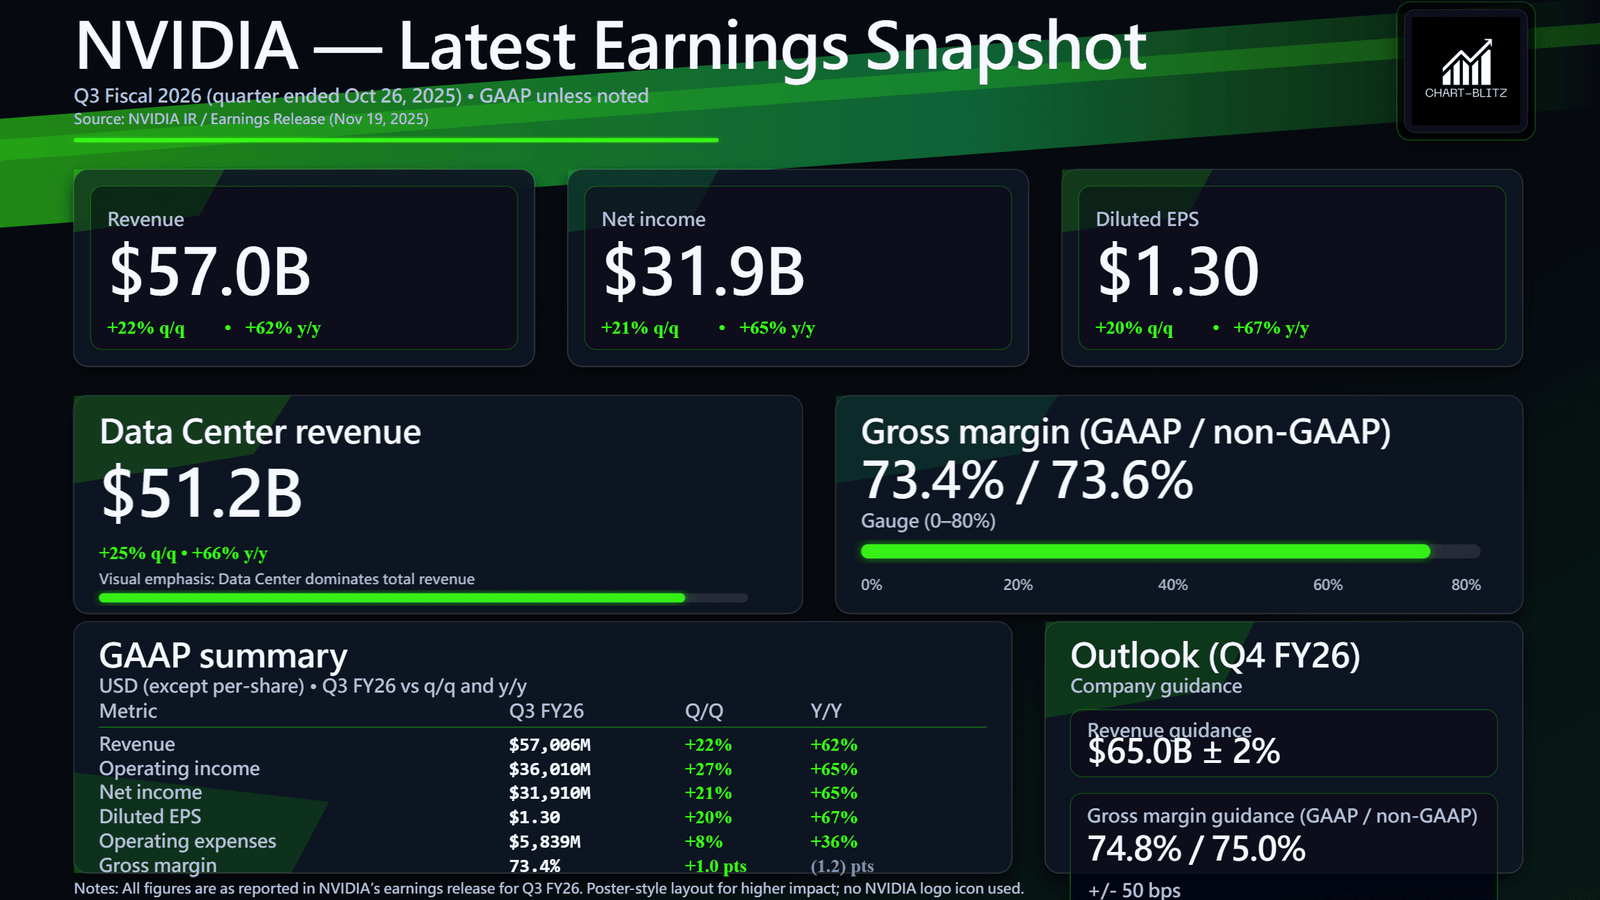
2. The “Monster Data” in Earnings Look at Nvidia’s fresh Q3 FY2026 Earnings Snapshot. If you have a weak heart, sit down.
- Revenue: $57.0 Billion USD. Up 62% YoY, Up 22% QoQ.
- Net Income: $31.9 Billion.
- EPS: $1.30. Up 67% YoY.
- Gross Margin: 73.4% (GAAP). This is basically printing money.
- Data Center Revenue: $51.2 Billion. Dominating the total revenue. This means Nvidia has basically become a pure “Infrastructure Company.”
- Guidance: Q4 FY2026 expected Revenue $65.0B ± 2%.
If you’re a traditional value investor, you see these numbers and get an instant dopamine hit. Analysts will write 500-page reports telling you how deep Nvidia’s Moat is and how invincible the CUDA ecosystem is. They’ll tell you that even with the price up so much, the PE ratio is still “reasonable” because growth is so fast! They call it a “Generational Opportunity.”
3. The “Deification” of Industry Status In the Official Script, Nvidia is no longer a company; it is “The Operating System of the AI Age.” Google, Microsoft, Meta, Amazon—everyone pays the “Jensen Tax.” Media tells you: “As long as AI grows, Nvidia wins.” They tell you to “Buy the Dip” and “Never Bet Against Jensen.”But… If you believe all that, congratulations, you are a certified Premium Sheep 🐑. You think you’re analyzing a company? Wrong! You are inhaling the “Emotional Opium” Wall Street carefully mixed for you! The biggest problem with Fundamental Analysis is that “it tells you what happened in the past, but it won’t tell you where the price is going tomorrow.” $57B Revenue? Awesome! But what if the market priced in $60B? What if that 73.4% Gross Margin is the Peak Margin? What if whales are starting to price in “Growth Deceleration”? Price Action ALWAYS leads Fundamentals. When you see the beautiful earnings and rush to buy, the real Smart Money is likely the one selling to you! Young bloods, your youth is precious. You don’t have time to date a company, and you certainly don’t have time to be the “Bag Holder” for whales. You need Efficiency. You need Precision.
Chapter 2: The Awakening — Tear Up the Script, The Chart is God
But here’s how smart money actually thinks…
Shut up. Stop. Close the news. Close every news tab on your screen. Open your TradingView. Charts don’t lie. Charts are the footprints of trillions of dollars of real money. Every candle, every line is crystallized greed and fear. Fundamentals can be faked, CEOs can lie, but Price Action is absolutely honest.
Why do we trust Technical Analysis (TA)? Because of Capital Efficiency. If you trust fundamentals and buy Nvidia, you might buy at $140, watch it drop to $100, panic sell, and then watch it rip to $180. You get played. If you trust TA, you know where the “Resistance” is and where the “Support” is. You know when to be greedy and when to be fearful. Time Cost = Opportunity Cost. For us Gen-Z speculators, small capital isn’t the problem. The problem is locking capital in high-priced “dead money.” We want the Sniper Shot—one shot, one kill, take the money and run.
Now, switch modes. Put on your tactical goggles. We are entering 【The Cold-Blooded Sniper】 mode. Here is Nvidia’s Alpha Map. Follow it. Don’t ask why.

Chapter 3: Trading Floor Decoded (Technical Analysis Core)
1. Monthly Chart: The Ceiling of Gods
Monthly Chart – (NVDA) NVIDIA
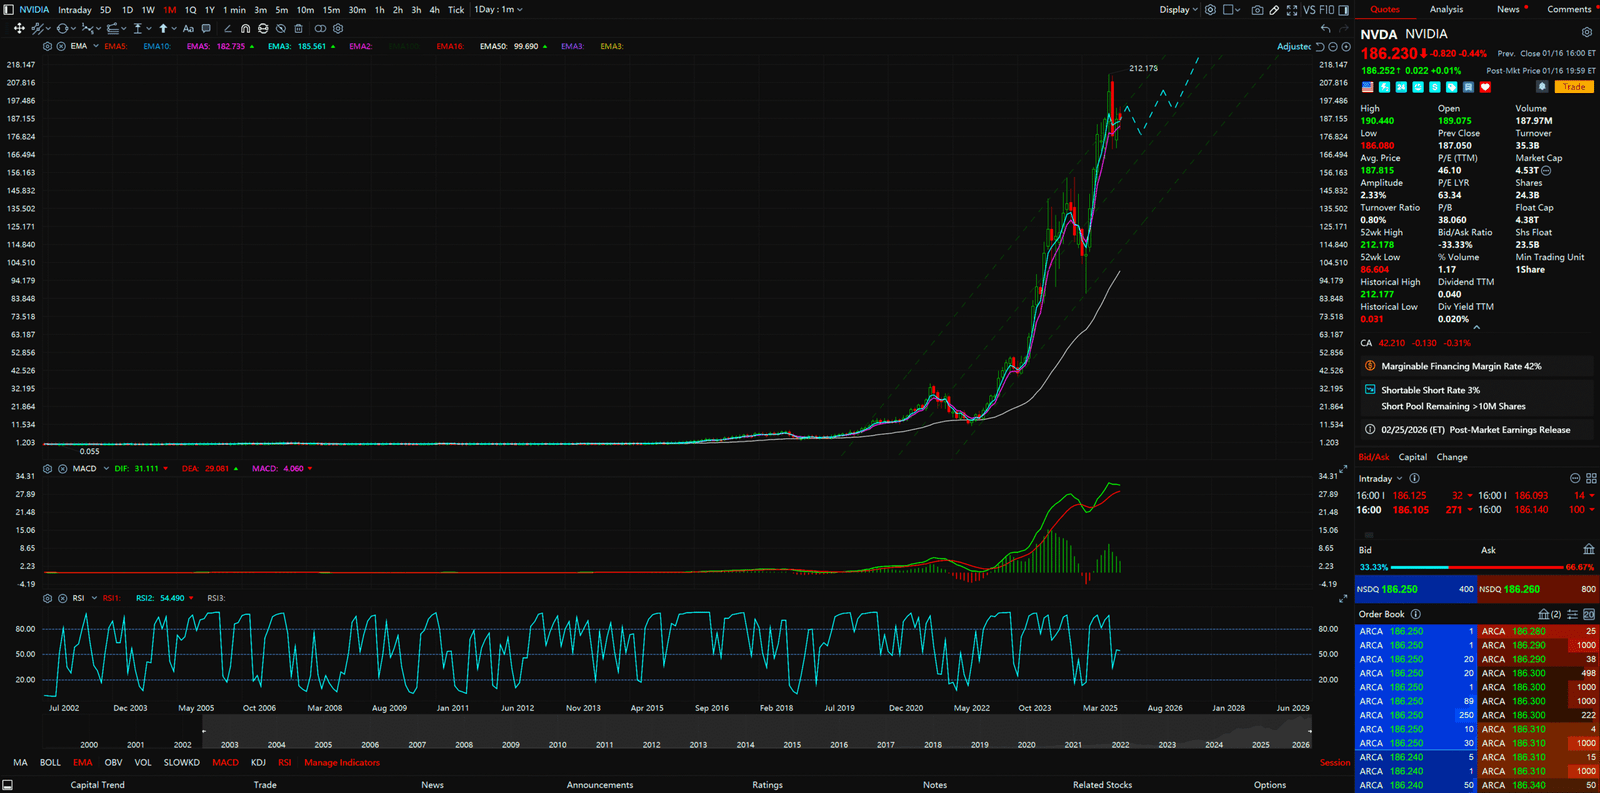
【Focus】: Ascending Channel Top
Look at the Monthly Chart. Don’t blink. You see Nvidia skyrocketing like a rocket over the last few years, from double digits to $186 now. Many say: “The sky is the limit!” Wrong. The Channel Top is the limit.
- Sniper Logic: In a Macro Cycle, price always moves within an Ascending Parallel Channel. When price touches the Upper Boundary, no matter how good the fundamentals, no matter how strong the earnings, Gravity kicks in.
- Status Decode: The chart clearly shows Nvidia’s price is currently right at the Very Top of this Monthly Ascending Channel.
- Alpha Signal: This is an extremely dangerous signal. It means the Risk/Reward Ratio is terrible. The Upside is limited, but the Downside potential is huge.
- Conclusion: There is obviously a relatively high chance of a pullback. Smart Money won’t chase here; they start to Take Profit.
- The Pill: However, based on the fact that the overall uptrend structure hasn’t been broken (Higher Lows are intact), even if it pulls back, it won’t crash too much. This isn’t a Crash; this is healthy Mean Reversion. Don’t try to Short it to zero; you will get wrecked
2. Weekly Chart: Poseidon’s Pitchfork
Weekly Chart – (NVDA) NVIDIA
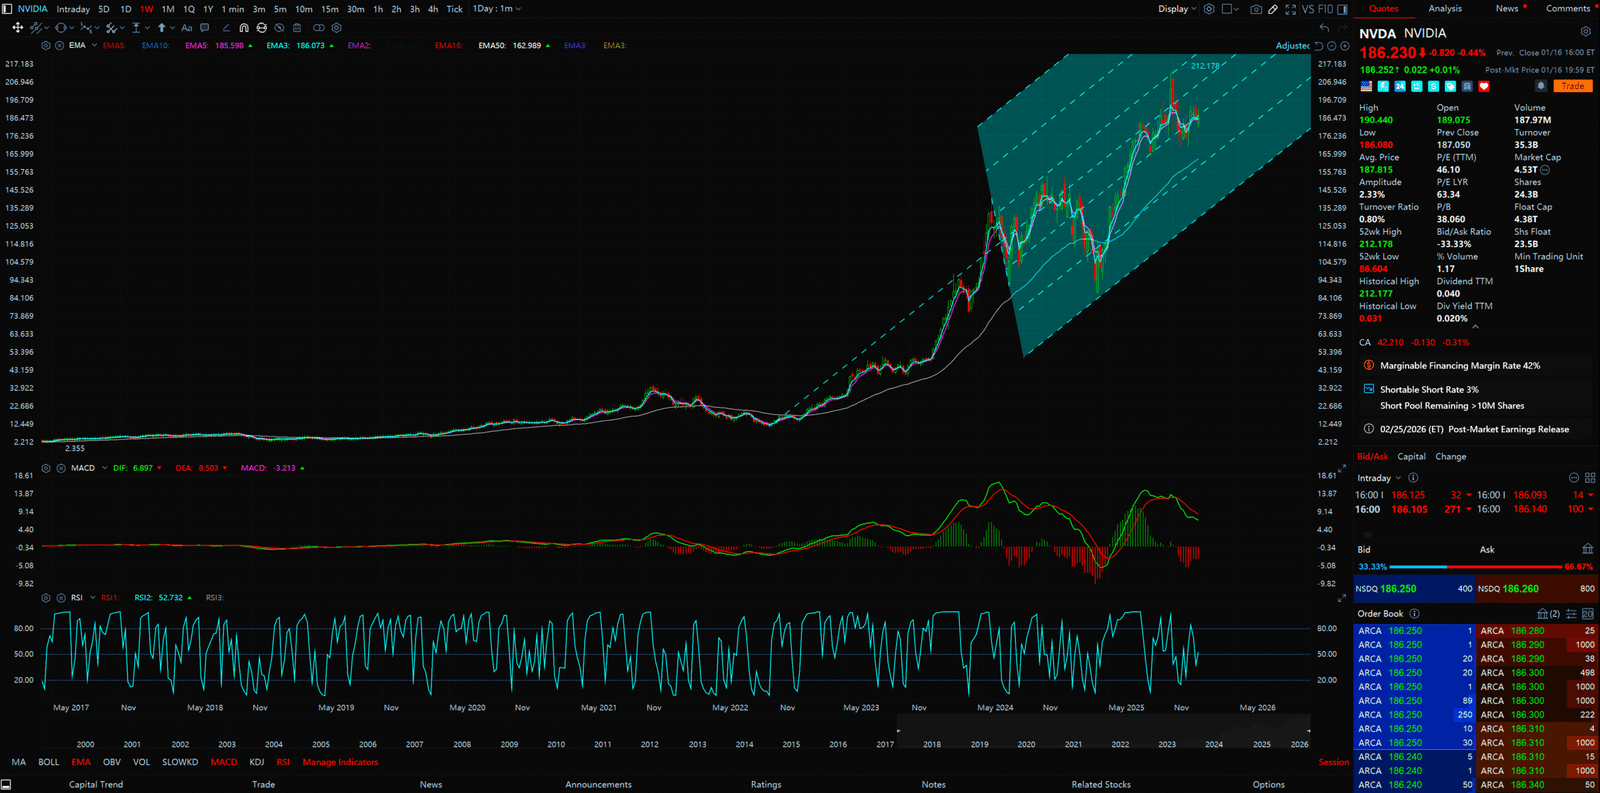
【Focus】: Pitchfork Median Line & 1.618 Extension
Switch to Weekly. If Monthly is too slow, Weekly tells you the next few months. Look at that upward channel. We have drawn a standard Andrew’s Pitchfork.
- Sniper Logic: Pitchfork is a god-tier tool for trend capturing. The Median Line is a magnet; the outer lines are electric fences.
- Status Decode: Nvidia’s price is currently rising along the Pitchfork and is positioned at the Middle of the Pitchfork indicator (near the Median Line).
- Alpha Signal: Being in the middle usually signifies Indecision and Volatility. Bulls and Bears are wrestling here.
- Predicted Path: We can be certain that there will be volatility in the short term. Based on the Monthly top pressure, we expect a sudden, slight drop in the short term.
- Target: Drop to where? To the next important Pitchfork support point. Specifically, the lower position of the 1.618 Extension. That spot is a “Sweet Spot,” where previous Resistance turns into Support. If it drops there, that’s your chance to reload
3. Daily Chart: The Trader’s Discipline
Daily Chart – (NVDA) NVIDIA
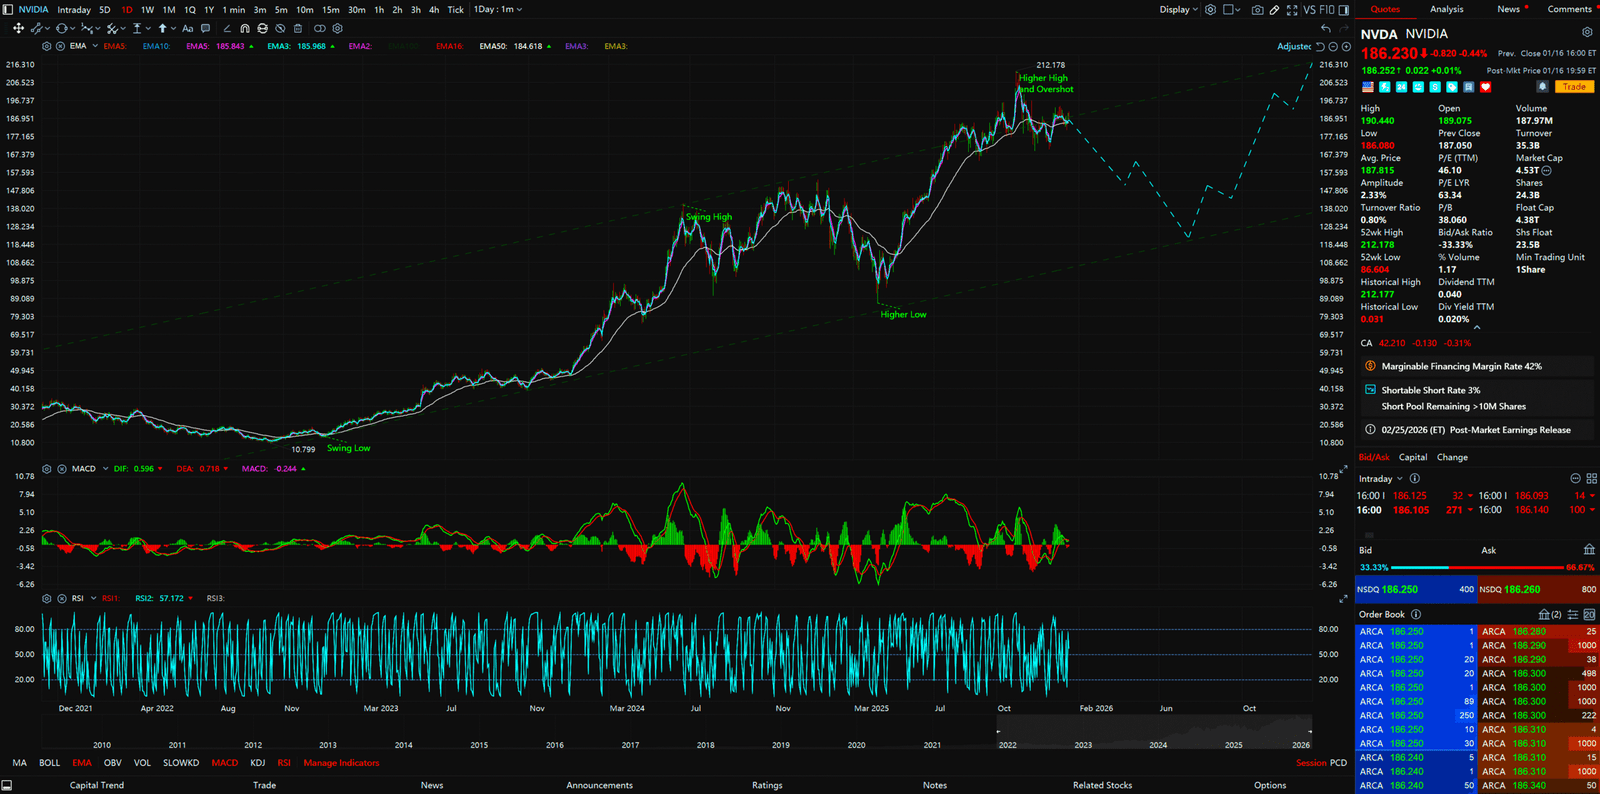
【Focus】: Market Structure (HH/HL) & Overshot
Finally, the Daily Chart. This decides if you click “Buy” today.
- Pattern Analysis: Classic Dow Theory uptrend. Higher Highs (HH), Higher Lows (HL). This is the definition of a Bull Market.
- Status Decode: Notice the chart. Nvidia’s short-term trend has risen to the position of the 1st Higher High.
- Critical Warning: At the same time, we see a clear Overshot situation. The price has punched through the upper rail of the short-term channel, and RSI is likely screaming Overbought.
- Tactical Execution: It is reasonable to expect that Nvidia’s share price may have a short-term, slight pullback. It’s like sprinting a marathon too fast; you need to stop and drink some water.
- Action Plan: Do NOT rush in to catch the falling knife or chase the pump now! If you hold positions, consider locking in some profits at this Overshot level. If you are flat, Patience!
- Conclusion: As long as the uptrend structure is not destroyed (i.e., not breaking below the previous Higher Low), we can still be bullish after the pullback. Wait for the pullback to end, look for a reversal signal (like a Pin Bar or Engulfing), then enter.
Chapter 4: Conclusion
What is the conclusion? Nvidia is King, but even Kings need to sleep.
- Monthly: At the Channel Top. Altitude sickness risk is high. Pullback likely.
- Weekly: Oscillating at Pitchfork Median. Target points to lower support (1.618).
- Daily: Overshot and Overbought. Short-term pullback imminent.
Stop being blinded by “AI Faith.” If you are a long-term investor, do NOT All-in here. WAIT! Wait for the market to give you a better price. If you are a short-term Speculator, now is the time to Take Profit or Wait for the Dip. Stare at the chart. When the Daily chart pulls back to support and the structure holds, PULL THE TRIGGER. This is Speculation. This is Alpha. Don’t be a Sheep. Be a Navigator. Welcome to the Awakening.
【Disclaimer】 The content herein is for educational purposes and reflects the author’s personal opinion only; it is not investment advice. All financial investments, including cryptocurrencies and stocks, carry significant risk, and you could lose your entire capital. To support this site, this article may contain affiliate links. While we strive for accuracy, we cannot guarantee all information is complete or error-free. Please conduct your own research and be fully responsible for your own investment decisions
Source:

