The speculator’s chief enemies are always boring from within. It is inseparable from human nature to hope and to fear
William Delbert Gann – 1949
【Are You the Hunter or the Prey?】 It’s December 26, 2025. Bitcoin is sitting at $88,733. If you are a retail trader scrolling through charts on your phone, you probably see a “Bullish Divergence” on the Daily MACD. Your gut—and maybe Crypto Twitter—is telling you: “This is it. The dip is over. Time to load up before $100k.”
Stop. As someone who spent 20 years on institutional trading desks, watching how “Smart Money” systematically extracts capital from “Dumb Money,” I have a harsh reality check for you: What you see as a buying opportunity is likely a carefully constructed “Liquidity Trap.” Today, I’m not going to give you the usual generic advice. I’m going to use Chart Blitz’s proprietary framework to deconstruct the kill zone hidden in these charts.
【Analysis Benchmark Statement】
All technical analysis below is based on the price snapshot locked on December 26, 2025: BTC = 88,733.24 USD. This snapshot provides a stable reference point. All support, resistance, and projected paths are relative to this baseline. Markets are volatile; please treat this report as a “tactical map,” not a real-time quote.
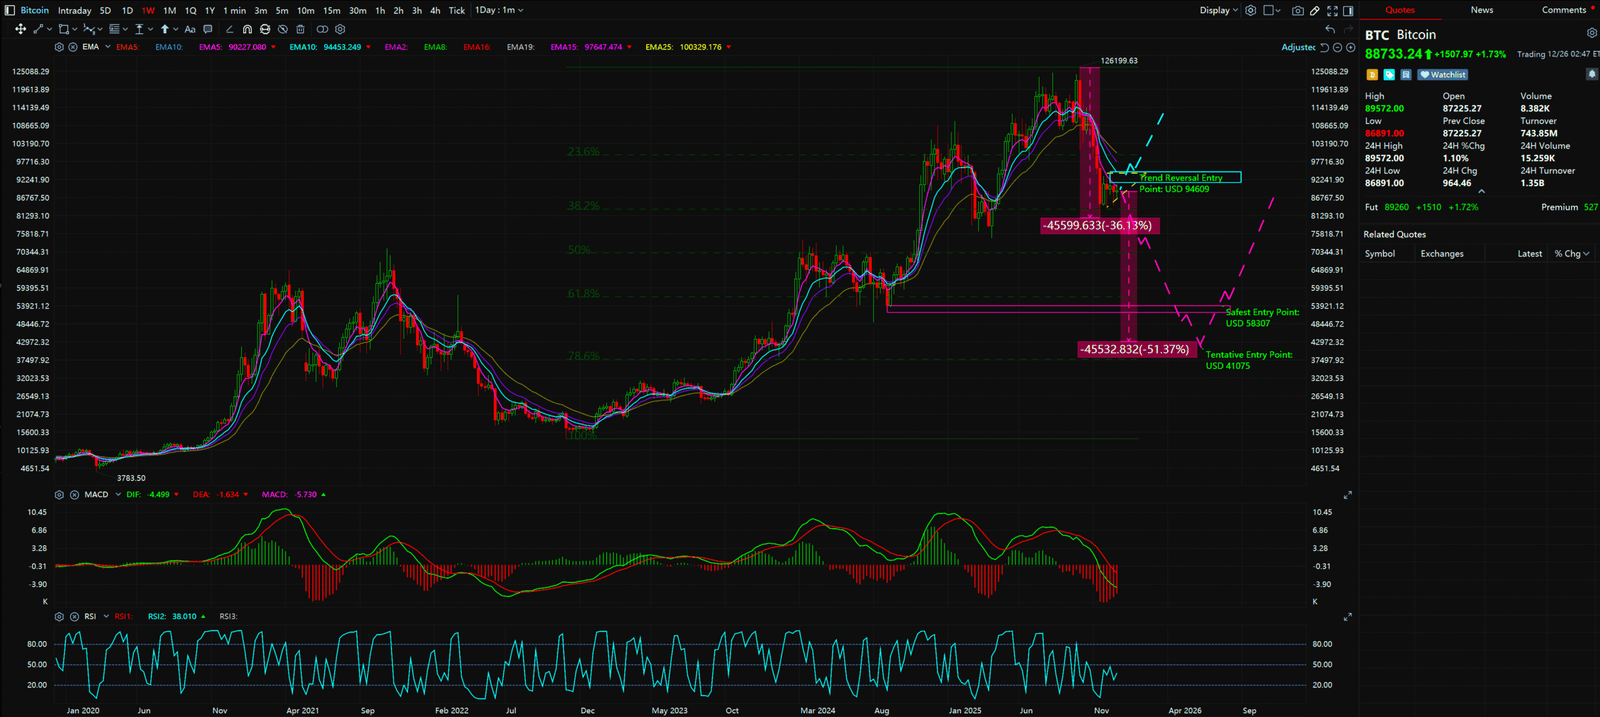
Chapter 1: The Weekly Chart Truth — The “Horizontal Triangle” of Death
Most Gen Z traders are addicted to the 15-minute or 1-hour timeframes. You want the dopamine hit of quick action. Institutions do not care about your 15-minute chart. They trade the Weekly.
Zoom out to the Weekly Chart provided. What do you see?
- Structural Decay: Lower Highs and Lower Lows. In Dow Theory, this is the definition of a Downtrend. Period.
- The Fatal Pattern: We are seeing a textbook “Horizontal Triangle.”
The Banker’s Note: In the institutional playbook (Elliott Wave Principle), this specific triangle pattern almost only appears in a Corrective Wave b. Why does this matter? It means the current stability isn’t a base for a moonshot. It is a pause to accumulate energy for a devastating Wave c crash. If the support breaks, projecting a 1:1 drop (Wave c = Wave a), the algorithmic target for BTC is USD 41,075. Ask yourself: If you go All-in at $88k and it hits $41k, is your portfolio wiped out?
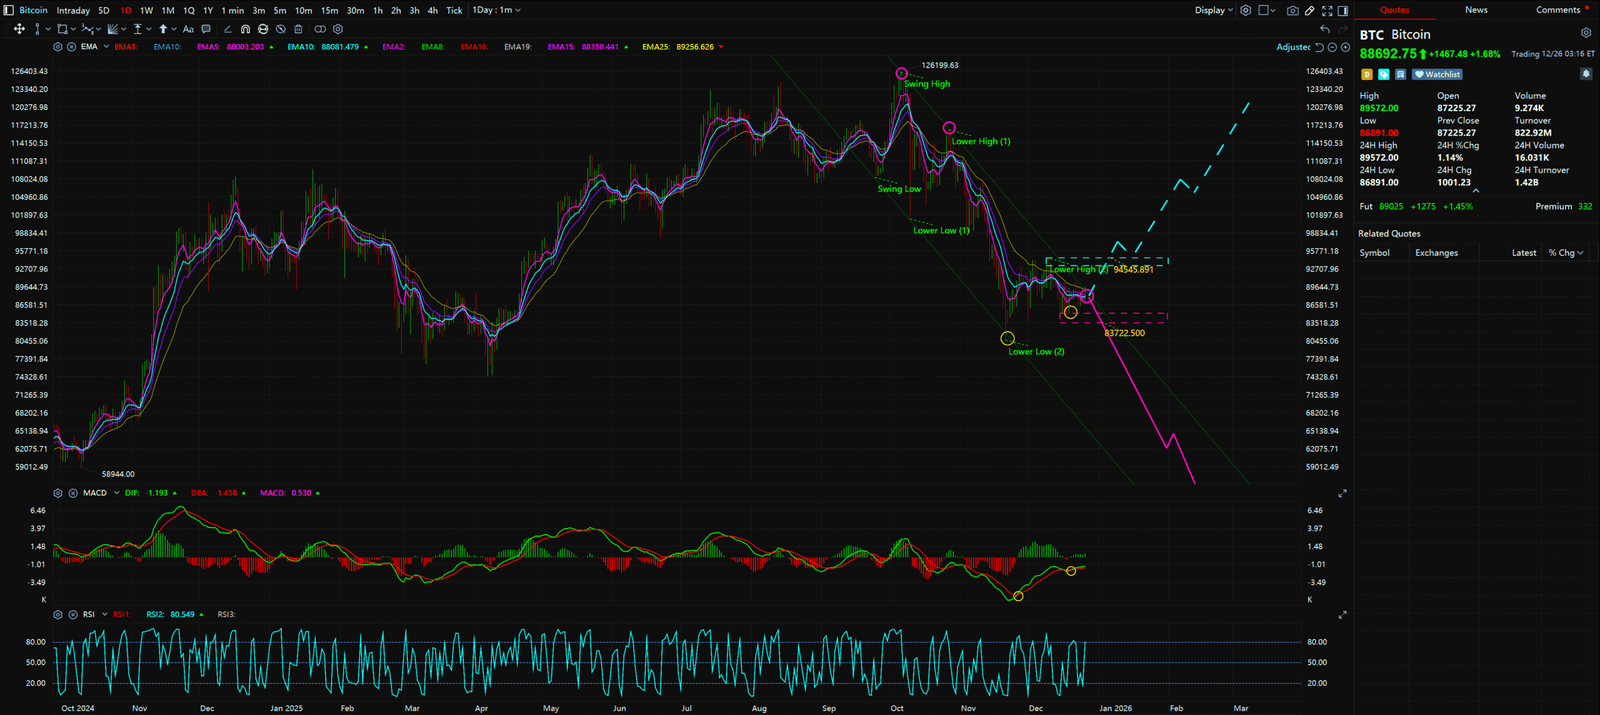
Chapter 2: The Daily Chart’s “Honey Trap” — The MACD Divergence
“But the Daily MACD shows divergence! The books say buy!” This is exactly how liquidity is engineered.
Why is this Divergence a Lie?
- Trend Trumps Indicator: There is a golden rule in professional trading: “Oscillators must submit to Structure.” When the Weekly structure (the boss) is bearish, a Daily divergence (the employee) is usually just a pause in the selling, not a reversal.
- The “Sucker’s Rally”: Whales need to sell large positions. They can’t just dump it all at once or price would collapse too fast. They need buyers. By allowing price to stall and indicators to diverge, they lure in “technical retail traders” to buy. You are providing the exit liquidity for their shorts.
- Channel Prison: Look at the Daily chart. BTC is locked inside a “Descending Parallel Channel.” Until the upper wall of that channel is breached, every rally is a Dead Cat Bounce.
Chapter 3: Trading Psychology — Mastering the Art of Doing Nothing
I know you have FOMO. I know you want to retire by 30. But in this game, preserving capital is more important than chasing profit. The market is currently in a “1-to-1” standoff:
- Bull Case: Daily MACD Divergence.
- Bear Case: Weekly Horizontal Triangle + Downtrend.
In this confusion, the Professional stays in Cash. We are not gamblers; we are snipers. We wait for the target to walk into the crosshairs.
Chapter 4: The Ex-Banker’s Playbook — The Only 3 Levels That Matter
Don’t guess. Wait for confirmation. Here are the exact coordinates derived from the charts:
- Scenario A: The Breakout (The Only Buy Signal)
- Trigger: BTC must decisively break and close above USD 94,545.89.
- Meaning: The bearish channel is destroyed. The triangle is invalidated.
- Action: Enter on the retest. Target $100k+.
- Scenario B: The Breakdown (Stop Loss / Short)
- Trigger: BTC drops below USD 83,722.5.
- Meaning: The Triangle breakdown is confirmed. Wave c crash begins.
- Action: If you are holding, get out. If you trade derivatives, this is a Short signal.
- Scenario C: The Wealth Transfer (The Bottom)
- Trigger: Price hits USD 41,075.
- Meaning: This is the mathematical bottom of Wave c. This is where institutions re-enter.
- Action: This is the generational buying opportunity. Deploy 30-50% of capital here.


Key Takeaways
Summary / Key Levels Tactical Manual
- ⛔ Stop Loss: USD 83,722.50
- This is the last line of defense. If it breaks, the trend has completely reversed, and you must exit unconditionally to survive.
- 🎯 Tentative Entry Point: USD 41,075
- Action Guide: This is the “Golden Point” for Extreme Target (Wave c Bottom). When price touches here, AND the MACD indicator shows “Bullish Divergence” (price makes a new low but momentum bars shorten), aggressive traders can deploy 30%-50% of capital. This is called “Dancing with the Whales.”
- 🛡️ Safest Entry Point: USD 94,545.89
- Action Guide: This is for conservative traders. Only when the price reclaims USD 94,545.89 does it mean bulls have regained control. You miss the bottom profit, but your win rate increases drastically.
Our goal is not to provide a crystal ball, but to offer a clear, logical, and actionable framework by simplifying professional analysis.
Summary: Don’t Be Exit Liquidity
Fundamental news tells you what happened. Technical analysis predicts what will happen. Don’t gamble your future on a “maybe” at $88,000. Your capital is your ammunition. Don’t spray and pray.
Unlocking Technical Analysis: Power Moves with Diagrams !
Weekly Timeframe for BTC (Bitcoin)
Daily Timeframe for BTC (Bitcoin)
For continuous, real-time analysis of these developing market structures, visit www.chart-blitz.com.
Fundamental news tells you what happened. Technical analysis predicts what will happen. To master the professional framework that separates market signal from noise, explore our exclusive models at www.chart-blitz.com.
Sources:
- https://coinmarketcap.com/currencies/bitcoin/historical-data
- https://www.tradingview.com/symbols/BTCUSD
- https://cryptoslate.com/coins/bitcoin
【Disclaimer】 The content herein is for educational purposes and reflects the author’s personal opinion only; it is not investment advice. All financial investments, including cryptocurrencies, carry significant risk, and you could lose your entire capital. To support this site, this article may contain affiliate links. While we strive for accuracy, we cannot guarantee all information is complete or error-free. Please conduct your own research and be fully responsible for your own investment decisions.