When you make a trade, you should have a clear target of where you expect to get out
William Delbert Gann – 1949
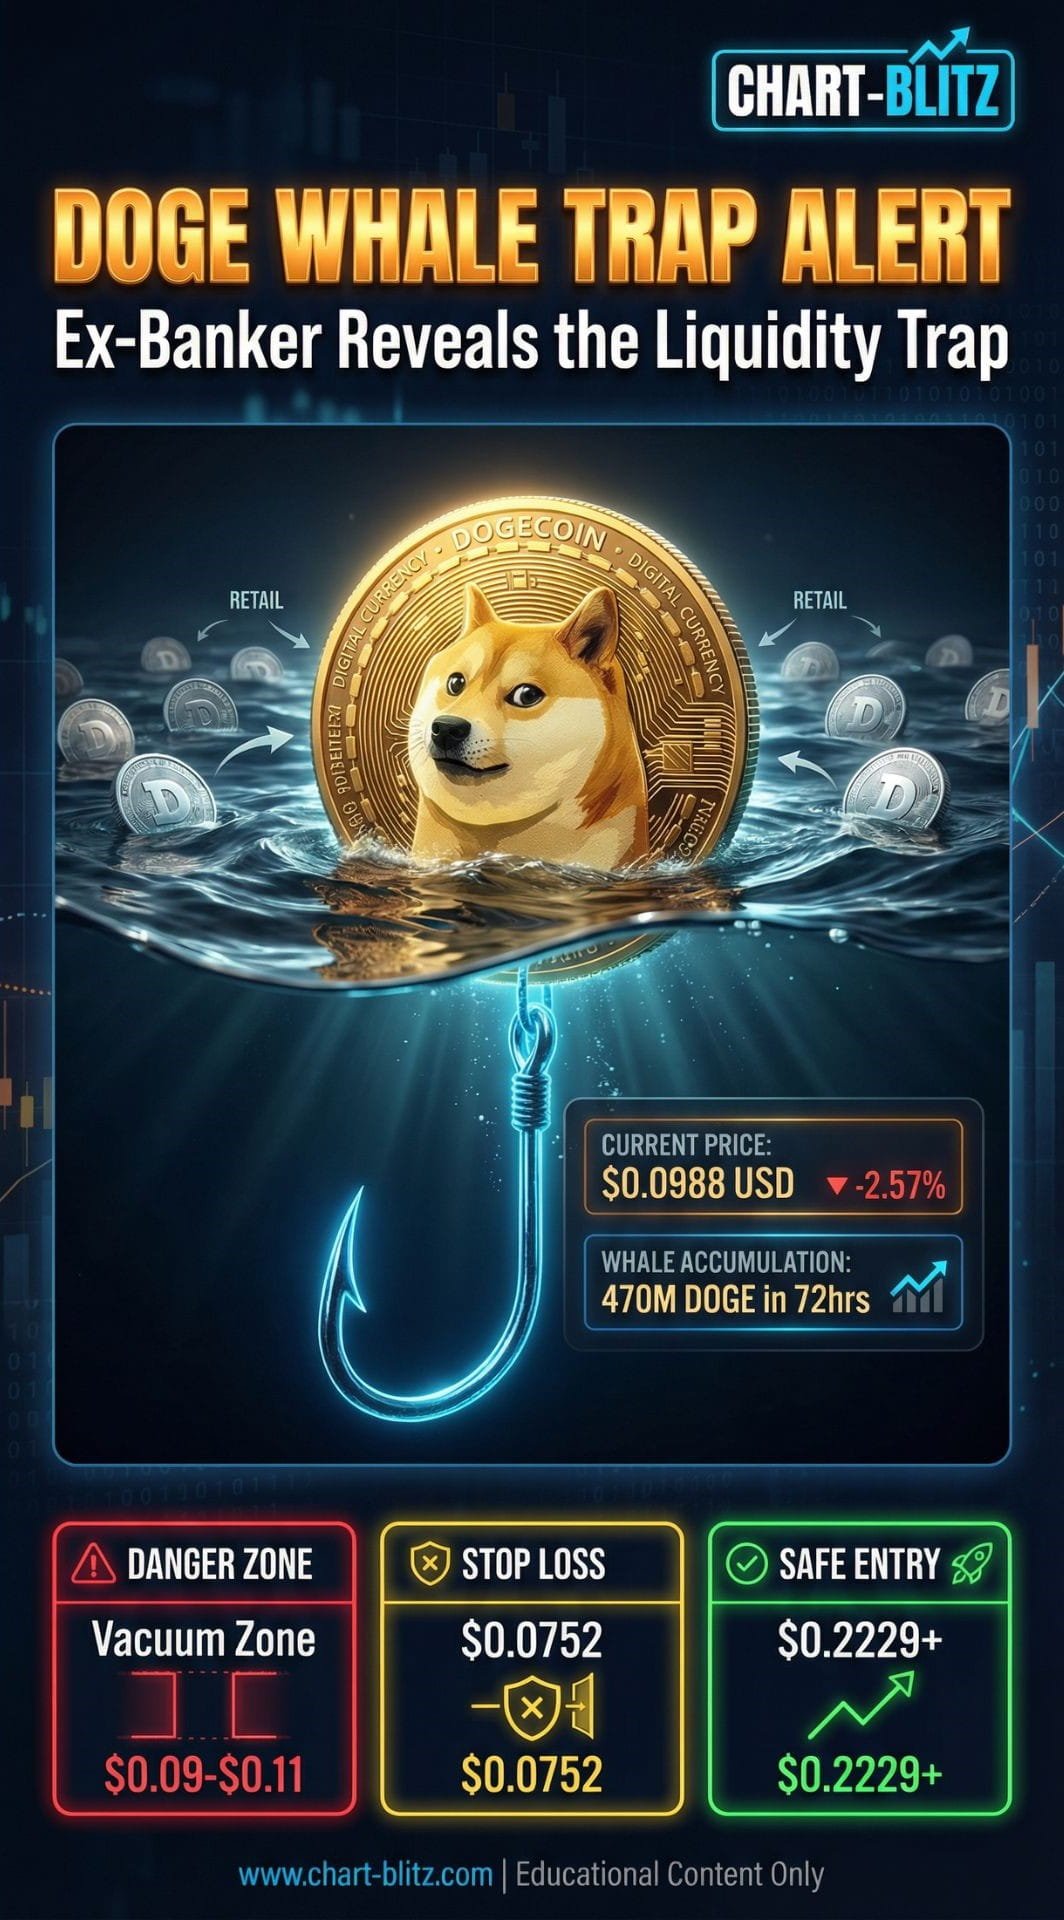
“You see news of whales accumulating 470 million DOGE; I see a meticulously designed liquidity trap by market makers on the edge of a ‘vacuum zone’.”
📰 Catalyst Interpretation: News Lags, Charts Lead. Over the past 24 hours, the market has been flooded with news of “whales frantically sweeping up 470 million DOGE within 72 hours.” Coupled with the Dogecoin Foundation announcing a new roadmap focused on scalability and prominent figures mentioning it again on social media, the price of DOGE briefly surged 6%, challenging the $0.10 mark again. When retail investors see this news, their first reaction is often “FOMO (Fear Of Missing Out)”—terrified of missing the next wealth-building opportunity, they blindly rush into the market.
But as a former bank trader with 20 years of experience, I must brutally tell you: Fundamental news always only provides the ‘object of analysis’, but only rigorous technical analysis can predict the ‘timing’ and ‘method’ of future market movements. These so-called bullish news items are often just catalysts released by market makers to cooperate with chart trends and create “Exit Liquidity.” The real buy and sell signals quietly emerged on the charts weeks ago.
【Analysis Baseline Statement】
All technical analysis below is based on the price snapshot locked at 17:26 ET on March 17, 2026: DOGE = $0.0988 USD. Please treat this report as an ‘analysis map’ rather than a real-time quote.

📉 Multi-Timeframe Deep Dive: Peeling Back the Market Makers’ Cards
We absolutely cannot jump to conclusions based on one or two daily bullish candles. Professional traders must peel back the market’s true intentions layer by layer, from the macro to the micro.
📈 1. Weekly Chart: The Life-or-Death Wave (2) Bottom Test
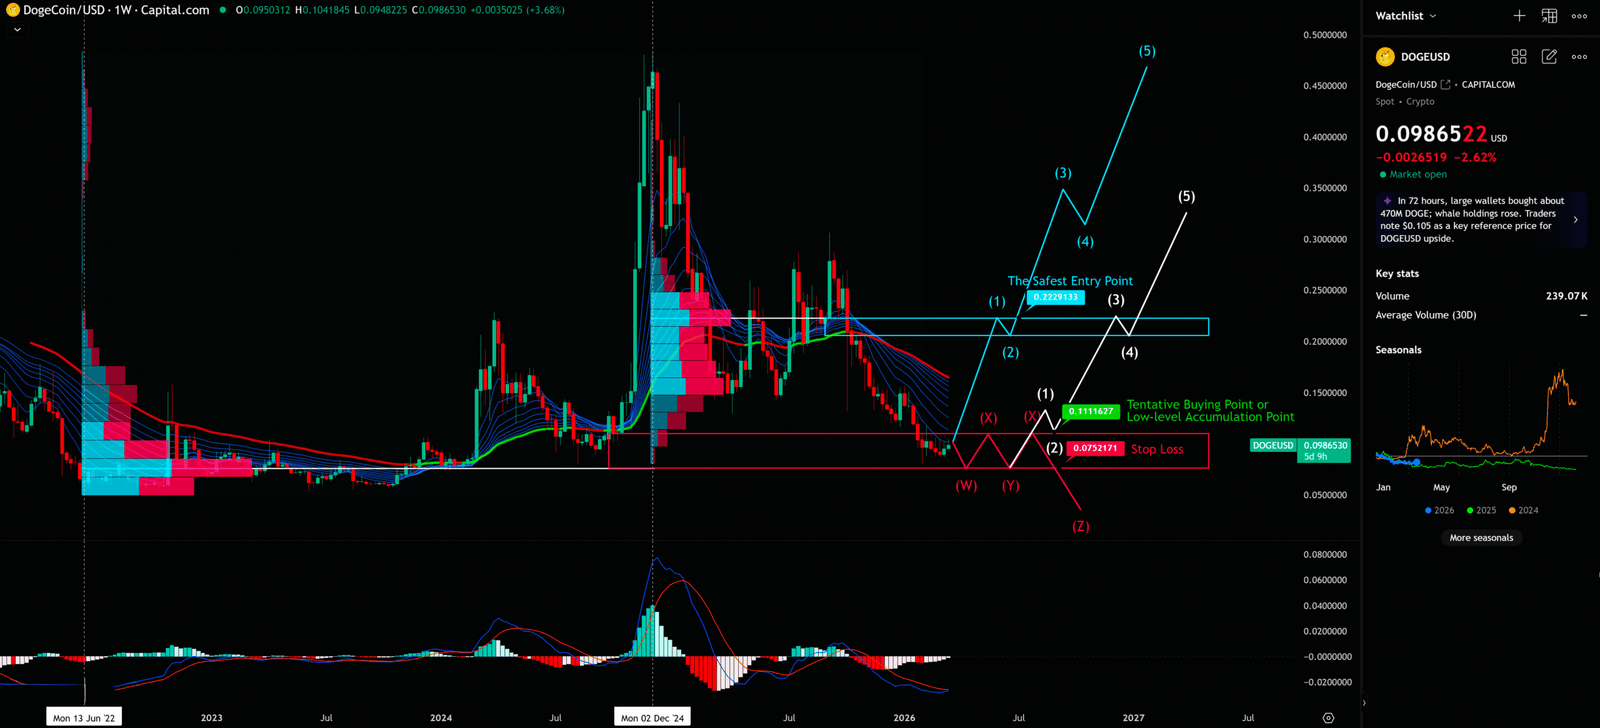
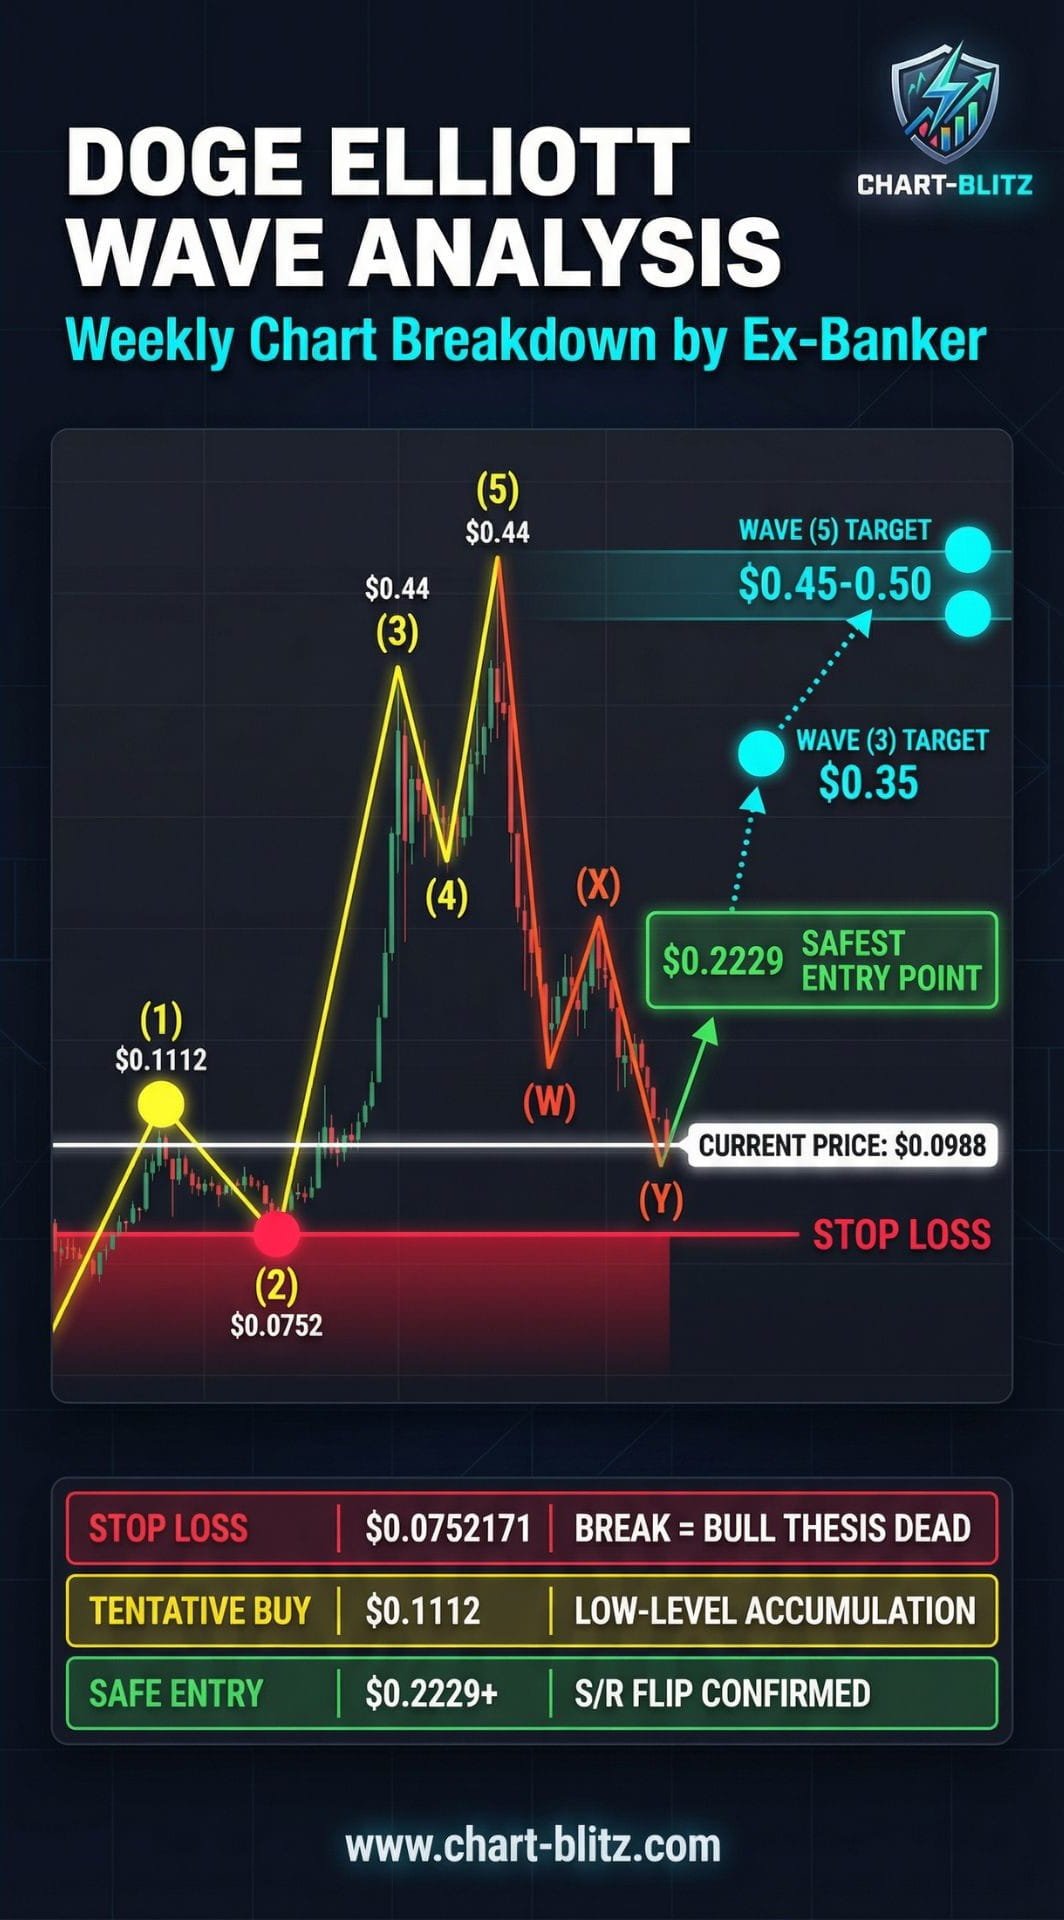
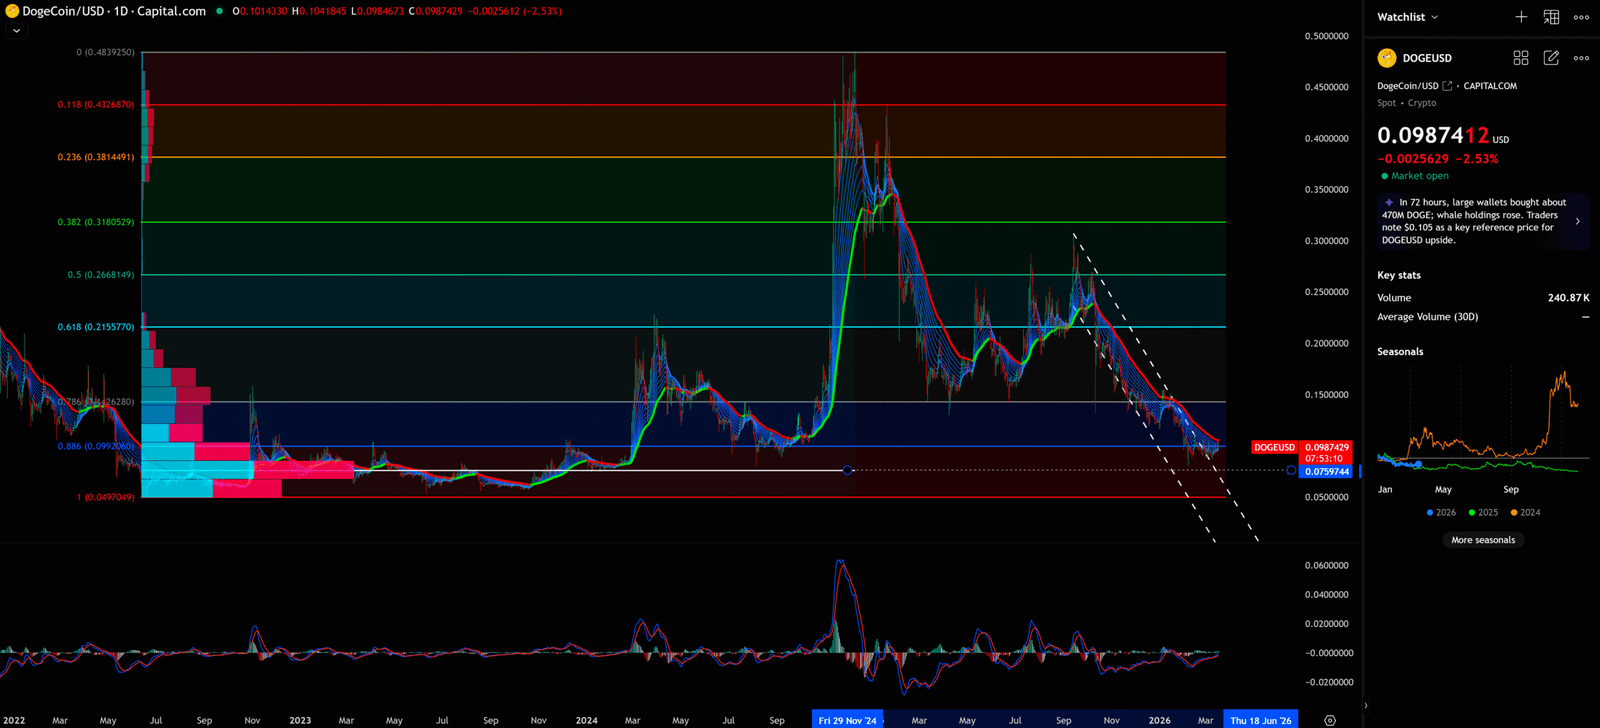
The weekly chart is always the absolute core of our analysis. Looking at the DOGE weekly chart, since peaking and retreating in late 2024, it is currently at the end of a complex W-X-Y corrective structure. If we apply the impulse wave hypothesis of Elliott Wave Theory, the current DOGE price ($0.0988) is hovering exactly near the extremely critical bottom of Wave (2).
Two fate-deciding price levels are clearly marked on the chart:
- Wave (1) Top: $0.1111627 (Current tentative buying point / low-level accumulation zone)
- Wave (2) Bottom: $0.0752171 (Absolute stop-loss defense line)
Elliott Wave Iron Rule Warning: The bottom of Wave 4 must absolutely not overlap with the top of Wave 1. Although we are currently in a suspected Wave (2) bottom, if the price unfortunately falls below this last defense line of $0.0752171, the entire 1-2-3-4-5 upward impulse wave hypothesis will be completely shattered, meaning the current trend may only be part of a larger degree corrective wave (A-B-C), and the future outlook will be disastrous.
At the same time, observing the VPFR (Volume Profile Fixed Range) indicator, you will find that the current $0.09-$0.11 range has extremely thin trading volume, forming a dangerous “Vacuum Zone.” The lack of strong volume support means the price is extremely prone to extreme fluctuations of sudden surges and plunges within this area.
Weekly Timeframe for Doge (Dogecoin)
📊 2. Daily Chart: The Last Stubbornness of the 88.6% Fibonacci
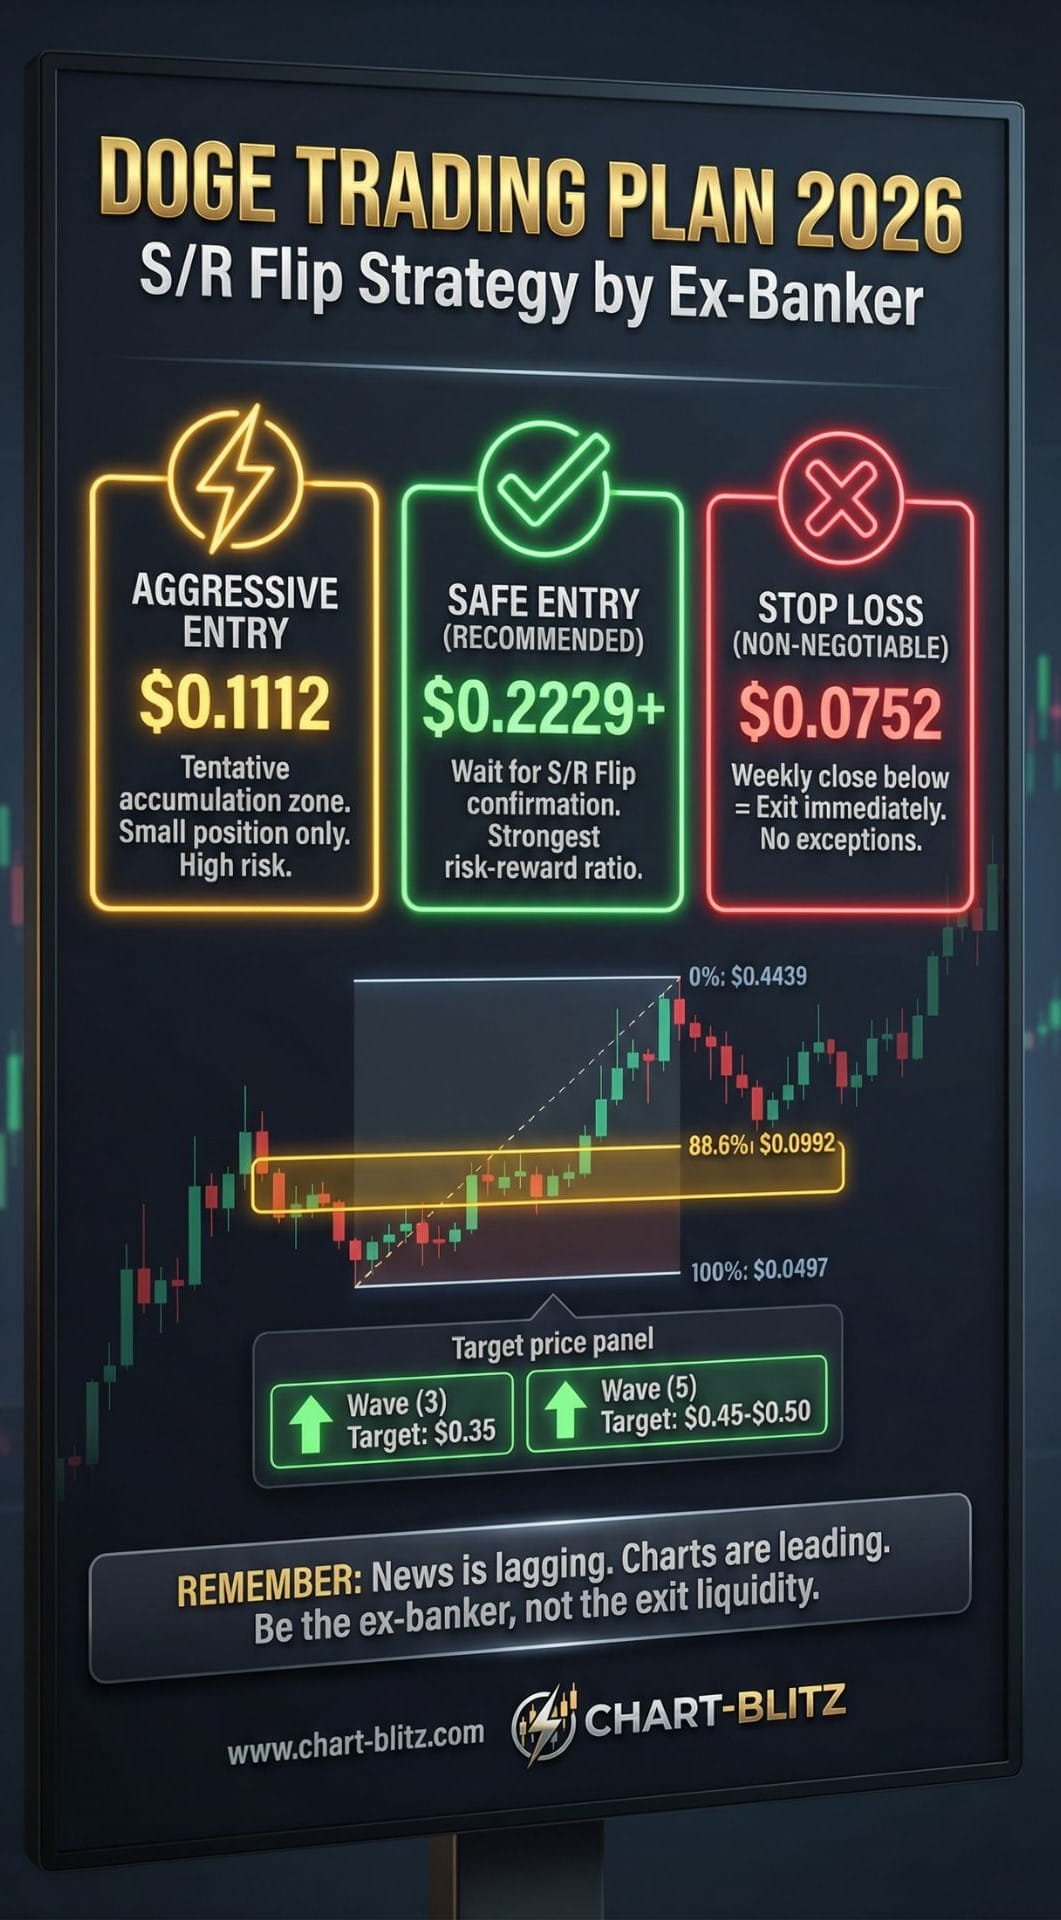
Zooming in on the daily chart, the situation is equally grim. Using the Fibonacci Retracement drawn from the late 2024 high ($0.4439) to the low, the current price is struggling near the 0.886 retracement level ($0.0992). This is an extremely deep retracement, wiping out almost all previous gains.
The EMA Ribbon shows a complete bearish alignment, with the red EMA forming heavy suppression above. Although the MACD shows slight signs of divergence below the zero axis, before breaking through the downward trendline (around $0.12-$0.13), any rebound can only be seen as a dead cat bounce.
Daily Timeframe for Doge (Dogecoin)
📉 3. Monthly & 4-Hour Charts: The Game Between Oversold and Short-Term Channels
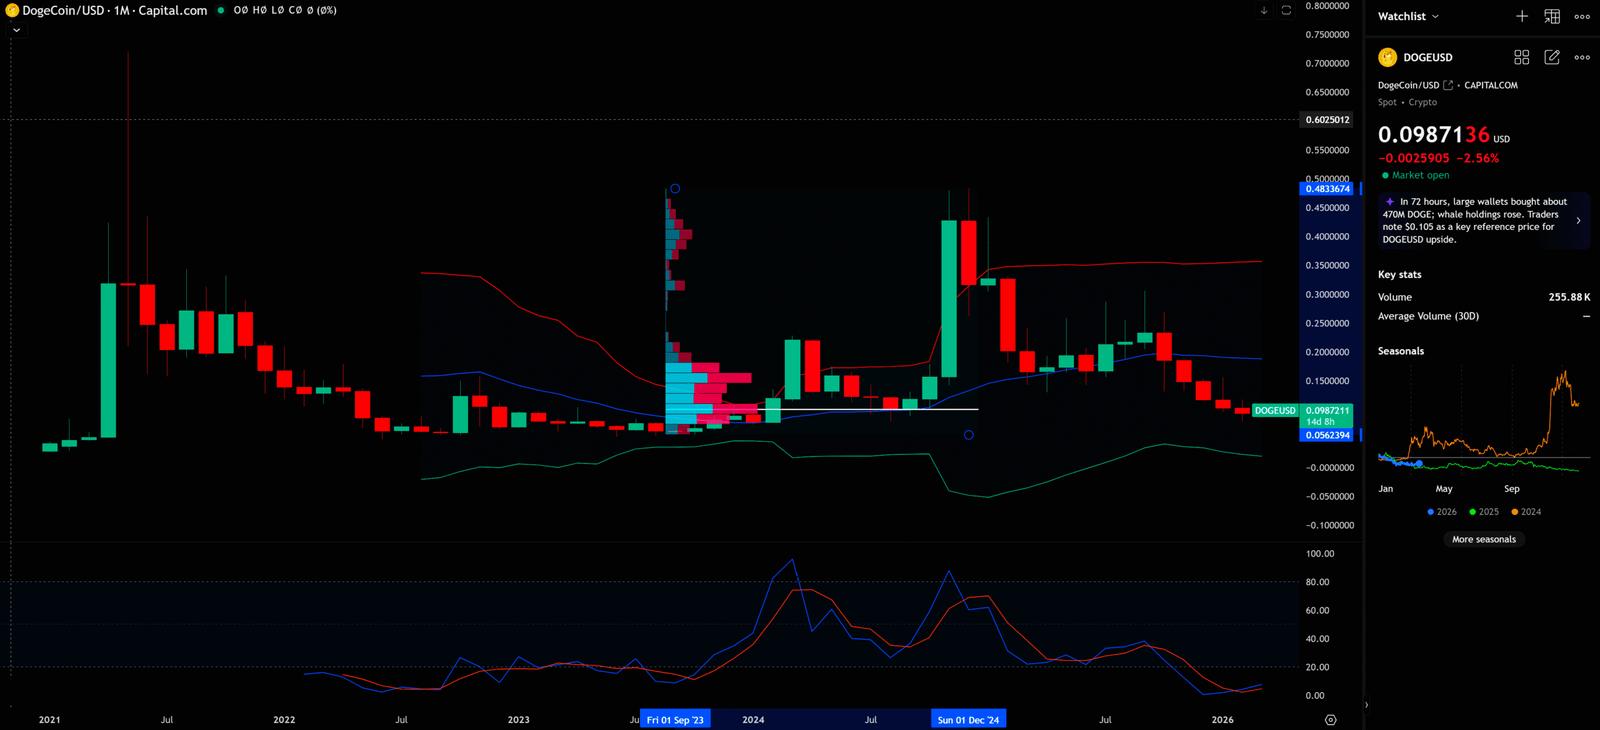
On the monthly chart, the Stochastic Oscillator has entered the extremely oversold zone of 10-20, and the price is also approaching the lower Bollinger Band ($0.05-$0.08). These long-term indicators suggest that DOGE is already in a historically undervalued area, and a long-term buying point is brewing.
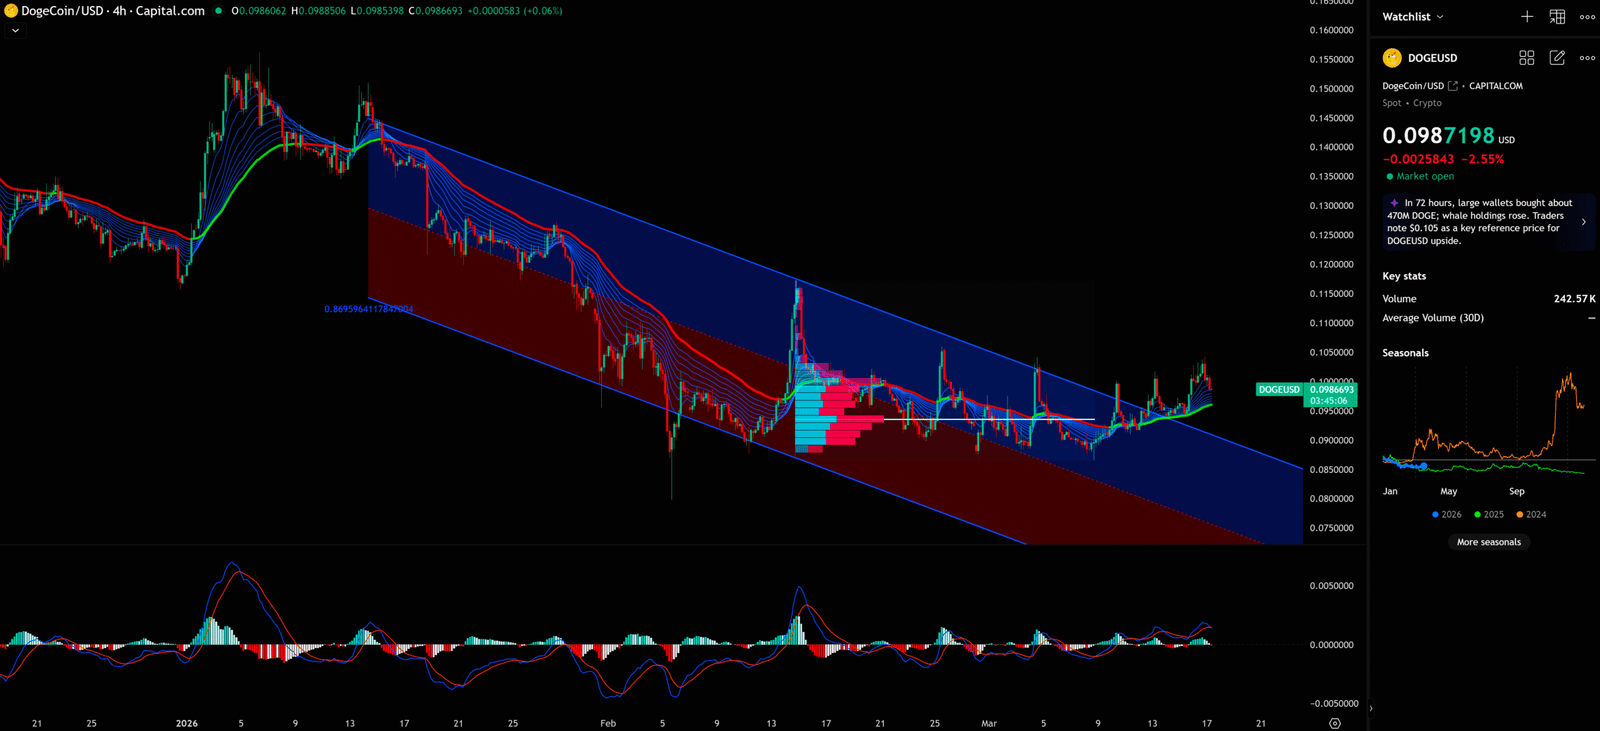
However, the 4-hour chart shows the price is still trapped in a descending Parallel Channel formed since early January 2026. Although the short-term green EMA is starting to show signs of bending upwards and the KDJ has formed a golden cross, constrained by the pressure of the channel’s upper boundary ($0.13), reversing the downtrend in the short term will not be easy.
Monthly Timeframe for Doge (Dogecoin)
4-Hour Timeframe for Doge (Dogecoin)
🎯 Comprehensive Conclusion & Trading Plan: S/R Flip Decides the Outcome
Combining the multi-timeframe analysis above, DOGE is currently on the edge of a cliff, but at the same time, an opportunity for a desperate counterattack is brewing.
Theoretically, the DOGE downtrend should not be over yet, but if the DOGE price does not continue to fall but instead turns upwards and explodes, it needs to be seen whether it can rise to the resistance zone. If it breaks above and holds, then enter the market; otherwise, it will reach the stop loss and sell off.
Precise Trading Plan:
- Aggressive (Tentative Accumulation): If the price can stabilize above $0.1111627, a small tentative buy can be made to bet on the early start of the Wave (3) main upward wave.
- Conservative (Safest Entry Point): Patiently wait for the price to strongly break through and stabilize above $0.2229133 (confirming a successful S/R Flip – Support/Resistance Interchange). Entering at this point is the safest, targeting the Wave (3) top of $0.35 or even Wave (5) at $0.45-$0.50.
- Ironclad Stop Loss: Under any circumstances, once the weekly closing price falls below $0.0752171, you must unconditionally stop loss and exit the market, with no lingering attachment.
Remember, in the financial markets, surviving is always more important than making big money.
I will continue to closely follow the price action of this crypto. Once I spot a critical reversal signal on the chart, I will update my analysis and views here immediately. Remember to bookmark this page and come back anytime to check the latest updates!
Charts don’t lie, but you have to learn their language.
Want to see our full, interactive chart breakdown? If you want to learn how to draw Fibonacci Retracement Ratio yourself, identify S/R Flips, and stop trading blind. Please browse the following『Further Reading』links. Fundamental news tells you what happened. Technical analysis predicts what will happen. To master the professional framework that separates market signal from noise, explore our exclusive models at www.chart-blitz.com.
Further Reading:
- Complete Guide to Fibonacci Retracement — How to Find the Most Precise Entry Points Using the Golden Ratio
- Elliott Wave Theory for Beginners — Iron rules of wave theory and practical applications
- Volume Profile (VPFR) Tutorial — Identifying Whale Positioning with Volume Distribution Charts
- S/R Flip Support and Resistance Swap Strategy — Identifying Key Signals for Trend Reversals
【Disclaimer】 The content herein is for educational purposes and reflects the author’s personal opinion only; it is not investment advice. All financial investments, including cryptocurrencies, carry significant risk, and you could lose your entire capital. To support this site, this article may contain affiliate links. While we strive for accuracy, we cannot guarantee all information is complete or error-free. Please conduct your own research and be fully responsible for your own investment decisions.