Alright, all you Market Surfers reacting faster than lightning, Crypto precision operators, and friends looking to pinpoint those extreme reversal points! Today, we’re decoding a fast-reacting oscillator that’s like a close sibling to the Stochastic, but with its own personality – the Williams %R indicator! Its creator, Larry Williams, is an absolute legend in the trading world! Wanna know how this super-fast %R helps you read short-term market sentiment? Let’s dive in!
What the heck is Williams %R? How’s it related to but different from Stochastic (%K)?
Williams %R (often just %R) is a momentum oscillator developed by the famous trader and author Larry Williams. Its core purpose is very similar to the Stochastic Oscillator: both measure the current closing price’s relative position within the high-low range over a specific lookback period to identify potential overbought or oversold conditions.
But it has two main differences from the standard (Slow) Stochastic:
- Single Line: %R typically displays just one line, whereas Slow Stoch has both %K and %D. You can think of %R as being similar to the Fast %K line of the Stochastic, but calculated slightly differently and without the extra smoothing.
- Inverted Scale: This is the biggest difference! Stochastics run from 0-100, where higher values mean closer to the recent high (overbought). Williams %R uses a 0 to -100 scale!
-
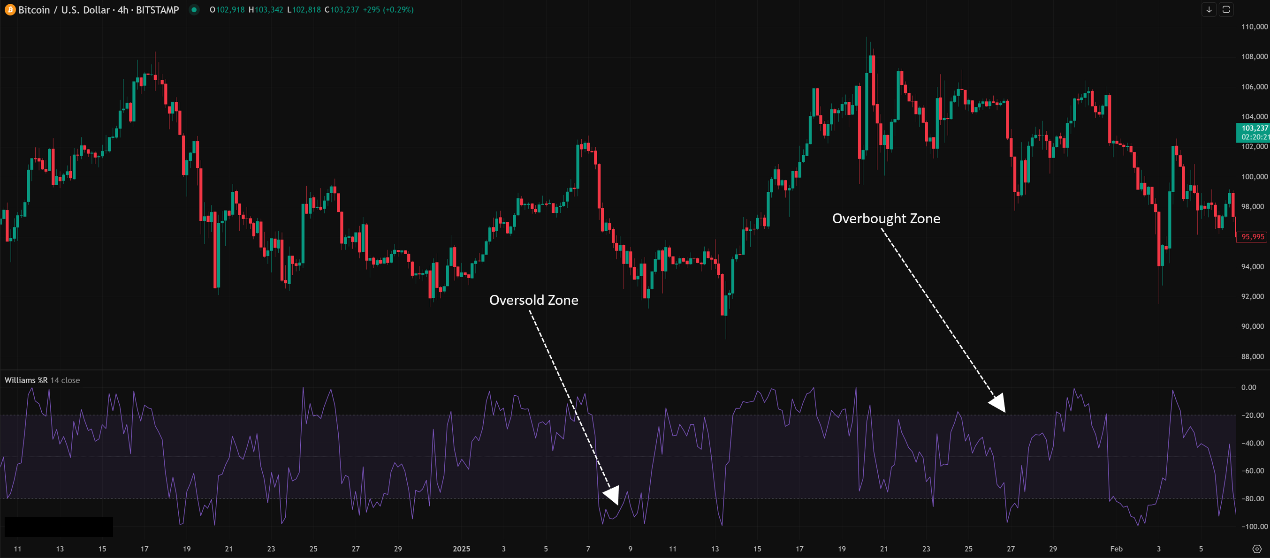
- %R near 0: Means the close is near the recent low (indicating strong selling pressure, this is the OVERSOLD zone!)
- %R near -100: Means the close is near the recent high (indicating strong buying pressure, this is the OVERBOUGHT zone!)
Remember: For %R, -20 is OVERBOUGHT, and -80 is OVERSOLD! It’s flipped compared to the 80/20 zones of Stoch/RSI!
「Williams %R Structure: 0 to -100 Inverted Scale!」
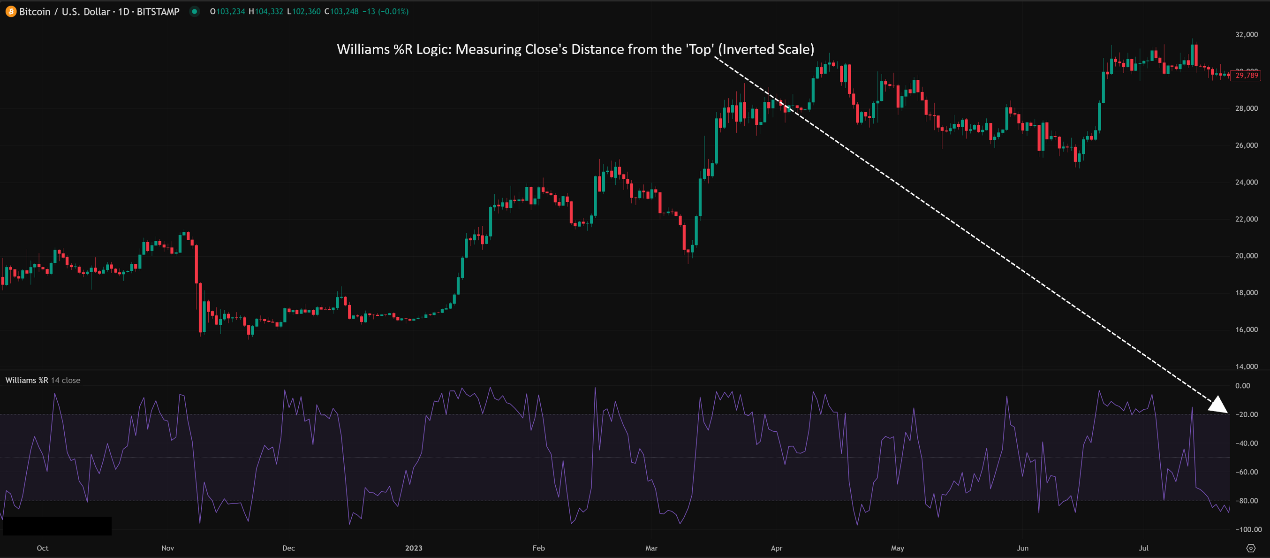
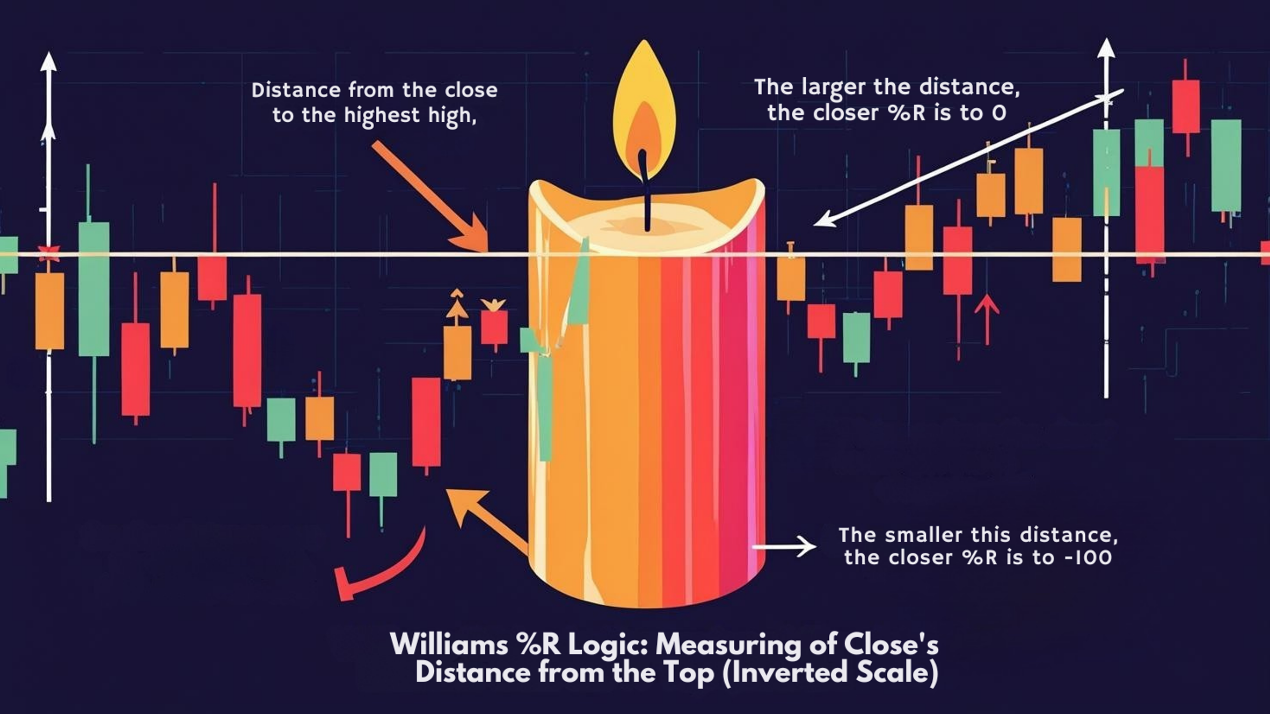
Why design it this way? Larry Williams felt that looking at how far the close is from the period’s low better reflects buying pressure, and how far it is from the period’s high better reflects selling pressure. His scale directly mirrors this “pressure distance.” A more “negative” number means stronger buying pressure; closer to 0 means stronger selling pressure. It might feel counterintuitive at first, so get used to it.
%R’s Origin Story & Design: The Mystery of the Inverted Scale
Larry Williams is a highly successful short-term trader who needed tools with extremely fast reactions. He adapted the Stochastic concept to create an indicator that more directly and rapidly reflected the price’s position within its recent range.
- Design Philosophy:
- Core idea same as Stoch: Closing prices tend toward the extremes in the direction of the trend.
- Reason for Inverted Scale: He wanted the indicator’s value to directly correlate with “selling pressure” (close to low = strong selling pressure = %R near 0) and “buying pressure” (close to high = strong buying pressure = %R near -100). The more negative, the stronger the buyers; closer to zero, the stronger the sellers. It’s flipped from how we might intuitively think.
- Single Line: Aimed for ultimate simplicity and speed, omitting the smoothing %D line of Stochastics.
- Core Calculation (Concept):
- %R = [(Highest High in Period – Current Close) / (Highest High in Period – Lowest Low in Period)] * (-100)
- Notice the numerator is Highest High – Close, then multiplied by -100. So, the closer the close is to the highest high, the closer the result is to -100 (overbought); the closer the close is to the lowest low, the closer the result is to 0 (oversold).
Williams %R Basic Plays (Beginner’s Standard Moves):
Due to %R’s speed and inverted scale, usage requires special attention.
- Overbought/Oversold Zones (OB/OS – Remember it’s -20 / -80!):
- %R > -20 (i.e., between -20 and 0) → Overbought. Market might be rising too fast, caution for pullback. NOT an immediate short signal!
- %R < -80 (i.e., between -80 and -100) → Oversold. Market might be falling too fast, watch for bounce. NOT an immediate buy signal!
- Strong Trend Trap (Same as Stoch/RSI!): In strong bull markets, %R can stay above -20 (even hug -100) for long periods; in strong bear markets, it can stay below -80 (even hug 0). Acting immediately on OB/OS signals in strong trends is suicidal!
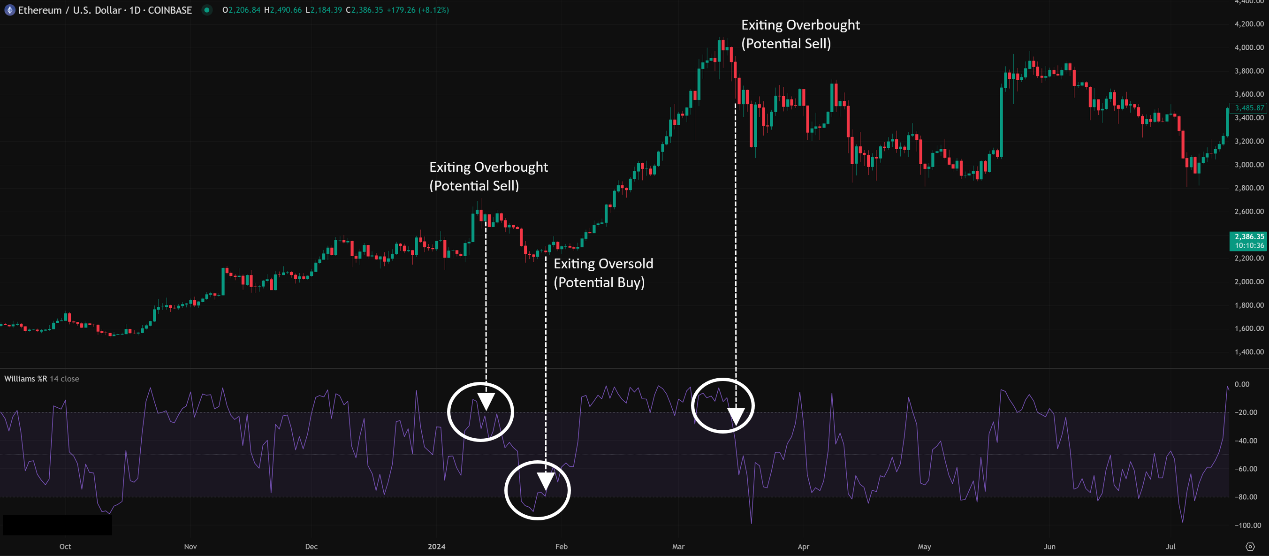
- More Reliable Use: Wait for the %R line to cross back below -20 from the overbought zone as a potential sell/exit long signal; wait for it to cross back above -80 from the oversold zone as a potential buy/exit short signal. Confirmation step is crucial!
「Williams %R OB/OS (-20/-80): Exiting the Zone is Key」
2. -50 Midpoint Reference:
-
- %R crossing above -50 → Short-term bullish momentum might be increasing.
- %R crossing below -50 → Short-term bearish momentum might be increasing.
- Can be used as a very short-term momentum shift reference, but due to %R’s volatility, this signal is often noisy.
Williams %R Advanced Plays (Pro Level Tactics – Mastering Speed!):
%R’s advanced plays are similar to Stoch’s, but adapted for its speed and inverted scale.
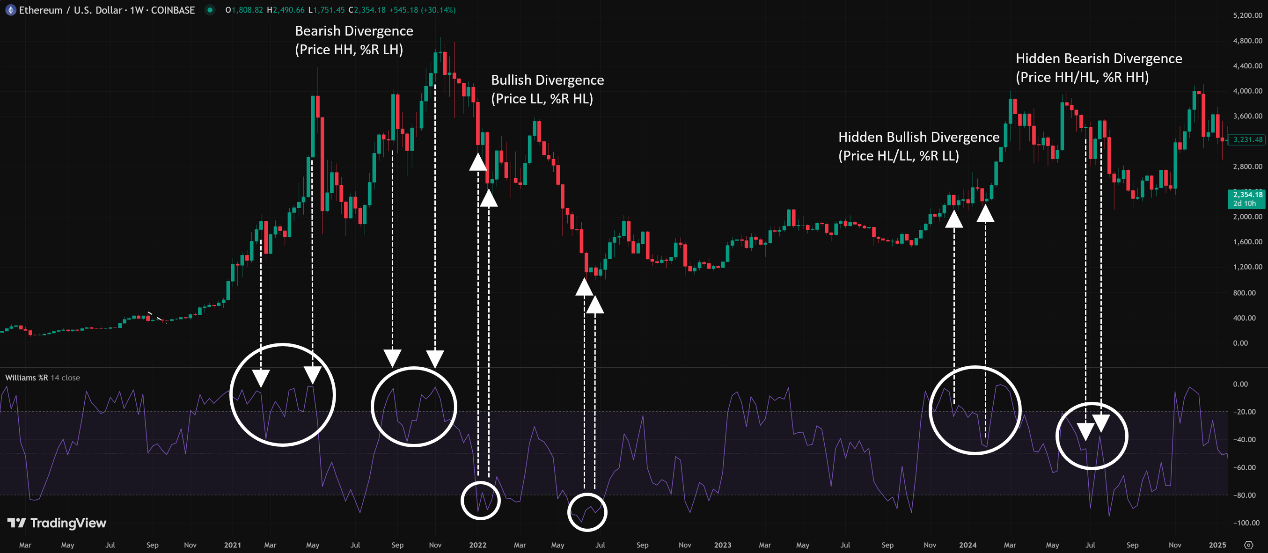
- Divergence (%R is Still a Weapon!):
- Same principle as RSI/Stoch, but remember the inverted scale!
- Regular Bullish Divergence:
- Price makes LL, but %R fails to make a new low (doesn’t get closer to 0), forming a Higher Low (HL) instead (value becomes more negative, e.g., moves from -90 up to -85).
- Interpretation: Price is falling, but the close isn’t being pushed as close to the absolute low, selling pressure weakening, potential bottom.
- Regular Bearish Divergence:
- Price makes HH, but %R fails to make a new high (doesn’t get closer to -100), forming a Lower High (LH) instead (value becomes less negative/more positive, e.g., falls from -10 to -15).
- Interpretation: Price is rising, but the close lacks the strength to push near the absolute high, buying pressure weakening, potential top.
- Hidden divergence applies similarly (e.g., Price HL, %R LL = Hidden Bullish).
- Pros: %R reacts fast, divergence might appear early.
- Cons: Higher risk of false divergences too.
「Williams %R Ace: Regular Divergence (Inverted Scale Version)」
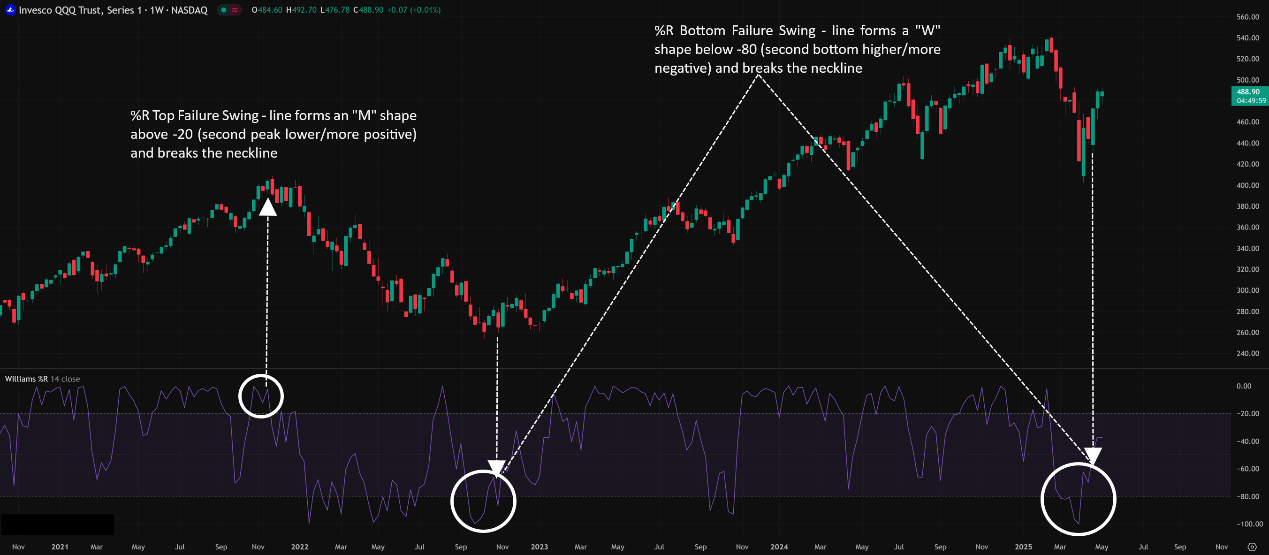
2. Failure Swings (Inverted Scale Version):
-
- Top Failure Swing (Bearish):
- %R enters overbought zone (> -20).
2. Pulls back.
3. Rallies again but fails to exceed the previous peak (fails to get closer to -100).
4. Subsequently breaks below the previous pullback low (breaks below the less negative support level). Confirmed sell.
-
- Bottom Failure Swing (Bullish):
- %R enters oversold zone (< -80).
2. Bounces.
3. Dips again but fails to break below the previous low (fails to get closer to 0).
4. Subsequently breaks above the previous bounce high (breaks above the more negative resistance level). Confirmed buy.
「Williams %R Failure Swings: Top (Left) & Bottom (Right)」
3. “Sticking” to Extremes:
-
- When %R “sticks” to the overbought (> -20) or oversold (< -80) zones for extended periods, it can actually signal a very strong trend!
- Usage: If %R repeatedly hits -80 but quickly bounces back up, it could be a buying opportunity in an uptrend (shows limited pullback strength); vice versa for downtrends near -20.
Williams %R Parameter/Timeframe Breakdown (What Settings Rock?):
Core Parameter: Period (N)
- %R has only one standard parameter: the lookback period N.
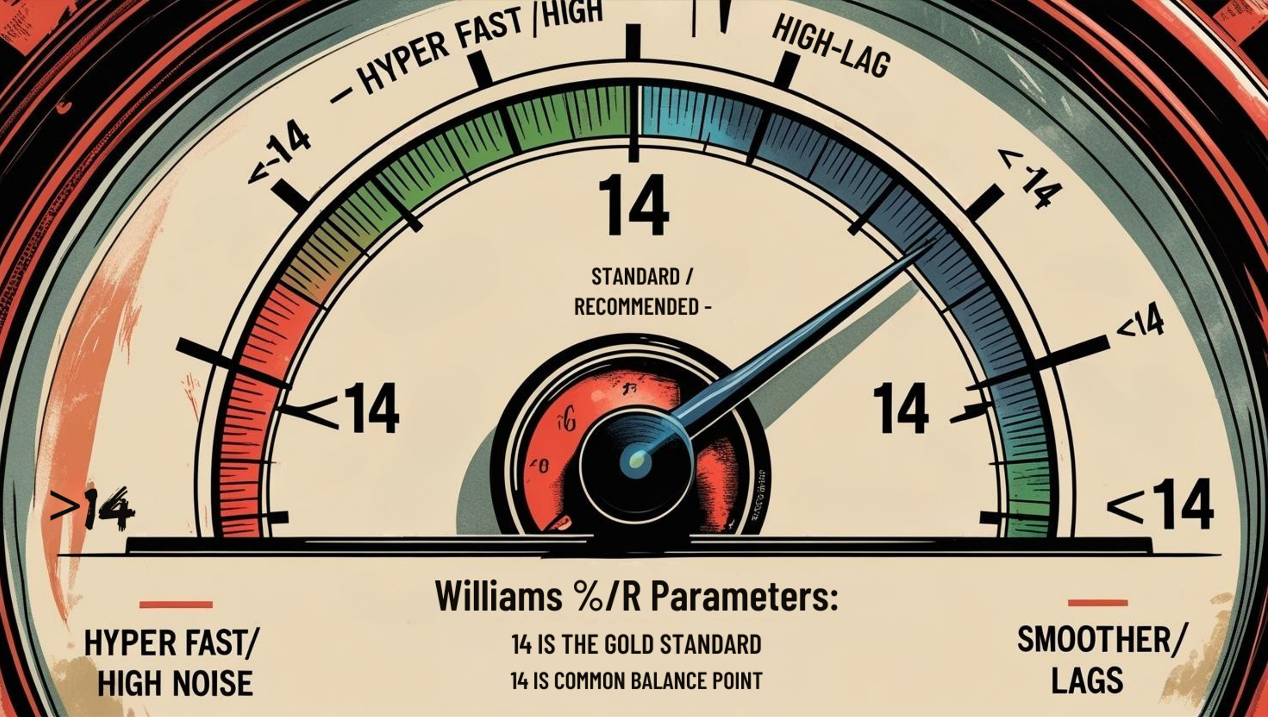
- Default Parameter: 14! This is recommended by Larry Williams and is the default on most platforms.
- Impact of Changing N:
- Shorter N (e.g., 7, 9):
- %R is extremely sensitive, reacts super fast, line is very volatile.
- Use Case: Ultra short-term Scalpers might use this for micro-fluctuations.
- Risk: Extreme noise, floods of false signals.
- Longer N (e.g., 21, 28):
- %R is relatively smoother, reacts slower.
- Use Case: For filtering noise, looking at slightly longer swing momentum.
- Risk: Increased lag.
- Shorter N (e.g., 7, 9):
Parameter Settings Analysis & “Hottest” Combo Discussion:
- Is Period 14 the Best Answer? For Larry Williams’ original design and most general applications, 14 is the time-tested gold standard. It offers a reasonable balance between speed and reliability.
- Any More “Unique” / “Hottest” Combos?
- Nope! There isn’t some secret parameter that unlocks hidden profits.
- Common Tweaks: Some traders might adjust slightly based on market volatility or style, maybe to 10 (faster) or 20/21 (slower).
- But the Key: Changing %R’s period has a very similar effect to changing the %K Lookback Period in Stochastics. If you want faster, shorten it; slower, lengthen it.
- **Conclusion: The “hottest” and most effective approach is still using the default 14 period and focusing your energy on mastering its usage (especially divergence and OB/OS confirmation) and combining it with other tools.
「Williams %R Parameters: 14 is the Gold Standard」
Timeframe Analysis:
- Ultra Short-Term (M1, M5, M15):
- Usable, but High-Stakes Gambling! %R(14) or even shorter periods (e.g., 7) will be hyperactive here, constantly hitting OB/OS. Only suitable for experienced scalpers with ironclad risk management, possibly trading extreme reversals.
- Intraday / Short Swing (H1, H4):
- Common Battleground for %R! The (14) period provides useful OB/OS warnings and divergence signals here.
- Usage: Focus on exits from OB/OS zones and divergence patterns, MUST CONFIRM with price action or other indicators.
- Swing / Long-Term (Daily, Weekly):
- Still Effective, Especially for Divergence! Longer-term %R divergence signals carry more weight. Using period (14) is often sufficient; try (21) or longer if it feels too volatile. Can help gauge exhaustion points within major trends.
「Williams %R Timeframes: Longer = More Reliable」
Summary: Which Unique Parameter Combo + Timeframe is Hottest & Most Effective? How to Use It?
- Parameters: Default 14 period is the most robust choice. Tweak if necessary, but backtest.
- Timeframe: H1, H4, Daily are the most versatile application zones. Weekly for major divergence. M15 or lower is high risk.
- Hottest / Most Effective Usage = Leverage OB/OS Confirmation + Master Divergence + Strict Risk Control:
- Core Use: OB/OS Exit Confirmation! Don’t act on entry into the zone, wait for the exit (-20 / -80 levels are key!).
- Divergence is King! Practice spotting both regular and hidden divergence, remembering the inverted scale.
- Don’t Use it Alone! %R is a momentum auxiliary tool. Always confirm with trend analysis, S/R, price patterns.
- Understand its “Speed” is a Double-Edged Sword! Fast alerts, but also many false signals.
- Beware the OB/OS Trap in Strong Trends!
Williams %R: The Market’s “Slingshot,” Quickly Showing Rebound Potential
%R is like a super-responsive slingshot, showing how far the price has been pulled to the extremes of its recent range and its potential to snap back.
Pros:
- Extremely Fast Reaction, faster than Stochastics.
- Clear OB/OS Zones (though inverted).
- Divergence signals appear early.
- Simple calculation.
Cons:
- Extremely Sensitive, Lots of Noise & False Signals!
- OB/OS Highly Unreliable in Strong Trends.
- Single line lacks the smoothing confirmation of Stoch’s %D.
「Williams %R: The Market Energy Slingshot」
Williams %R is a weapon built for speed, particularly favored by short-term traders. If you can understand its inverted scale and have solid strategies to filter its noise, it can be a sharp tool for catching short-term reversals.
Next Steps:
- Add Williams %R (using default 14) to your charts. Get used to the 0 to -100 inverted scale and the -20/-80 OB/OS zones.
- Compare %R(14) directly with Stochastic(14, 3, 3) lines. Feel the speed difference of %R.
- Focus on practicing identifying %R divergence, remembering the scale is flipped.
- Observe price reactions after %R exits the -20 or -80 levels.
- Backtest! Test if using %R within your strategies is effective.
Hope you master this speed indicator and catch those quick market turns!💨🎯💯