When you make a trade, you should have a clear target of where you expect to get out
William Delbert Gann – 1949
💥 The Retail Myth: You See Good News, I See Bait
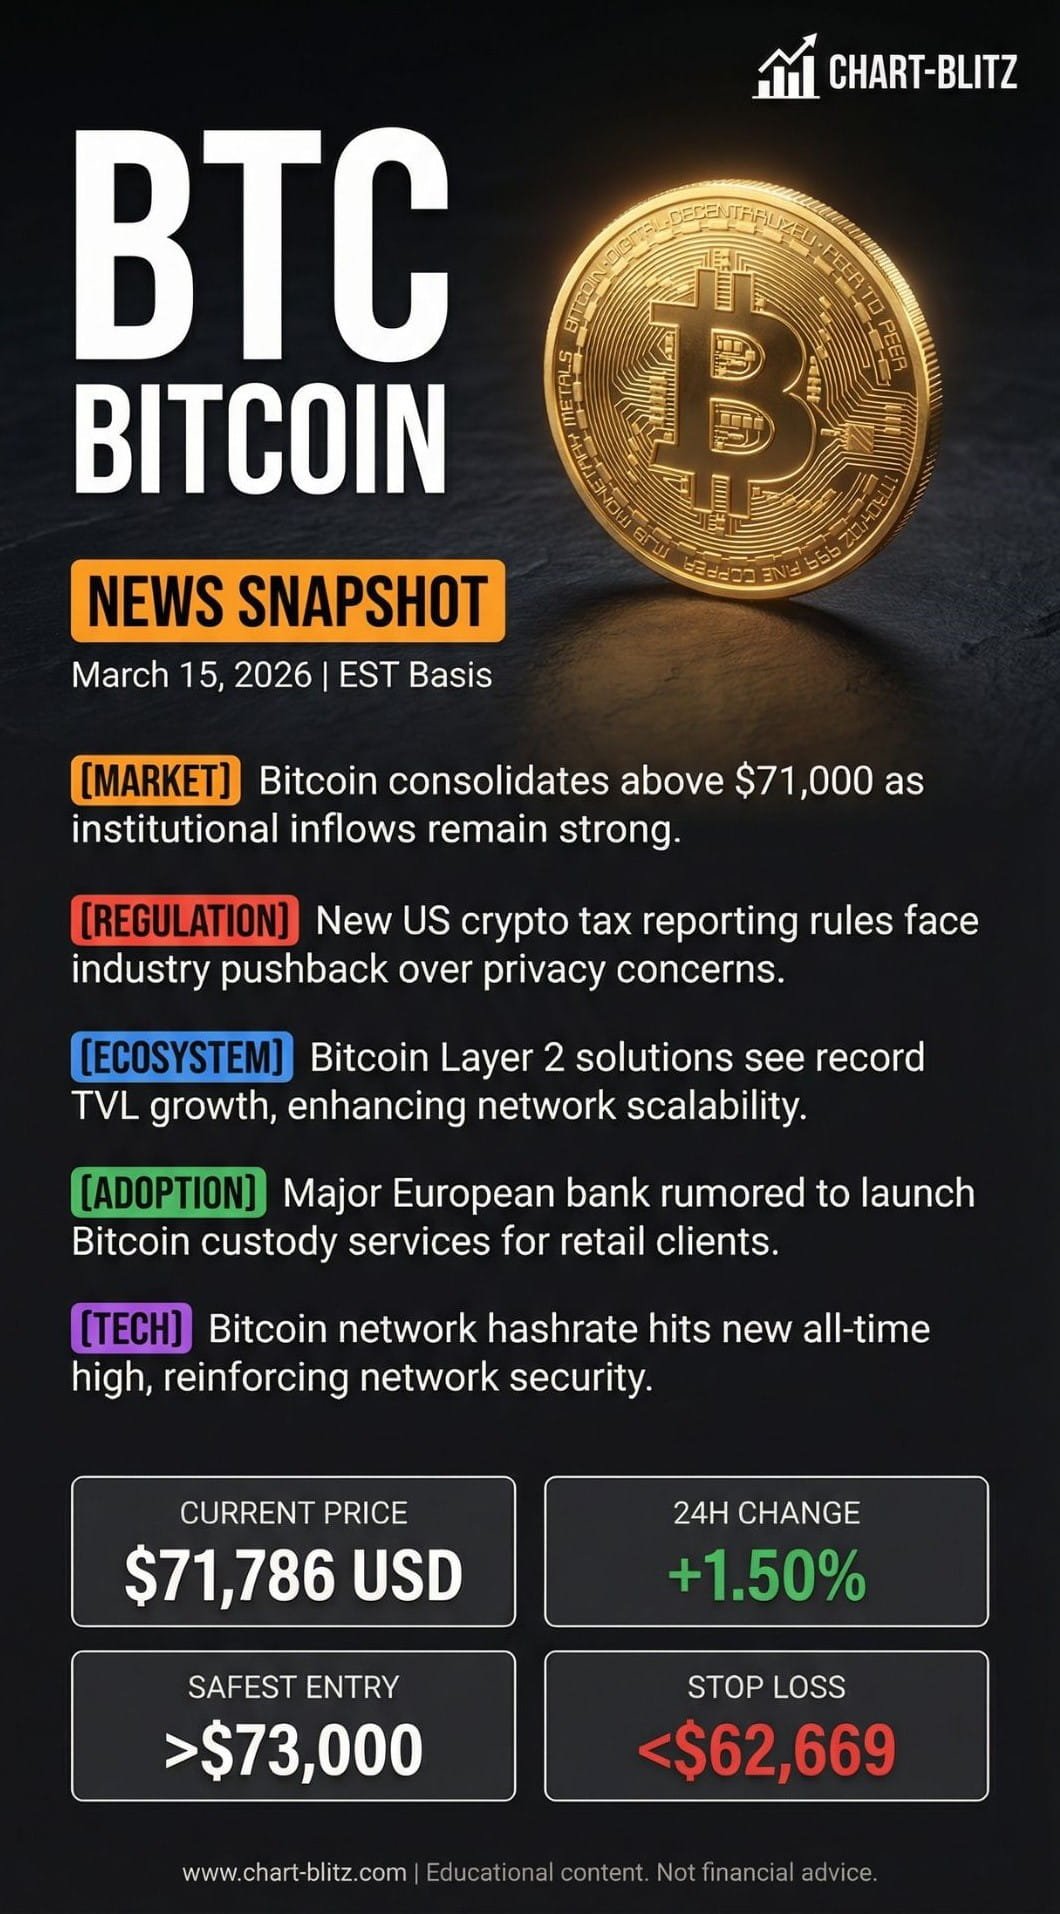
Over the past 24 hours, the market has been flooded with “bullish” news about Bitcoin: sustained institutional inflows, safe-haven capital driven by Middle East turmoil, and even rumors of a major European bank launching Bitcoin custody services for retail clients. Seeing this news and watching BTC hold steady above $71,000, many retail investors start feeling FOMO (Fear Of Missing Out), eager to jump in, terrified of missing the next massive breakout.
But as a former trader with over 20 years of experience in traditional bank trading rooms, I can tell you with absolute certainty: Fundamental news only provides the “subject of analysis,” but only rigorous technical analysis can predict the “timing” and “manner” of future market movements.
Do you think entering the market now is grabbing a bargain? In the eyes of market makers, you might just be the prey they use to create “Exit Liquidity.” News is often lagging, while price action and volume distribution on the charts have long revealed the whales’ true hands. Today, let’s strip away the noisy news and use the purest, most ruthless technical analysis to deconstruct Bitcoin’s true current situation.
【Analysis Baseline Statement】
All technical analysis below is based on the price snapshot locked on March 15, 2026: BTC = $71,786 USD. Please treat this report as an “analytical map” rather than a real-time quote.

📈 Weekly Chart: The “Lifeline” of Macro Structure and the Iron Rule of Elliott Wave
We must always start from the largest time frame because the macro cycle dictates the micro cycle. Opening the BTC weekly chart, there are several extremely critical signals you must know.
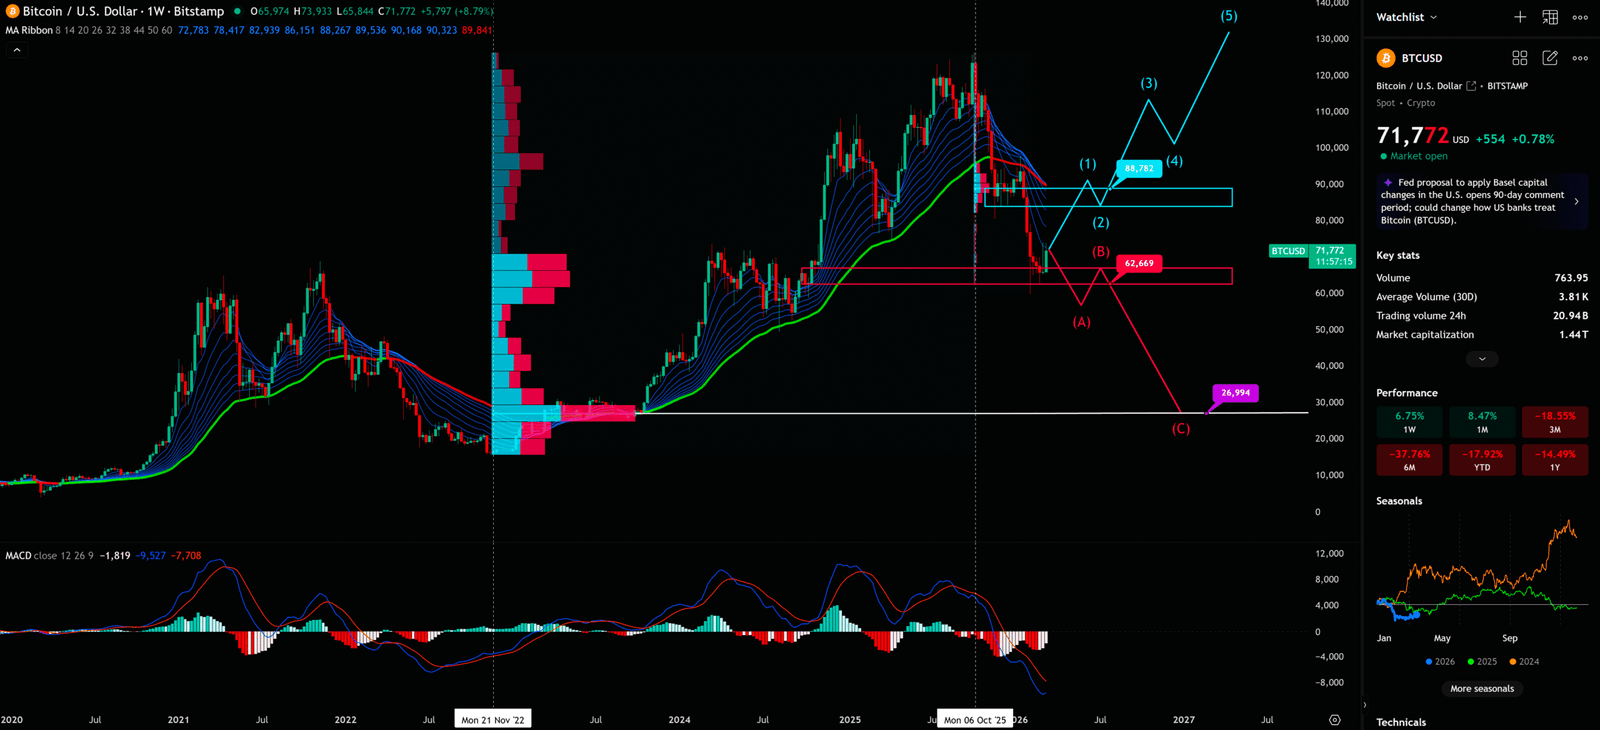
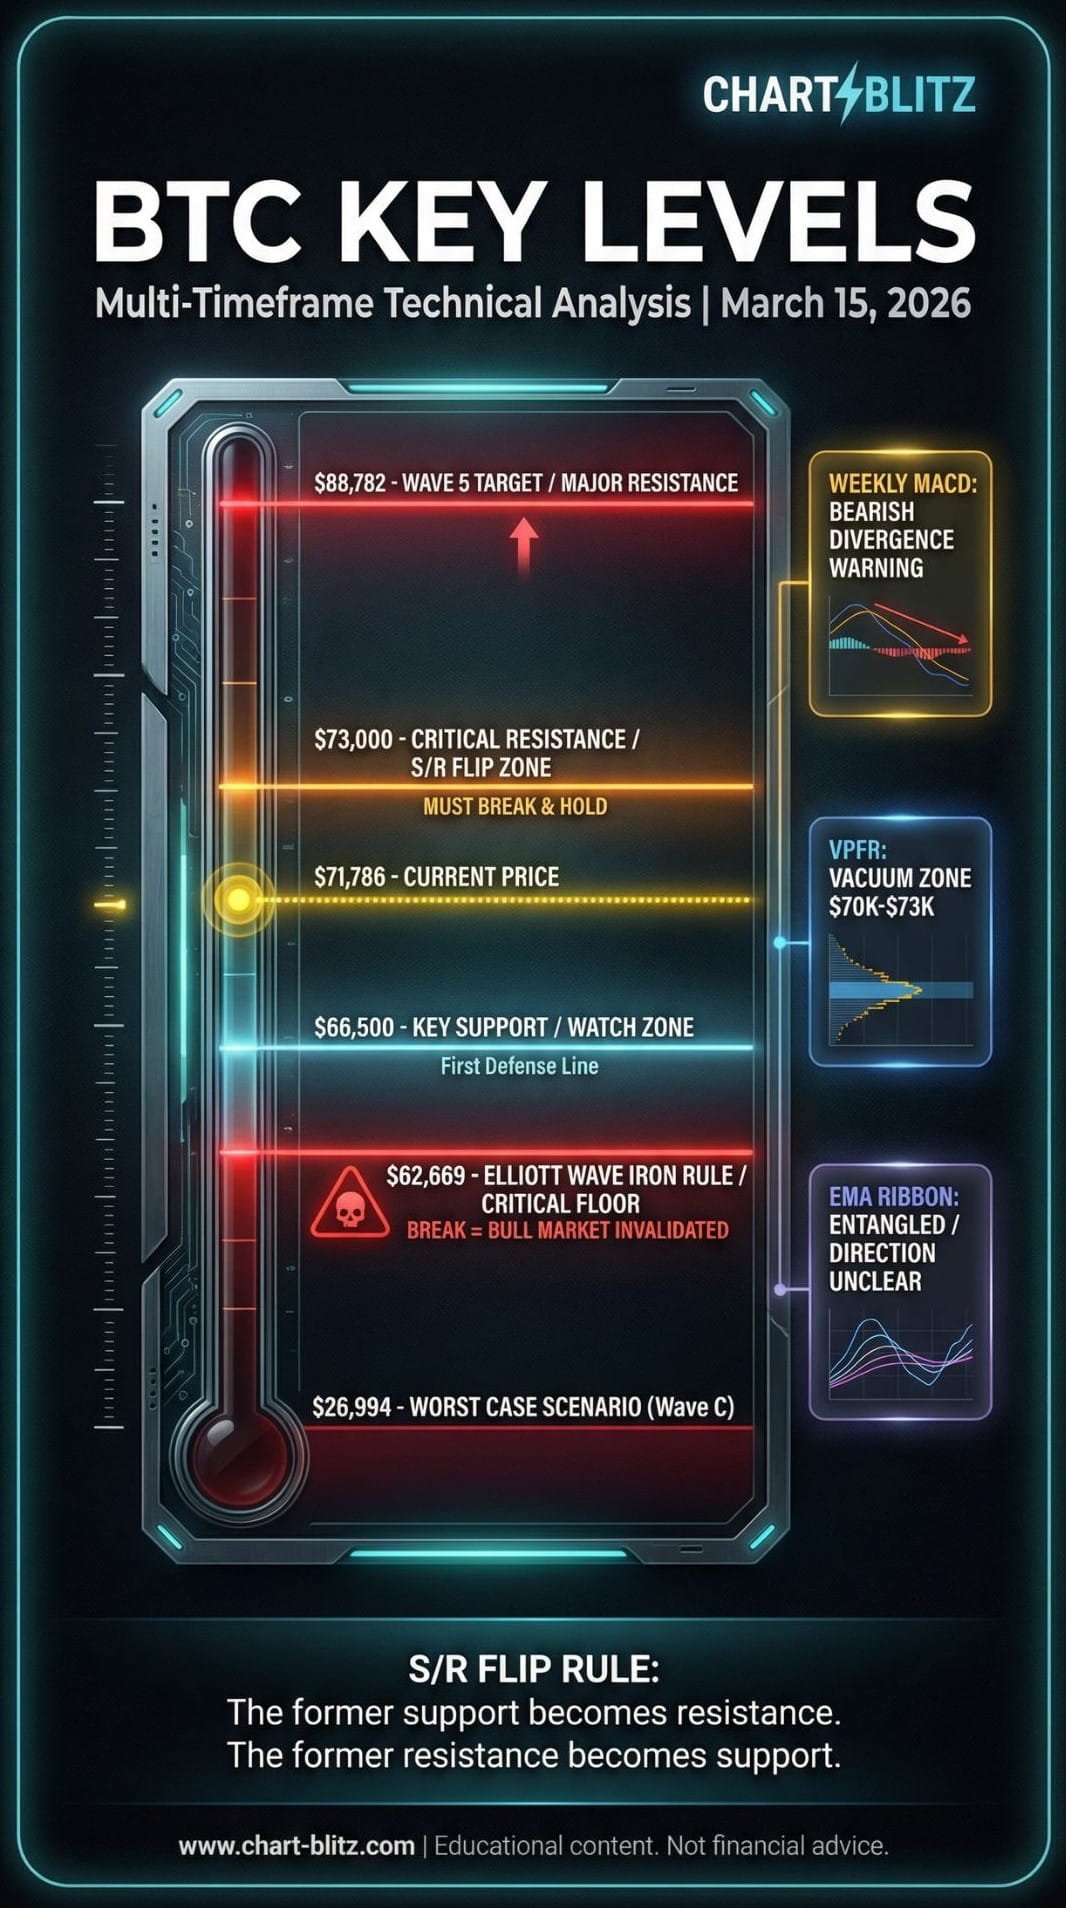
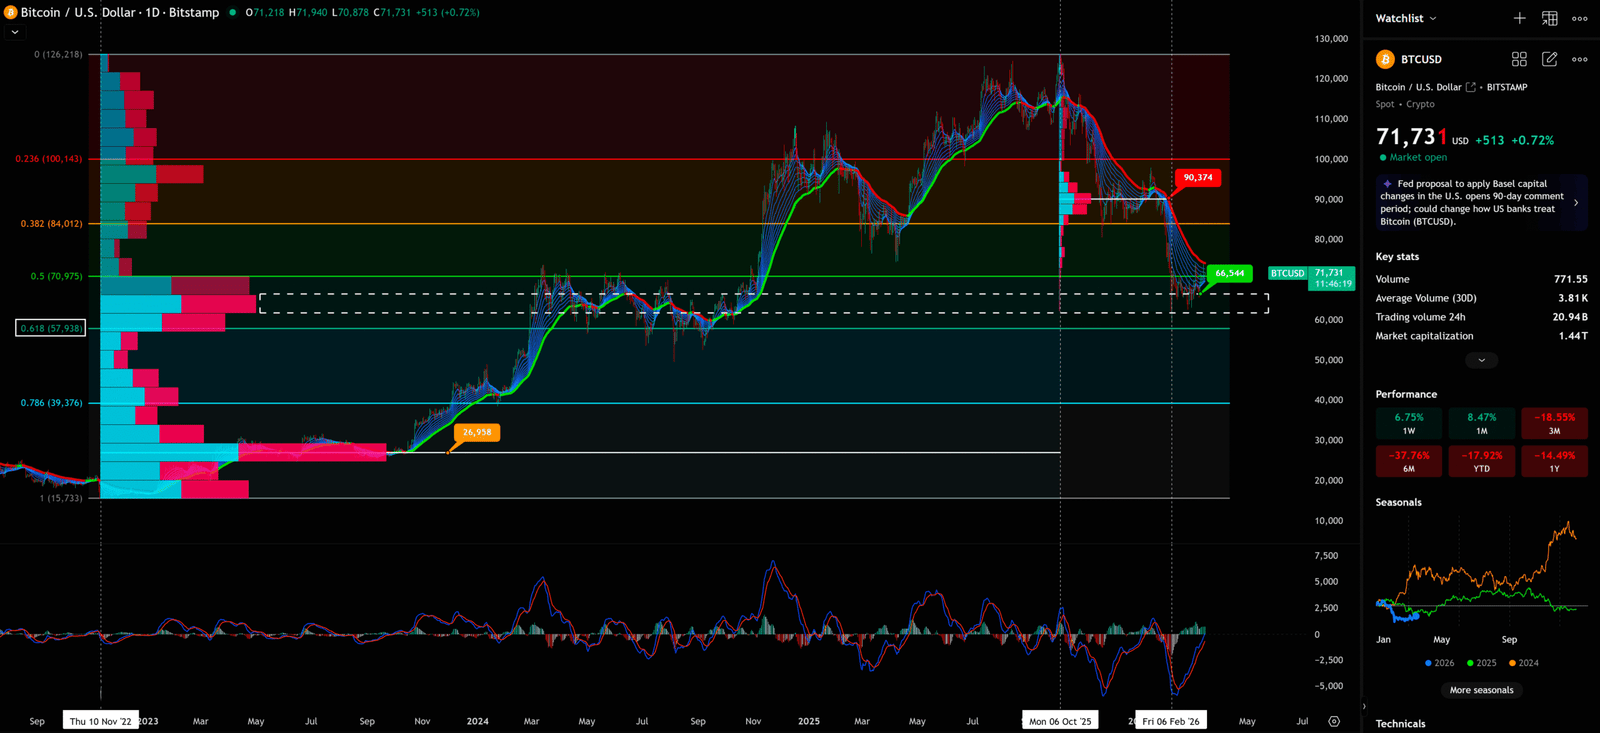
First, pay attention to the Volume Profile Fixed Range (VPFR). In the $70,000 to $73,000 range, the trading volume isn’t particularly dense. The true strong support zone (POC, Point of Control) is actually much lower (around $62,000). This means that if BTC fails to break through strongly and hold above $73,000, there is a relative “Vacuum Zone” below. Once panic selling is triggered, the price could easily experience a cliff-like drop, directly seeking the next strong support.
Second, let’s use Elliott Wave Theory to deconstruct the current macro structure. Currently, many analysts believe we are in the upward phase of Wave 5, aiming for $88,000 or even higher. But I want to remind everyone of an absolute iron rule of Elliott Wave Theory: “The bottom of Wave 4 must absolutely not overlap with the top of Wave 1.”
If BTC experiences a pullback and drops below the top of the previous Wave 1 (around $62,669), then the entire assumption of the 1-2-3-4-5 upward motive wave will be completely shattered! This means that what we are currently experiencing might just be part of a larger-degree corrective wave (A-B-C), or even a massive Bull Trap. Therefore, absolutely do not easily judge a certain downward level as the “bottom of Wave 4” and blindly buy the dip.
Weekly Timeframe for BTC (Bitcoin)
📊 Daily Chart: The Crucial Battle of S/R Flip
Zooming in on the daily chart, we can see the short-term game more clearly.
Currently, BTC is at a critical Support/Resistance Flip (S/R Flip) zone. The price has repeatedly tested the $71,000 area but has yet to show overwhelming breakout momentum.
When projecting future price movements and formulating a trading plan, we must have a clear logic:
Theoretically, if the market sentiment is truly that good, BTC’s upward trend should be very sharp. But if the BTC price action not only fails to continue breaking upward but instead turns downward and plunges, we need to see if it can hold the support zone below (around $66,500). If it breaks below and cannot hold, then trigger the stop-loss and sell immediately; conversely, if it can strongly break through the $73,000 resistance zone and hold, then enter the market and chase the trend.
At the same time, keep an eye on the daily MACD and RSI. Although there is no obvious bearish divergence yet, the upward momentum is showing signs of weakening. This is a warning signal, reminding us not to get carried away by market sentiment.
Daily Timeframe for BTC (Bitcoin)
📉 Monthly and 4-Hour Charts: Resonance of Long-Term Trend and Short-Term Volatility
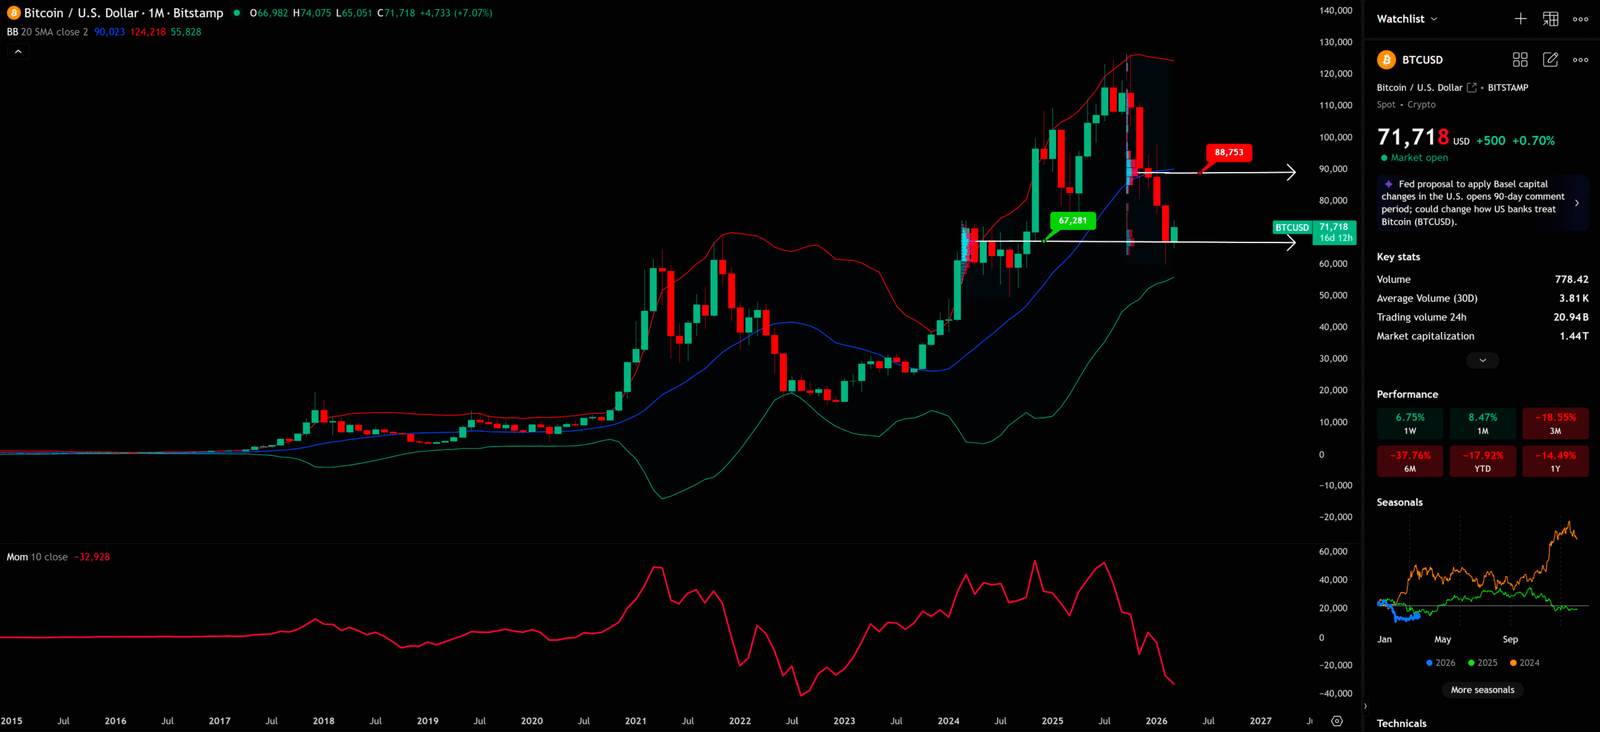
- Monthly Chart: From a macro perspective, BTC is still in a long-term ascending channel. Bollinger Bands show that the price is currently near the upper band, which usually means the asset is in a relatively “overbought” state, and the risk of a short-term pullback is increasing.
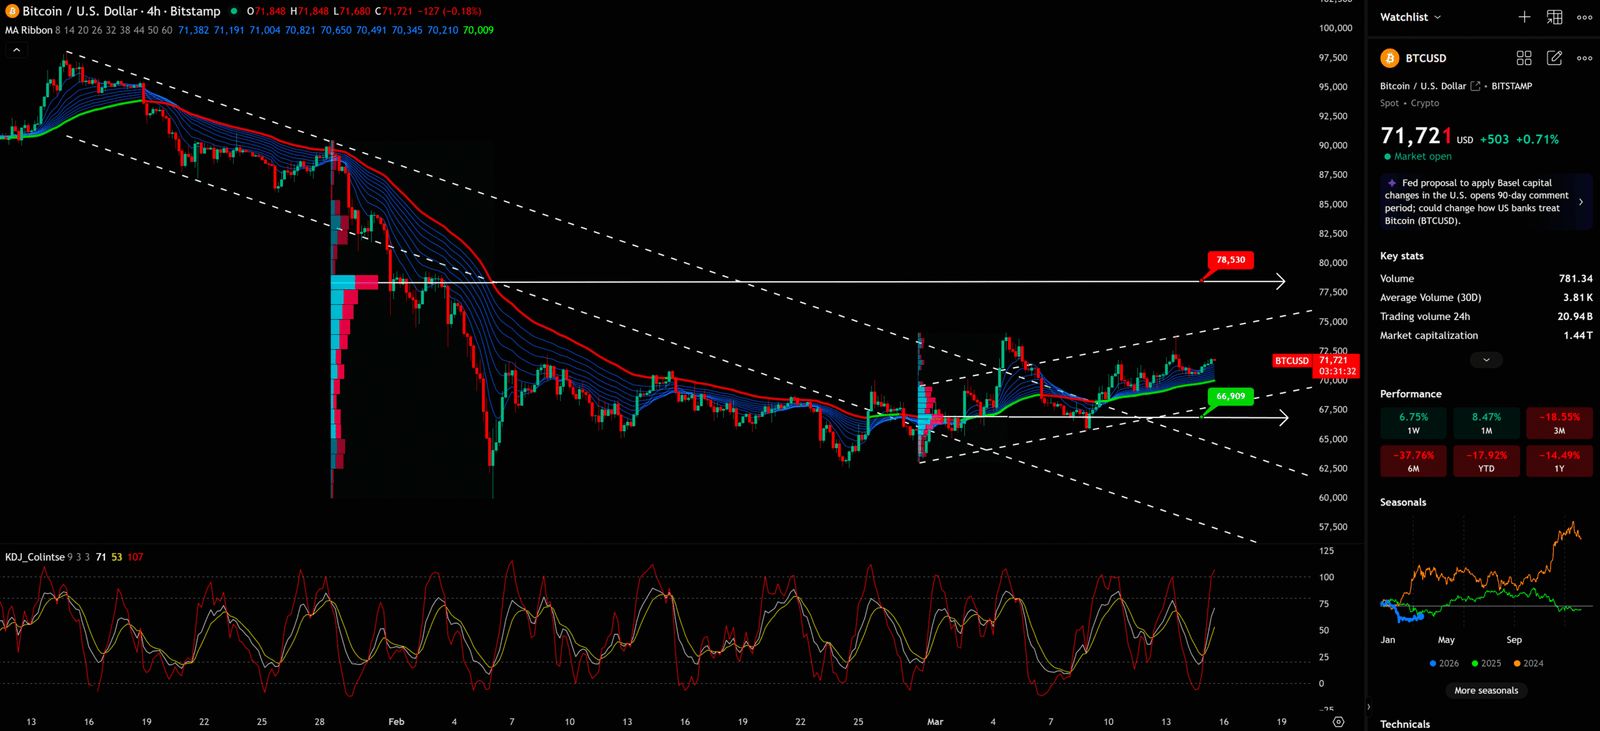
- 4-Hour Chart (4H Chart): In shorter time frames, we can observe the entangled state of the EMA Ribbon. This indicates that bulls and bears are fighting fiercely in the short term, and the direction is unclear. Under these circumstances, the risk of blindly entering the market is extremely high.
Monthly Timeframe for BTC (Bitcoin)
4-Hour Timeframe for BTC (Bitcoin)
🎯 Conclusion and Trading Plan: The Ex-Banker’s “Lifesaver”
Summarizing the multi-timeframe analysis above, we can draw the following conclusions:
- Macro Risks Remain: Despite continuous bullish news, the “Vacuum Zone” on the weekly chart and the potential failure risk of Elliott Wave Theory remind us to remain highly vigilant.
- Key Resistance and Support: Upper resistance is at $73,000, and key lower supports are at $66,500 and $62,669.
- S/R Flip Decides Life or Death: Closely monitor price action around $71,000 and wait for clear breakout or breakdown signals.
Specific Trading Plan:
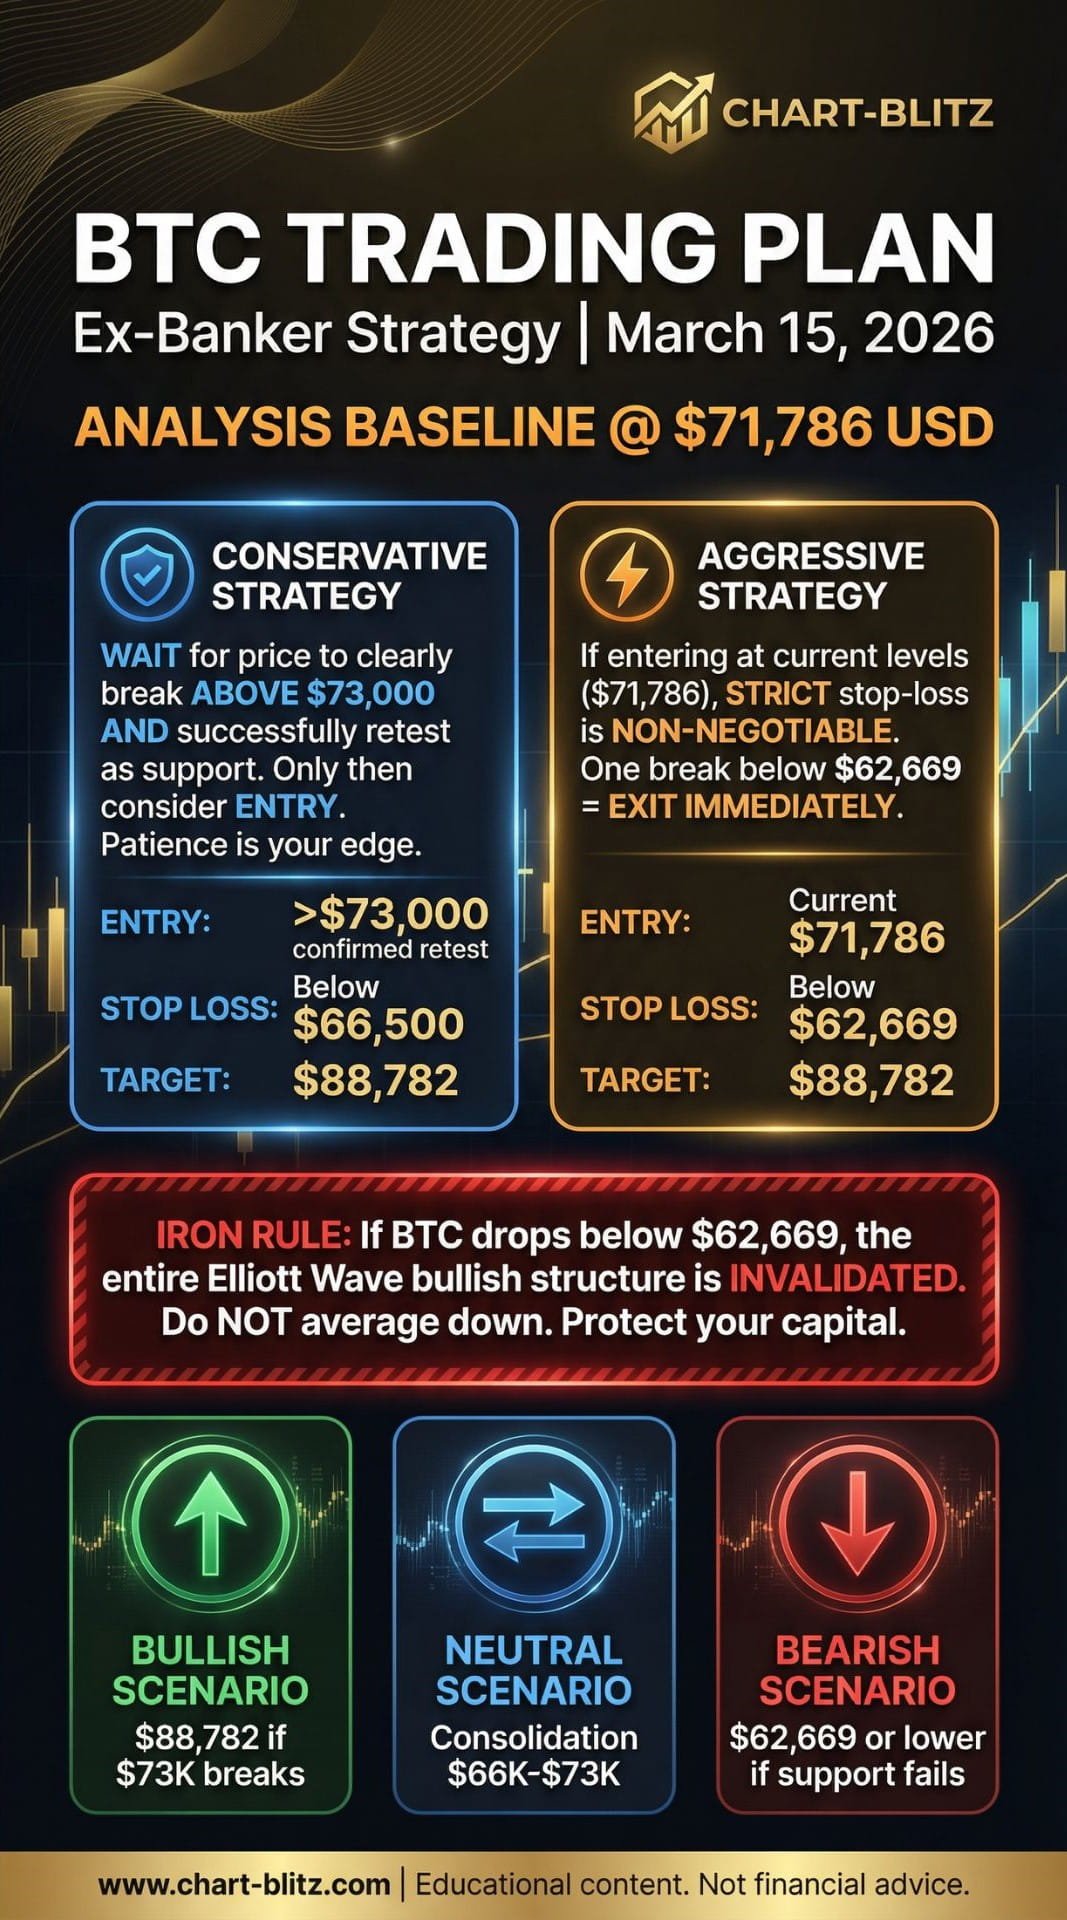
- Conservative Investors: It is recommended to wait and see for now. Wait for the price to clearly break through $73,000 and successfully retest to confirm support before considering entry.
- Aggressive Investors: If you choose to go long at the current level ($71,786), you must strictly set a stop-loss. It is recommended to set the stop-loss below $66,500 or even $62,669 (the Elliott Wave iron rule defense line). Once it breaks below, do not hesitate to exit.
Remember, in the financial markets, surviving is always more important than making big money.
I will continue to closely follow the price action of this crypto. Once I spot a critical reversal signal on the chart, I will update my analysis and views here immediately. Remember to bookmark this page and come back anytime to check the latest updates!
Charts don’t lie, but you have to learn their language.
Want to see our full, interactive chart breakdown? If you want to learn how to draw Fibonacci Retracement Ratio yourself, identify S/R Flips, and stop trading blind. Please browse the following『Further Reading』links. Fundamental news tells you what happened. Technical analysis predicts what will happen. To master the professional framework that separates market signal from noise, explore our exclusive models at www.chart-blitz.com.
Further Reading:
- Complete Guide to Fibonacci Retracement — How to use the golden ratio to find the most precise entry points
- Elliott Wave Theory for Beginners — Iron rules of wave theory and practical applications
- Volume Profile (VPFR) Tutorial — Using volume distribution charts to identify whale setups
- S/R Flip Support and Resistance Swap Strategy — Capturing Key Signals of Trend Reversal
【Disclaimer】 The content herein is for educational purposes and reflects the author’s personal opinion only; it is not investment advice. All financial investments, including cryptocurrencies, carry significant risk, and you could lose your entire capital. To support this site, this article may contain affiliate links. While we strive for accuracy, we cannot guarantee all information is complete or error-free. Please conduct your own research and be fully responsible for your own investment decisions.