When you make a trade, you should have a clear target of where you expect to get out
William Delbert Gann – 1949
Welcome back to Chart-Blitz, Chart Ninjas and Crypto Gladiators!
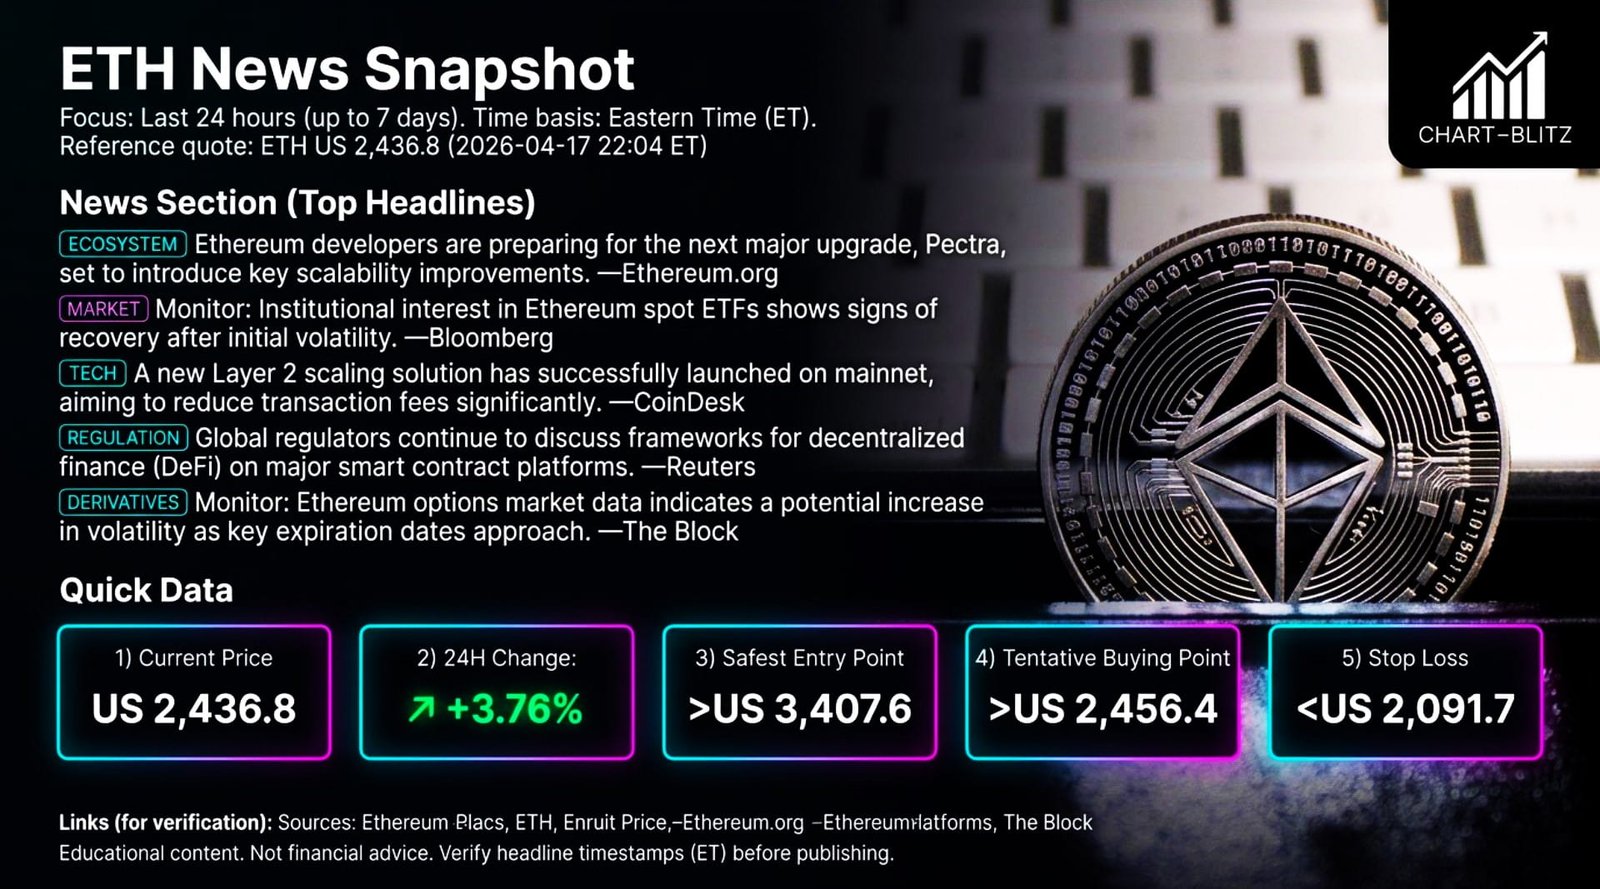
Over the past 24 hours, if you’ve been following crypto news, you’ve undoubtedly been bombarded by headlines about Ethereum. From “Pectra Upgrade Flawlessly Executed, Per-Validator Staking Limit Raised to 2,048 ETH” and “Layer 2 Transaction Fees Plummet,” to “Spot Ethereum ETFs See 6-Day Inflow Streak, Led by BlackRock’s ETHA with $18M Single-Day Inflows” and even “Q1 Processes a Record 200M Transactions, Completing a Three-Year U-Shaped Recovery.” On the surface, the fundamentals look stellar—a “bull market return” scenario.
However, as a veteran who spent 20 years grinding in traditional bank trading rooms, I have to pour some cold water on this. I remember back in 2021, whenever ETH hit a new high, the news was flooded with “Ethereum is the future.” In the trading room, what we saw was institutions quietly distributing at the top while retail investors, driven by the news, rushed in to catch the falling knife. News is often just a smokescreen released by institutions, timed perfectly with chart movements to create “Exit Liquidity.” While retail investors FOMO (Fear Of Missing Out) into buying the top based on headlines, smart money traders have already seen through the setup on the charts.
Fundamental news provides the “subject of analysis,” but only rigorous technical analysis can predict the “timing” and “manner” of future market movements. Today, we’re cutting through the noise and using technical charts as our ultimate truth serum. We will analyze from macro to micro (Weekly -> Daily -> Monthly -> 4-Hour) to deliver a decisive breakdown of ETH’s true trajectory.
【📊Analysis Baseline Statement】
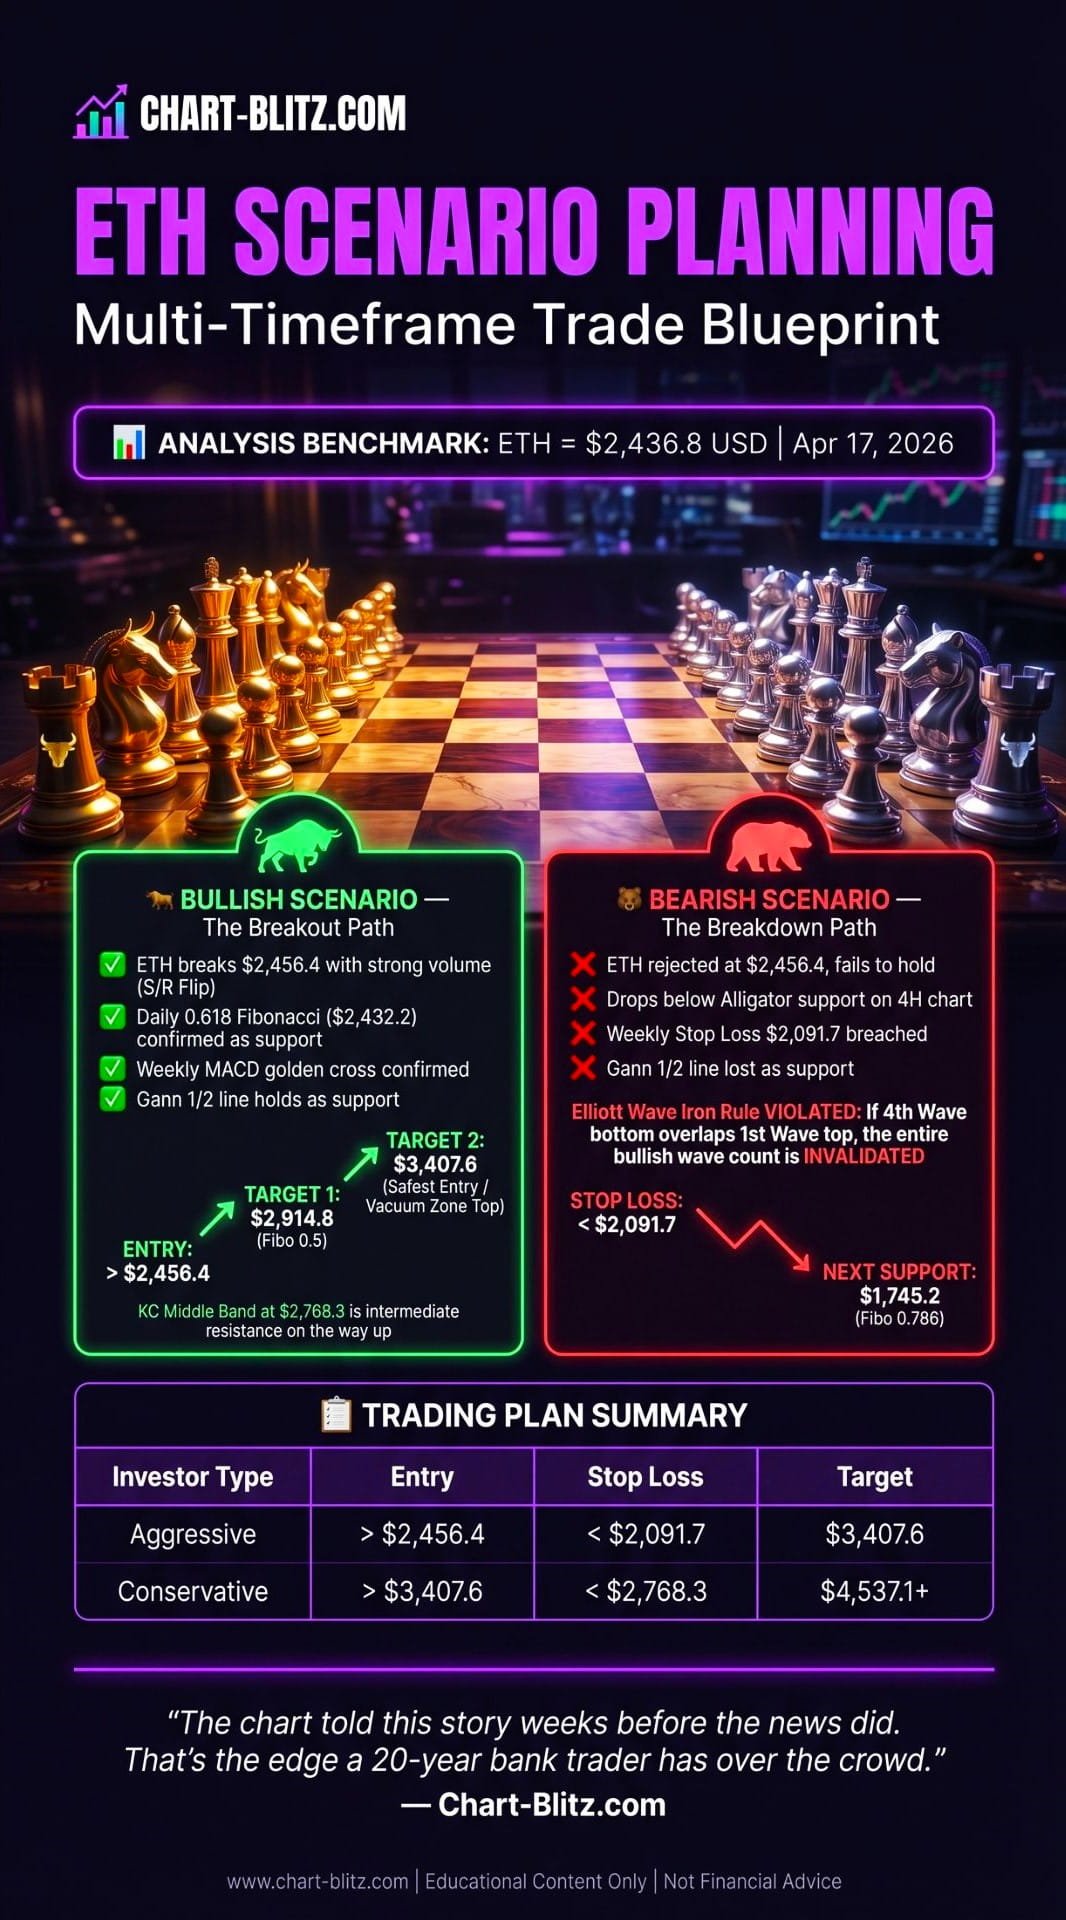
All technical analysis below is based on the locked price snapshot of ETH = 2,436.8 USD as of April 17, 2026, 22:04 (ET). Please treat this report as an “analysis map” rather than a real-time quote.
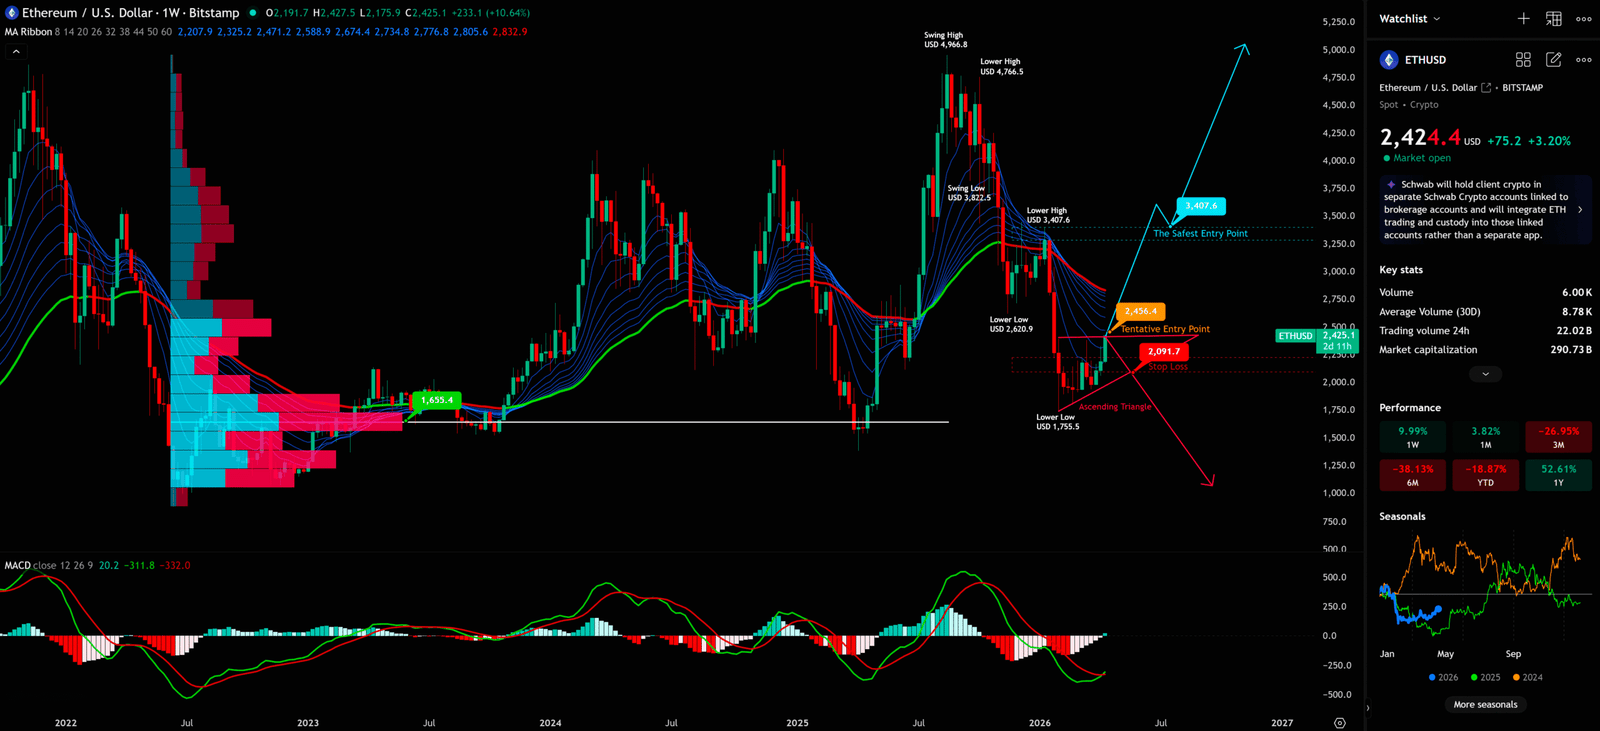
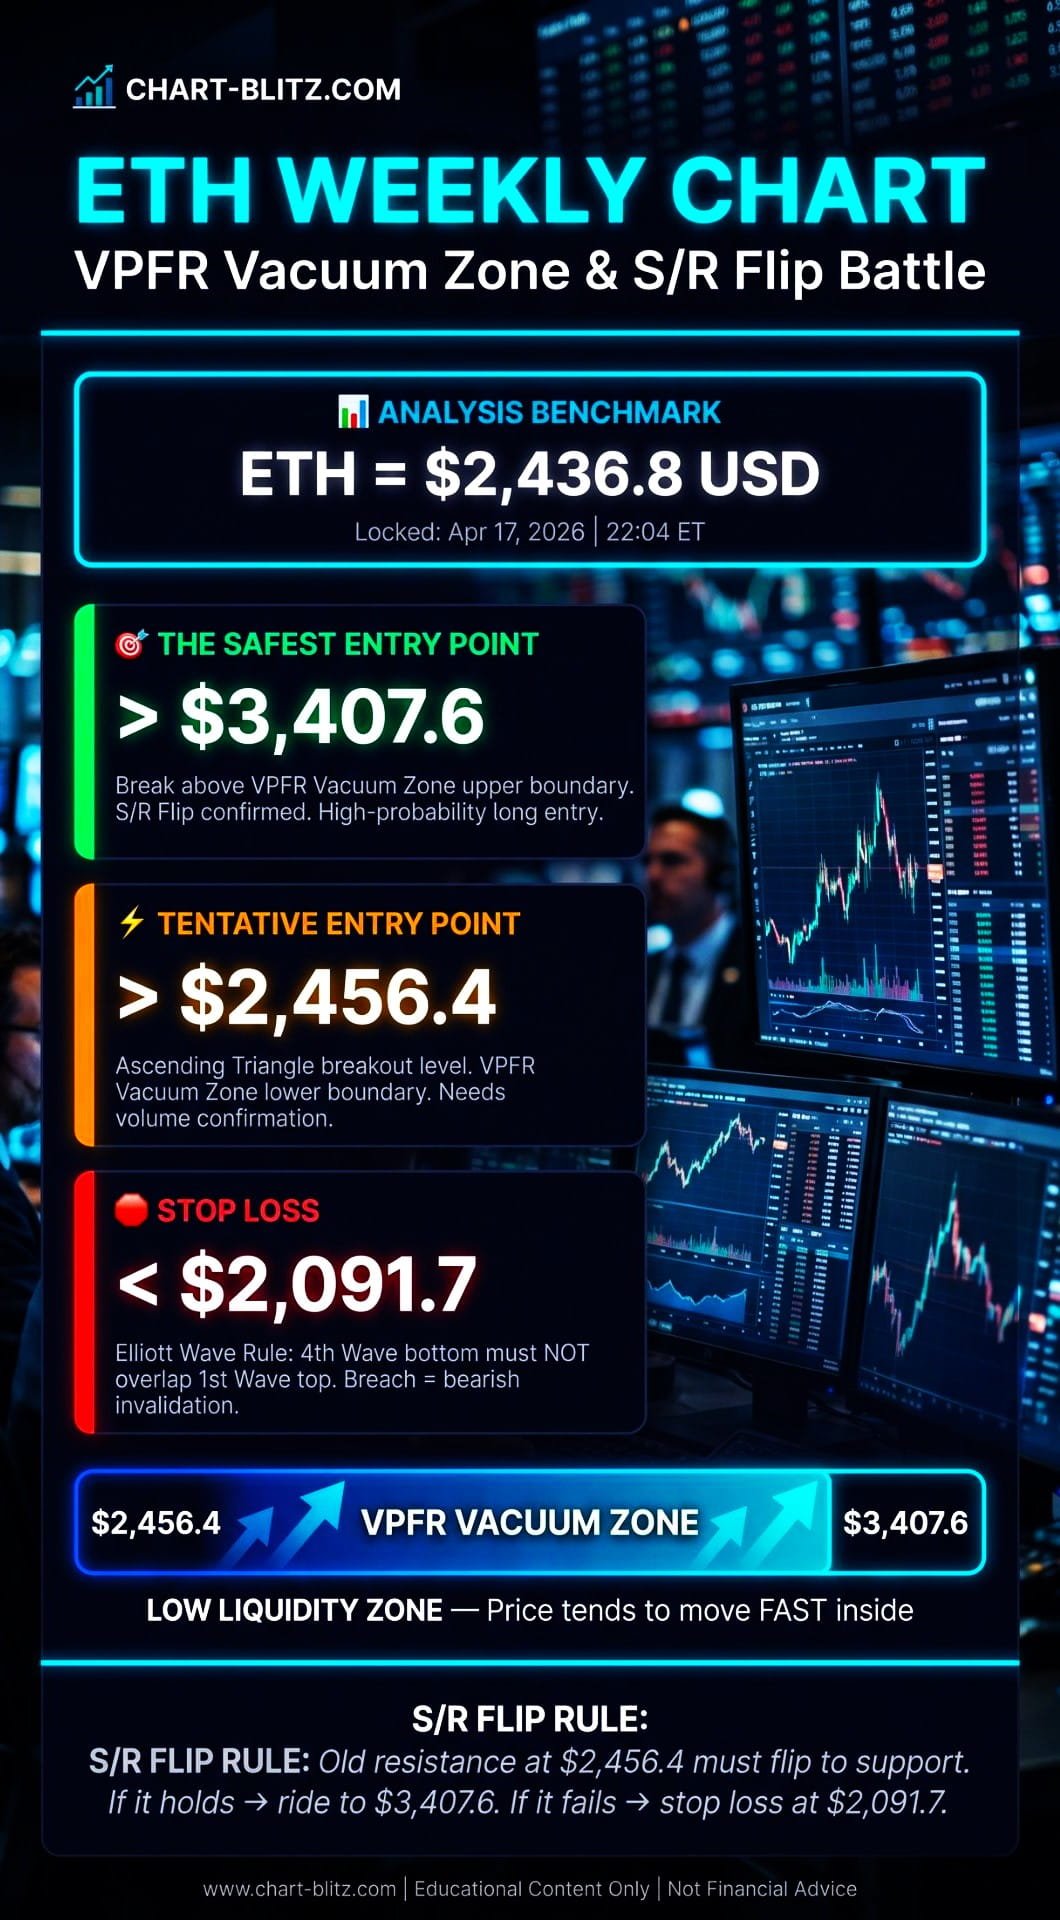
📈 Weekly Chart: The VPFR “Vacuum Zone” and the Critical S/R Flip Battle
When analyzing any asset, the “Weekly Chart” must be the absolute core. On macro timeframes, institutional footprints cannot hide.
Weekly Timeframe for ETH (Ethereum)
First, let’s revisit the recent news regarding Ethereum spot ETF inflows. Headlines tout continuous inflows led by BlackRock’s ETHA for six consecutive days, but why is ETH’s price still hovering around $2,400, barely breaking out compared to the same period in 2021 (five years ago)? The answer lies in the chart.
On our Weekly Chart, the most striking feature is the Volume Profile Fixed Range (VPFR) indicator on the left. VPFR is a highly forward-looking tool; it doesn’t just tell us where trading occurred, but more importantly, where it didn’t. The design principle of VPFR is to display the trading volume for a fixed time range horizontally by price level, forming a “volume distribution map.” The price level with the highest concentration of volume is called the POC (Point of Control), which represents the strongest support/resistance; areas with sparse volume are what we call “Vacuum Zones.”
You can clearly see a distinct “Vacuum Zone” between 2,456.4 USD and 3,407.6 USD on the VPFR. In the trading room, we call these low-liquidity areas. Once the price breaks resistance and enters this zone, it typically surges rapidly due to the lack of historical trading resistance—like a rocket entering the vacuum of space with no friction. Conversely, if support breaks, a sheer drop can occur due to a lack of buyers.
Currently, the ETH price is at a highly critical crossroads. The chart clearly marks several core price levels:
| Price Level | Description | Significance |
| > 3,407.6 USD | The Safest Entry Point | Break above Vacuum Zone top, trend confirmed |
| > 2,456.4 USD | Tentative Entry Point | Break above Vacuum Zone bottom, S/R Flip triggered |
| 2,436.8 USD | Current Locked Price | Analysis Benchmark |
| < 2,091.7 USD | Stop Loss | Break below this level, bearish logic confirmed |
Notice the red Ascending Triangle structure drawn on the chart. ETH recently found strong support near 2,091.7 USD (a Higher Low following the Swing Low at 1,755.5 USD) and is now challenging the crucial 2,456.4 USD resistance. An Ascending Triangle is a bullish consolidation pattern that typically signals an upward breakout.
This is where the Support/Resistance (S/R) Flip Rule comes into play. Theoretically, if ETH can break through 2,456.4 USD (Tentative Entry Point) with volume and successfully hold it (Resistance flipped to Support), there is a massive probability it will ride the momentum to fill the “Vacuum Zone” above, aiming straight for 3,407.6 USD. However, if this assault fails and it drops below the 2,091.7 USD Stop Loss again, the downside space opens up, potentially triggering a deeper correction.
Theoretically, the ETH downtrend should not be over yet, but if the ETH price does not continue to fall but instead turns upwards and explodes, it needs to be seen whether it can rise to the resistance zone. If it breaks above and holds, then enter the market; otherwise, it will reach the stop loss and sell off.
Simultaneously, the MACD (Moving Average Convergence Divergence) indicator below the weekly chart shows that although the histogram is still below the zero line, the red bars are continuously shortening, and the MACD Line and Signal Line are narrowing, hinting at a potential golden cross. The MACD is a momentum indicator; a golden cross (fast line crossing above the slow line from below) is typically an early potential reversal signal, but it requires a price breakout above 2,456.4 USD for confirmation.
Retail vs. Institutional Information Asymmetry: Retail investors see ETF inflows and think “institutions are buying, just follow them.” But in the trading room, we know institutional moves are often multi-layered—they can simultaneously accumulate through ETF channels while creating false breakouts in the spot market to lure retail investors into chasing highs, then distribute heavily. The VPFR Vacuum Zone on the weekly chart is precisely the ideal location for institutions to “rapidly pump and dump.”.
📊 Daily Chart Validation: The Death Cross of Fibonacci and Moving Averages
Zooming in from the macro view, we look at the Daily Chart. The recent news of the successful Pectra upgrade certainly brought short-term excitement to the market, but the daily structure tells us the battle is far from over.
Daily Timeframe for ETH (Ethereum)
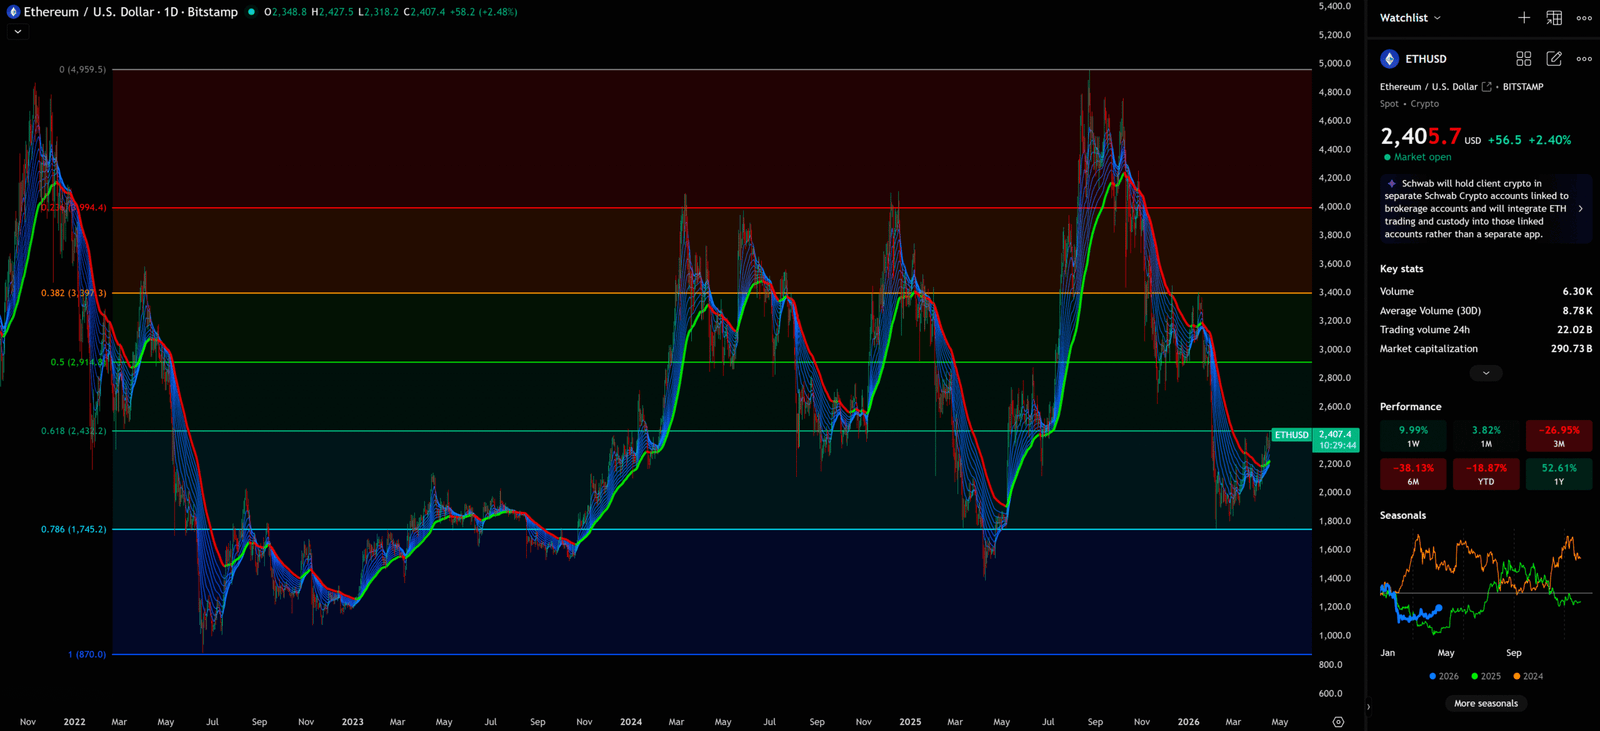
On the Daily Chart, we applied the Fibonacci Retracement indicator, drawn from the 2021/2022 historical high (4,959.5 USD) to the recent low (870 USD). Fibonacci is a magical tool based on nature’s golden ratio. Its design principle uses a series of special ratios (0.236, 0.382, 0.5, 0.618, 0.786) to predict potential resistance and support levels during price pullbacks or bounces. These ratios were discovered by the famous mathematician Leonardo Fibonacci and are widely found in nature, architecture, and financial markets.
The chart reveals that ETH is currently capped by the 0.618 Fibonacci Retracement level (approx. 2,432.2 USD). The 0.618 is known as the “Golden Pocket” and is the most critical line of defense/offense. This level is where institutions most commonly choose to enter or exit, as it represents the “golden ratio point” of a trend. The current ETH price (2,436.8 USD) is struggling right around this level, indicating fierce battles between bulls and bears.
More importantly, look at the EMA Ribbon in the chart. The EMA Ribbon visually displays the direction and strength of a trend through multiple EMA lines of varying periods (e.g., 8, 14, 20, 26, 32, 38, 44, 50, 60-day EMAs). When multiple EMA lines are arranged from top to bottom (short-period on top, long-period on bottom), it indicates a strong uptrend; the opposite indicates a downtrend; when the lines are tangled together, the market is consolidating. Currently, the EMA Ribbon is tangled but showing signs of fanning upwards, with the price sitting above the Ribbon—a preliminary bullish signal.
If ETH confirms a breakout and holds above the 0.618 level (2,432.2 USD), the next targets will be the 0.5 Fibo level (2,914.8 USD) and the 0.382 Fibo level (3,397.3 USD). These two levels also align closely with the Weekly Chart’s Tentative Entry and Safest Entry levels, demonstrating strong indicator confluence! Conversely, if it faces rejection and falls, the 0.786 Fibo level (1,745.2 USD) below will act as the last line of defense
📅 Monthly Chart: The Time Geometry of Gann Fan and the Smooth River of Keltner Channels
News hype usually only lasts a few days, but long-term trends take months or even years to develop. On the Monthly Chart, we see a much grander picture. While market sentiment is currently driven by ETF inflows, macro-level institutional whales are looking at a deeper geometric relationship between time and price.
Monthly Timeframe for ETH (Ethereum)
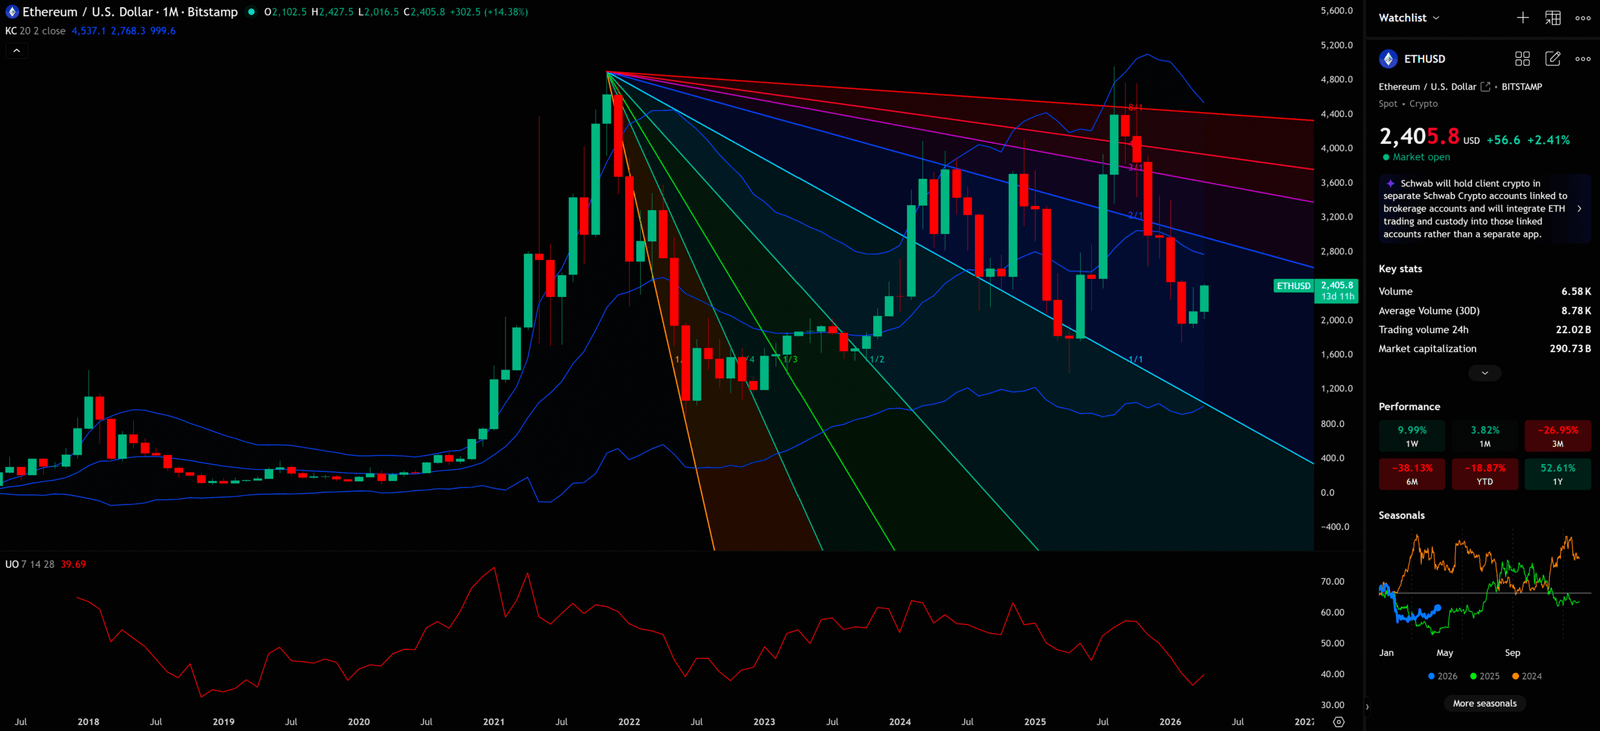
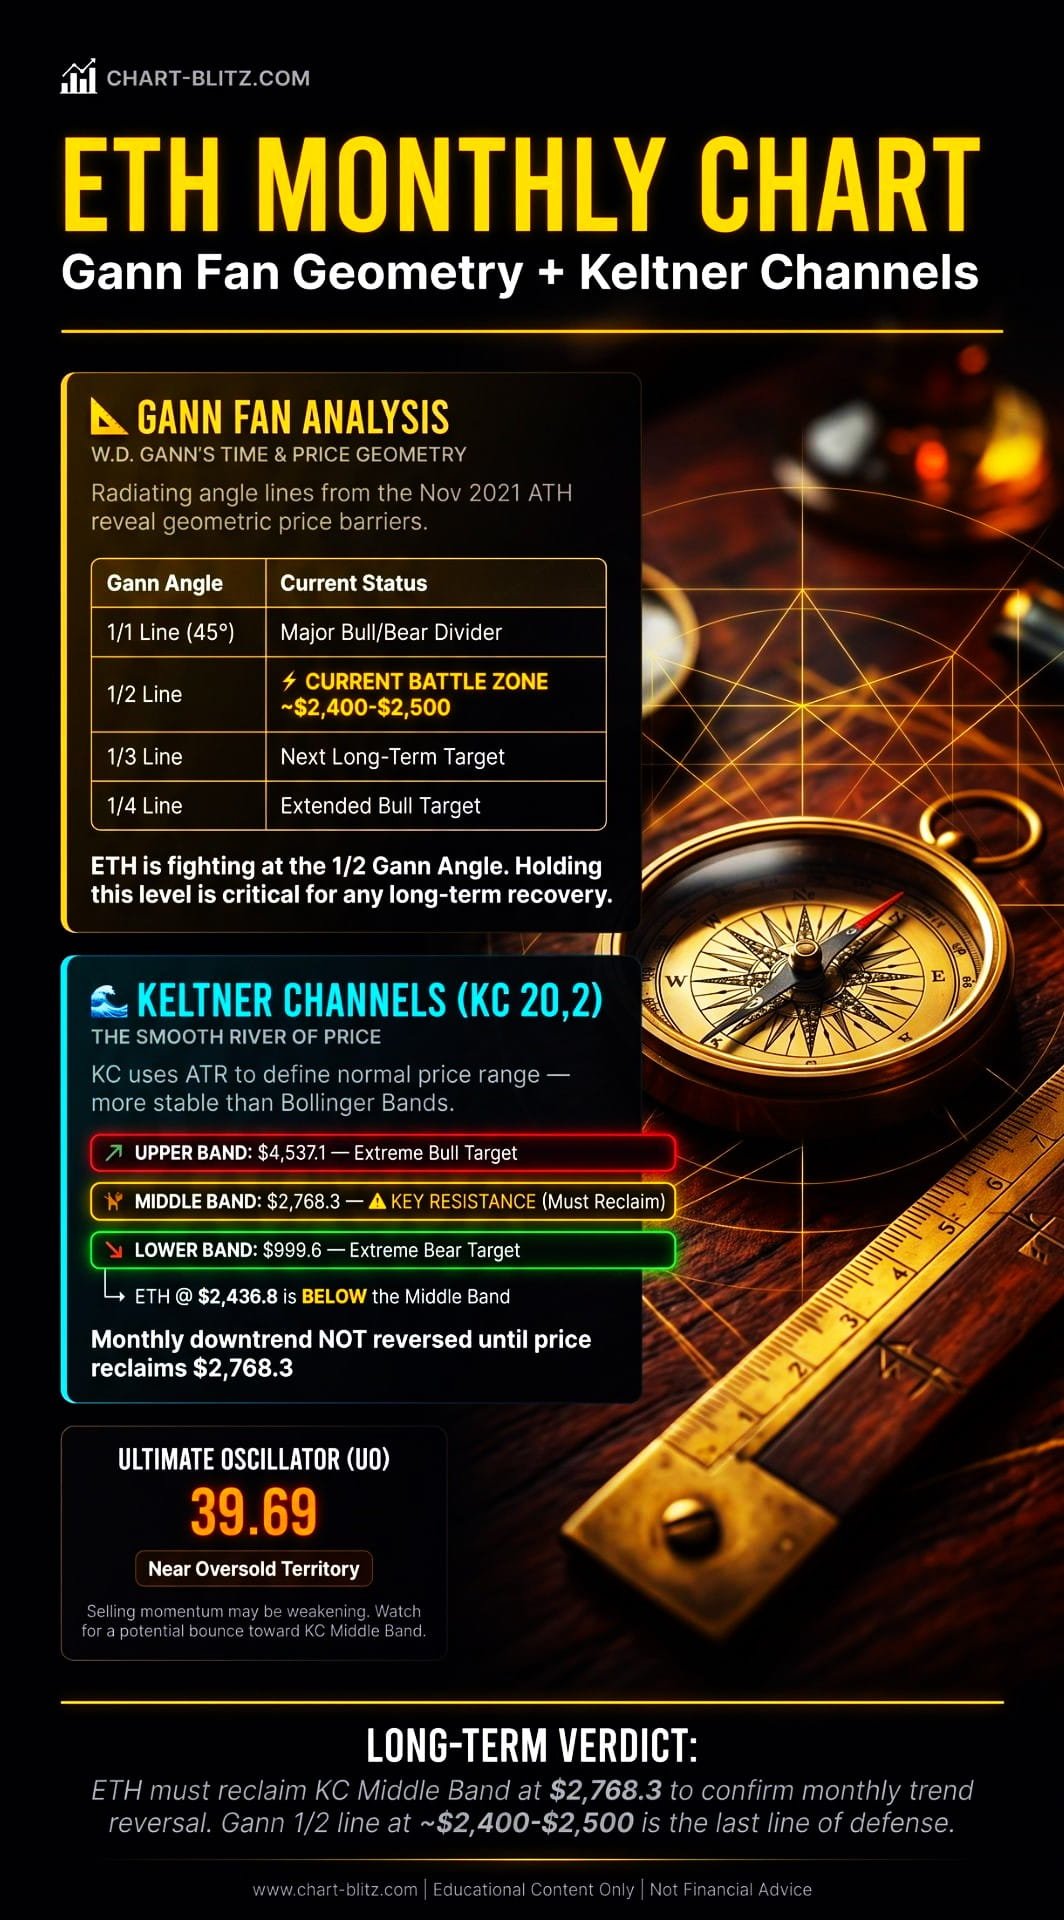
The first thing that catches the eye on this chart are the multiple colored radiating lines extending from the November 2021 all-time high—this is the Gann Fan, invented by legendary trader W.D. Gann. Gann theory posits that market movements are governed by specific geometric angles, with the 1×1 angle (a 1:1 ratio of time and price) being the most critical bull/bear dividing line. The chart shows that the ETH price is currently engaged in a fierce struggle near the 1/2 angle line (around the 2,400 – 2,500 USD zone). If it can hold above the 1/2 line, the next long-term target will be challenging the steeper 1/3 or even 1/4 angle lines above.
Simultaneously, to filter out extreme volatility noise on the monthly timeframe, we have introduced Keltner Channels (KC). Compared to Bollinger Bands, which are easily expanded by extreme outliers, KC uses ATR (Average True Range) to construct its upper and lower bands, acting like a “smooth river” that more accurately defines the normal range of price fluctuation. The top left corner shows the KC parameters as (20, 2), with the current upper band at 4,537.1 USD, the middle band at 2,768.3 USD, and the lower band at 999.6 USD.
The current ETH price (2,436.8 USD) remains below the KC middle band (2,768.3 USD). From a traditional trading room perspective, as long as the price fails to forcefully reclaim and hold above the KC middle band, the monthly downtrend is not completely reversed. This middle band will act as the most significant long-term resistance for ETH in the coming months. Combined with the Ultimate Oscillator (UO) below showing a value of 39.69—hovering near the oversold territory—it suggests that while long-term pressure exists, the downward momentum might be waning, potentially brewing a strong counter-attack towards the KC middle band.
⏱️ 4-Hour Chart: The Awakening Alligator and OBV Money Flow Confirmation
Finally, let’s look at the 4-Hour Chart to catch short-term trading opportunities. Short-term news, like single-day ETF inflows, often triggers violent volatility on the 4-hour timeframe.
4-Hour Timeframe for ETH (Ethereum)
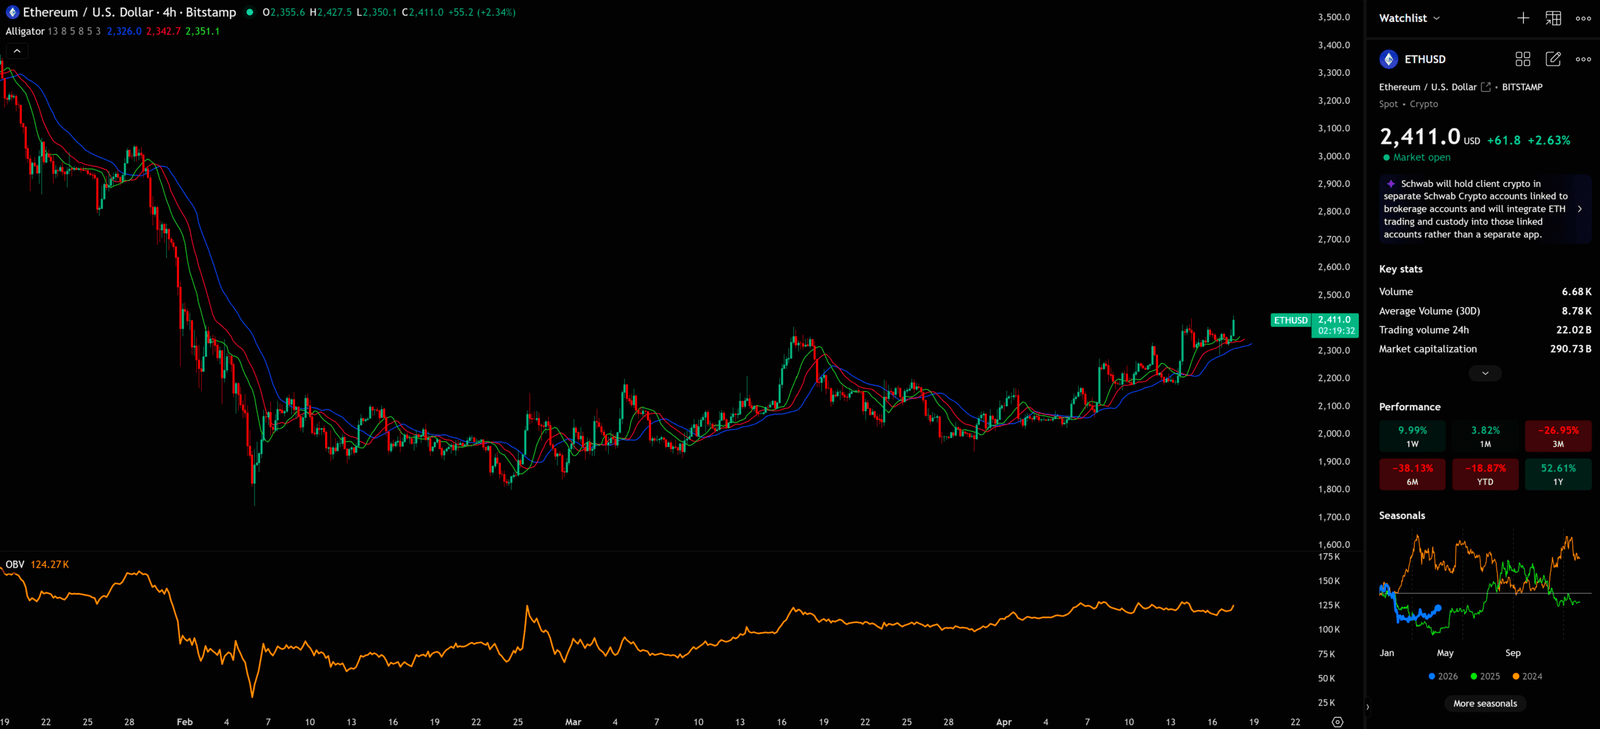
Here, we use the Alligator indicator. The Alligator was developed by renowned technical analyst Bill Williams and consists of three smoothed moving averages: the Jaw (13-period SMMA shifted 8 bars, blue line), the Teeth (8-period SMMA shifted 5 bars, red line), and the Lips (5-period SMMA shifted 3 bars, green line). When the three lines are intertwined, the alligator is “sleeping” (market consolidation); when the lines open up, the alligator is “awake” and “hunting” (trend formation).
The current 4-hour chart shows the Alligator’s three lines starting to fan open upwards, indicating a short-term uptrend is forming. Meanwhile, the OBV (On-Balance Volume) indicator below is also trending up, showing a value of 124.27K, indicating active buying volume stepping in. OBV is a cumulative volume indicator; when OBV rises along with price, it’s a healthy trend confirmation signal; when OBV rises while price hasn’t followed, it’s a potential bullish divergence, suggesting price may follow OBV upward in the future.
In the short term, as long as the ETH price stays above the Alligator’s “Lips” (green line), the short-term bullish logic remains intact.
💡 Comprehensive Conclusion and Scenario Planning
Synthesizing the analysis across these multiple timeframes, we can draw the following conclusions:
Bullish Scenario: If ETH breaks the Weekly Chart’s Tentative Entry Point (2,456.4 USD) with volume and successfully holds it (S/R Flip), while the Daily Chart confirms a break above the 0.618 Fibo level (2,432.2 USD), it will trigger a strong buy signal. The target points straight to the Weekly Chart’s “Vacuum Zone,” with the first stop at 2,914.8 USD (Daily 0.5 Fibo) and the second at 3,407.6 USD (The Safest Entry Point / Daily 0.382 Fibo).
Bearish Scenario: If ETH is rejected at 2,456.4 USD, breaks below the 4-hour Alligator support, and even falls below the Weekly Chart’s Stop Loss (2,091.7 USD), the entire bounce logic will be invalidated. The Daily 0.786 Fibo level (1,745.2 USD) below will become the next important support; if even this level fails, the larger-scale bearish structure needs to be re-evaluated.
Trading Plan Summary:
| Type | Entry Condition | Target | Stop Loss |
| Aggressive | Break 2,456.4 USD and confirm pullback | 2,914.8 / 3,407.6 USD | < 2,091.7 USD |
| Conservative | Break 3,407.6 USD and confirm S/R Flip | Higher targets | Based on chart at that time |
I will continue to closely monitor the price action of this Crypto. As soon as a critical reversal signal appears on the charts, I will update my analysis and insights right here immediately. Remember to Bookmark this page and come back often to check for the latest updates!
Want to see our full, interactive chart breakdown? If you want to learn how to draw Fibonacci Retracement Ratio yourself, identify S/R Flips, and stop trading blind. Please browse the following『Further Reading』links. Fundamental news tells you what happened. Technical analysis predicts what will happen. To master the professional framework that separates market signal from noise, explore our exclusive models at www.chart-blitz.com.
📚Further Reading:
- Fibonacci Retracement Guide: Nailing the 0.618 Golden Pocket — Finding Golden Support and Resistance Stop drawing Fibonacci lines randomly! An ex-banker teaches you how to combine market psychology to accurately pinpoint key turning points at 0.5 and 0.618.
- Elliott Wave Principles and Iron Rules — How to Accurately Catch the Main Impulse Wave? Why can’t the bottom of Wave 4 overlap with the top of Wave 1? A comprehensive guide on how to use Elliott Wave Theory to map out your trading path.
- Volume Profile (VPFR) Tutorial — The Magic Mirror for Institutional Accumulation and Distribution Want to know why below $60,000 is a “Vacuum Zone”? Learn how to use VPFR to find the market’s true high-volume nodes (POC) and see through institutional positioning.
- S/R Flip Support and Resistance Swap Strategy — S/R Flip is one of the most powerful concepts in technical analysis. This article uses real cases to teach you how to use S/R Flip to capture the highest win-rate trading opportunities.
- MACD Momentum Indicator Momentum First — What Does the MACD Line Crossing Above Zero Mean? Golden Cross & Divergence Signals!
- Gann Fan Masterclass — Deep dive into W.D. Gann’s angle theory to identify the geometric relationship between time and price in the market.
- Parallel Channel Short-Term Game — How to Use Parallel Channels to Find Precise Entry/Exit Points for BTC short-term opportunities.
- Keltner Channels: Finding the Smooth River of the Market and Filtering Fakeouts? — Master KC’s ATR-based construction principles to catch genuine trend breakouts using smooth channels!
- Ultimate Oscillator: The Multi-Timeframe Momentum Secret — Understand how the UO combines three timeframes to filter out false signals.
【Disclaimer】 The content herein is for educational purposes and reflects the author’s personal opinion only; it is not investment advice. All financial investments, including cryptocurrencies, carry significant risk, and you could lose your entire capital. To support this site, this article may contain affiliate links. While we strive for accuracy, we cannot guarantee all information is complete or error-free. Please conduct your own research and be fully responsible for your own investment decisions.