When you make a trade, you should have a clear target of where you expect to get out

William Delbert Gann – 1949

The real question is not whether Bitcoin can eventually recover. The sharper question is this: is the 73K zone a second-chance entry, or is it simply a professionally engineered liquidity pocket where late buyers provide exit liquidity for stronger hands? On the surface, the market is being pulled between panic and reassurance. Yahoo Finance, citing Stocktwits, reported that nearly 930 million USD in crypto positions were liquidated over the previous 24 hours, with roughly 366 million USD coming from Bitcoin-related trades and another 240 million USD from Ethereum. Bitcoin slipped toward the 73,200 USD area, a six-week low, while retail sentiment on Stocktwits fell from bearish to extremely bearish. Yahoo Finance Video added that total liquidations were close to 958.8 million USD across more than 167,000 traders, with about 93% of the wipeout coming from long positions.

That detail matters. When almost all liquidations come from longs, the market is not merely “going down.” It is punishing a crowded belief. The crowded belief was simple: Bitcoin had already fallen enough, therefore it should rebound. This is exactly where a former bank trader’s mindset differs from a retail mindset. Retail traders ask whether the news is bullish or bearish. Professional traders ask where the forced orders are sitting, where stop losses are clustered, and which level would turn hope into liquidation.

Investing News Network reported that Bitcoin’s correction was being driven by a combination of geopolitical tension, high bond yields, ETF outflows, and a rotation of speculative liquidity away from crypto and into equities. Binance’s market summary also pointed to geopolitical stress and ETF outflows as short-term pressure, while still acknowledging that corporate adoption and institutional interest may provide longer-term support. This creates the exact contradiction that makes the current BTC setup so dangerous: the long-term narrative remains attractive, yet the weekly structure has not confirmed a reversal. If the story is so bullish, why can’t price reclaim the key resistance zone? If institutions are aggressively accumulating, why does the chart still show a sequence of lower highs and lower lows?

【📊Analysis Baseline Statement】

All technical analysis below is based on the locked price snapshot at 2026-05-29 02:23 ET / 14:23 GMT+8: BTC = 72,870 USD. Please treat this report as an “analytical map,” not a real-time quote. The benchmark price is derived from a cross-check between Binance’s displayed BTC price of 73,012.08 USD and CoinGecko’s API price of 72,727 USD, then averaged. The result is also very close to the 72,894 USD reference quote shown in the user-provided news visual.

📈Weekly Chart: The Real Battle Is Not 73K; It Is 66,283, 69,111, and 83,035

The weekly chart must remain the core of this analysis. The news talks about liquidations; social media talks about whether 73K is cheap; but the weekly chart shows a more important story. The structure shows a major swing high at 123,886 USD, followed by a swing low at 107,656 USD, then a lower high at 94,094 USD, a lower low at 86,980 USD, another lower high at 82,533 USD, and a later lower low at 66,081 USD. This is not a random pullback. Under Dow Theory, a market that forms lower highs and lower lows has not earned the right to be called bullish again.

Weekly Timeframe for BTC (Bitcoin Coin)
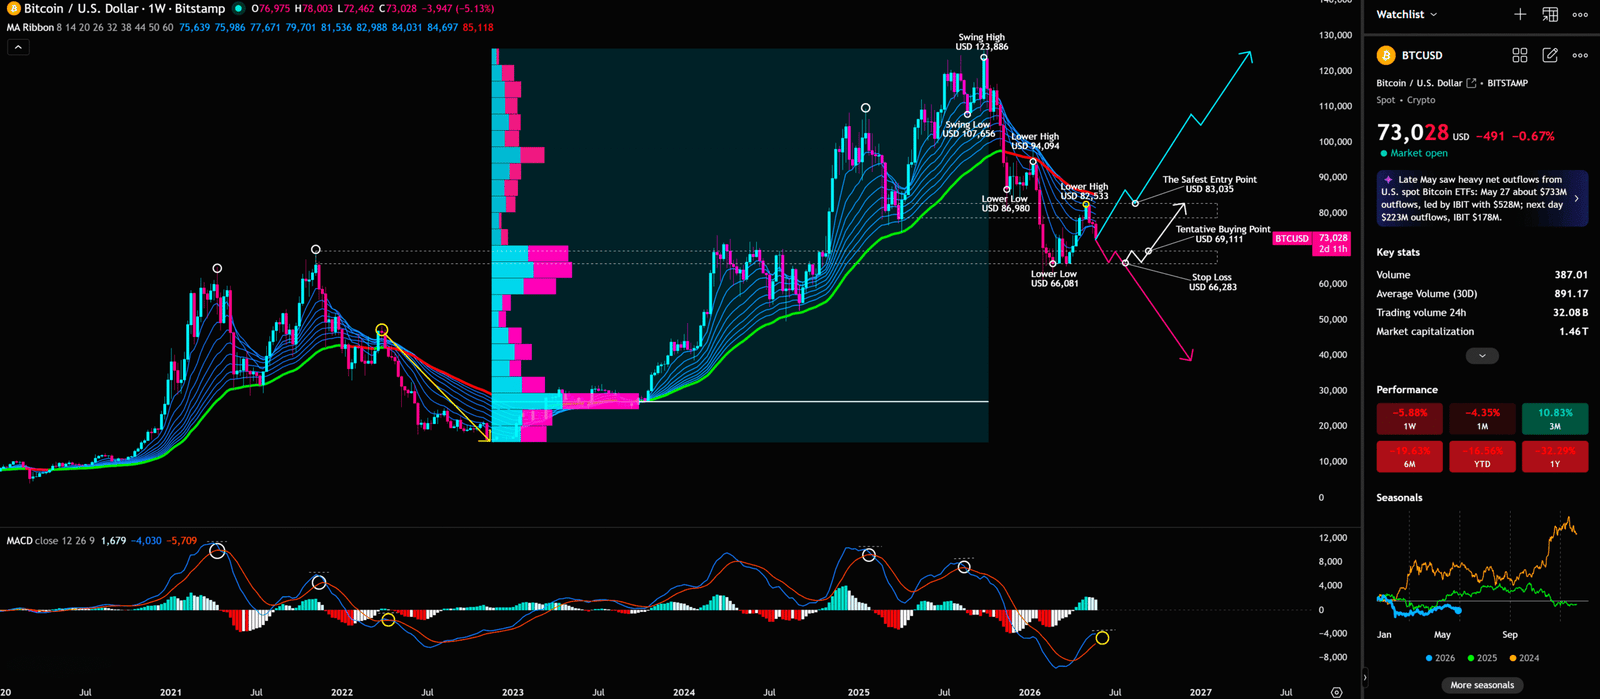
The Chart-Blitz Analyst’s annotations identify three trading levels that should dominate the entire plan. The first is the Tentative Buying Point above 69,111 USD. This level may provide a tactical rebound area, especially because it sits near the lower part of the projected weekly path. The second is the Stop Loss at 66,283 USD, which aligns closely with the marked lower low around 66,081 USD. If that zone fails, the rebound thesis is no longer merely weak; it becomes structurally invalid. The third is the Safest Entry Point above 83,035 USD, which is the most important level from a professional trading standpoint. It sits just above the prior lower high around 82,533 USD. If Bitcoin can break and hold above that area, the market may complete a true support/resistance flip.

This is where a trading-desk analogy helps. On a bank trading floor, an asset is not considered attractive simply because it has dropped a lot. A large decline only tells traders that many previous buyers are under pressure. What matters is whether the market can reclaim the last supply zone. If Bitcoin bounces from 69,111 USD but fails around 82,533 to 83,035 USD, that bounce may simply create a cleaner exit point for trapped buyers. If Bitcoin breaks above 83,035 USD and holds on a weekly closing basis, while the EMA Ribbon flattens and begins to repair, the market would finally present structural evidence rather than emotional hope.

The weekly VPFR is equally important. The fixed-range volume profile appears to show significant participation around the 90,000 to 100,000 USD region and another meaningful activity zone around 60,000 to 70,000 USD. Between major volume nodes, the chart implies thinner participation, which can be described as a volume vacuum zone. This is one of the most misunderstood concepts among retail traders. A low-volume zone is not a safety net. It is a price corridor where the market can move quickly because there are fewer historical transactions to slow it down. In other words, a vacuum zone is not a floor; it is an elevator shaft.

The MACD also needs careful interpretation. The weekly MACD appears to be recovering from deeply negative territory, which suggests that downside momentum may be slowing. But slower downside momentum is not the same as a confirmed bullish reversal. Retail traders often treat a MACD improvement as a green light to buy. Professional traders treat it as an early condition that still requires price confirmation. As long as Bitcoin remains below the 83,035 USD confirmation zone and below the previous lower-high structure, the improved momentum can still be part of a bear-market rebound.

Elliott Wave analysis must be handled with discipline here. It would be irresponsible to simply declare that Bitcoin has completed a fourth wave and is ready for a fifth-wave extension. The iron rule is clear: the bottom of Wave 4 must never overlap the top of Wave 1. If price violates the critical defensive structure, the entire 1-2-3-4-5 bullish impulse assumption may collapse and become part of a larger A-B-C corrective structure instead. That distinction is crucial because retail traders often use wave counting to comfort themselves during drawdowns. Professionals use wave structure to define invalidation, not to justify hope.

Weekly LevelTechnical MeaningPossible Institutional BehaviourCommon Retail Misread
66,283 USDStop-loss and structural invalidation zoneA break may trigger defensive selling and stop-loss liquidityBelieving that a lower price automatically means better value
69,111 USDTentative tactical buying areaSmall test positions may appear, but not necessarily full commitmentTreating the level as an all-in bottom
83,035 USDSafer confirmation and S/R flip zoneInstitutions may add only after resistance turns into supportThinking waiting for confirmation is “too late”
94,094 USDNext major lower-high supply zoneIf 83K is reclaimed, this becomes the next testAssuming a break above 83K means immediate all-time highs

From an S/R Flip perspective, Bitcoin’s downtrend should theoretically not be considered complete yet. However, if BTC refuses to continue lower, then turns upward aggressively and attacks the 82,533 to 83,035 USD resistance zone, the key question becomes whether it can break above and hold. If it can, the market gives a valid entry trigger. If it fails and falls back, or if it loses 66,283 USD, the correct response is not to average down blindly. The correct response is to accept that the setup has failed.


📊Daily Chart: The 0.5 Fibonacci Level at 71,063 USD Is a Psychological Trap Disguised as Support

The daily chart gives the next layer of evidence. The Fibonacci retracement drawn from roughly 15,417 USD to 126,709 USD shows major levels at 100,444 USD for 0.236, 84,195 USD for 0.382, 71,063 USD for 0.5, 57,931 USD for 0.618, and 39,234 USD for 0.786. With the locked price at 72,870 USD, Bitcoin is only modestly above the 0.5 retracement. That may look supportive at first glance, but the more important point is that price remains far below the 0.382 level at 84,195 USD.

Daily Timeframe for BTC (Bitcoin Coin)

This creates a dangerous psychological trap. Retail traders see Bitcoin holding slightly above 71,063 USD and assume that the market has found a floor. A former bank trader asks a different question: if the floor is so strong, why has price not reclaimed 84,195 USD? Why has the daily EMA Ribbon not clearly re-established a bullish structure? Why does the bounce still look more like a reaction from an oversold decline than a confirmed trend reversal?

The 0.5 Fibonacci level is not magic. It is a midpoint, and midpoints attract tactical buyers because they look “fair.” But fair value is not the same as confirmed demand. In trading-desk terms, one large buy order is not enough. What matters is whether follow-through appears after that order. If Bitcoin bounces from 71,063 USD but fails near 84,195 USD, the bounce may simply give stronger hands a better price to sell into. If Bitcoin loses 71,063 USD on a daily closing basis, the next major Fibonacci reference becomes 57,931 USD, which would align with the broader weekly liquidity region around 60K to 70K.

A constructive daily setup would require Bitcoin to stabilize around 69,111 to 71,063 USD and then reclaim 84,195 USD with convincing structure. That would also overlap with the weekly 83,035 USD S/R Flip level. This is the kind of multi-timeframe confluence that deserves attention. The point is not to catch the exact bottom. The point is to wait until two separate timeframes agree that the bottom may be real.

📅Monthly Chart: Long-Term Story Still Exists, But KDJ Recovery Is Not a Bull-Market Confirmation

The monthly chart needs a broader narrative. Bitcoin still benefits from long-term institutional themes, including custody infrastructure, corporate adoption, and the continuing maturation of crypto as an asset class. Binance’s market commentary also acknowledged that institutional interest and corporate adoption may provide long-term support.1 But the monthly chart reminds us that a strong long-term story does not erase the need for price structure.

Monthly Timeframe for BTC (Bitcoin Coin)

The monthly chart shows Bollinger Bands using a 20-period SMA close, with Bitcoin rebounding around the 73K area after a sharp decline from higher levels. Price does not appear to be in a clean upper-band expansion phase anymore. Instead, it is in a repricing phase around the middle part of the broader band structure. The lower panel shows a KDJ/Stochastic-style indicator with approximate readings around 22 / 29 / 8, indicating that momentum is recovering from a depressed zone but has not yet produced a complete long-term reversal confirmation.

Bollinger Bands measure volatility around a moving average. When price rides the upper band, the market is usually in a powerful trend. When price falls back toward the middle band, the market is often reassessing value. Bitcoin is not necessarily in a long-term breakdown, but it is also not in a clean monthly expansion phase. This is exactly the type of environment where investors confuse a long-term thesis with a short-term entry signal.

KDJ recovery from low levels is constructive, but it is not enough. Oscillators can remain depressed or whipsaw during major trend transitions. A low KDJ reading can warn traders not to chase shorts aggressively into exhaustion, but it does not automatically justify heavy long exposure. For younger investors with limited capital, this distinction is critical. The most dangerous moment is not always when everyone is panicking. Sometimes it is when everyone believes the worst is over while the higher-timeframe chart has not confirmed that belief.

⏱️4-Hour Chart: Until the Descending Channel Breaks, the Bounce Is Still Noise Inside a Weak Structure

The 4-hour chart captures the emotional part of the market. Most liquidations came from longs, which means short-term traders were leaning into a rebound too early.4 The user’s 4-hour chart shows a clear descending parallel channel, with red and blue zones marking the internal structure of the decline. The Alligator indicator readings are approximately 74,607 / 71,991 / 71,554, while price is near the 72,993 to 73,000 USD area. Crucially, price has not decisively broken above the upper boundary of the descending channel.

4-Hour Timeframe for BTC (Bitcoin Coin)

The Alligator indicator uses smoothed moving averages to identify whether the market is sleeping, awakening, or trending. When the lines are tangled, the market is often consolidating. When they open downward and price remains under pressure, short-term structure is weak. When price reclaims key moving averages and breaks above the descending channel, then the market begins to show tactical strength. Right now, the 4-hour chart looks more like a bounce inside a bearish channel than a confirmed reversal.

This has practical trading implications. If Bitcoin cannot first break the 4-hour descending channel, any buy attempt around 69,111 USD should be treated as high-risk and tactical. If it breaks the channel but fails to reclaim 84,195 USD on the daily chart, it is still only a rebound. Only when the 4-hour channel breaks, the daily chart reclaims the 84,195 USD zone, and the weekly chart holds above 83,035 USD does the setup become a genuine multi-timeframe confirmation.

Retail vs Institutions: Same 73K Price, Two Completely Different Markets

Retail traders look at 73K and see a discount from the highs. Institutions look at 73K and see liquidation residue, trapped positioning, stop-loss clusters, and the next zone where liquidity can be harvested. Retail asks, “Will I miss the move if I wait?” Institutions ask, “If this trade is wrong, where exactly is the proof?” That is the information gap.

On a professional trading desk, the most valuable part of a trade is not the opinion. It is the invalidation point. A correct directional view without risk control can still destroy a leveraged account. A less certain view with precise invalidation can survive long enough to capture the right move. Bitcoin’s current map is unusually clear: 69,111 USD is the tentative test; 66,283 USD is the stop-loss and invalidation zone; 83,035 USD is the structural confirmation point. Retail traders remember the first number because it feels exciting. Professionals remember all three because a trade without an exit is not a strategy.

Integrated Trading Plan: Do Not Guess the Bottom; Force the Market to Prove It

ScenarioTriggerTarget ZoneInvalidationStrategic Meaning
Bullish Scenario: S/R Flip succeedsBTC holds the 66,283 to 69,111 USD zone, then reclaims and holds above 83,035 USD on the weekly structureFirst target 84,195 USD, second target 94,094 USD, extension toward 100,444 USDFalls back below 83,035 USD with weak retestTactical rebound becomes structural repair; staged entries become more defensible
Bearish Scenario: rebound failsBTC fails near 82,533 to 83,035 USD, or breaks below 66,283 USDFirst watch the 60K-70K VPFR liquidity zone; deeper reference 57,931 USDRapid reclaim and hold above 83,035 USDBounce becomes distribution; avoid catching the falling knife
Range Scenario: grinding basePrice rotates between 69,111 and 84,195 USDRange-trading conditions; no chasingBreakout from either side with volumeWait for daily and weekly alignment before directional commitment

The most rational plan is to treat 69,111 USD as a tentative tactical zone, not the safest entry point. The safer confirmation remains above 83,035 USD because that is where prior resistance has a chance to become support. This does not guarantee profit. Nothing does. But it means the market has finally given structural evidence. Conversely, if Bitcoin breaks below 66,283 USD, traders must admit that the rebound thesis has failed. At that point, the market is not merely cheaper; it is structurally damaged.

💡 Conclusion: Bitcoin’s Problem Is Not That It Fell to 73K; It Is That It Has Not Yet Proven It Can Hold Above 83K

The most important conclusion is that 73K is not the answer. It is the middle of the question. News can explain the liquidation event. KOLs can calm the market. Macro narratives can provide background. But the trading decision must come from structure: the weekly chart still shows lower highs and lower lows; the daily chart still trades below the 84,195 USD Fibonacci resistance; the monthly chart is still repricing; and the 4-hour chart remains trapped inside a descending channel.

The final judgment is direct: as long as 66,283 USD holds, Bitcoin still has room to attempt a rebound; but until 83,035 USD is reclaimed and held on the weekly structure, every rebound should be treated as high-risk, not as confirmed bull-market continuation. Professional trading is not about buying the exact low before everyone else. It is about waiting for the market to expose the impatient crowd, then entering only when structure improves the odds.

I will continue to closely monitor the price action of this Crypto. As soon as a critical reversal signal appears on the charts, I will update my analysis and insights right here immediately. Remember to Bookmark this page and come back often to check for the latest updates!

Want to see our full, interactive chart breakdown? If you want to learn how to draw weekly VPFR, Fibonacci, EMA Ribbon, MACD, Supertrend, and S/R Flip frameworks designed for real trading decisions. Please browse the following『Further Reading』links. Fundamental news tells you what happened. Technical analysis predicts what will happen. To master the professional framework that separates market signal from noise, explore our exclusive models at www.chart-blitz.com.

📚Further Reading:

To help everyone gain a deeper understanding of the various technical indicators mentioned in this article, we have specially prepared the following further reading materials. These cover key analytical tools found across the weekly, daily, monthly, and 4-hour charts.

  1. Decoding Fibonacci Retracement: The Perfect Blend of Natural Law and Market Psychology Fibonacci Retracement is not just a set of magical numbers; it is a manifestation of market psychology. Learning how to correctly draw and interpret Fibonacci levels is a required course for every serious trader.
  2. Elliott Wave Theory Practical Manual: Key Rules for Identifying Impulse and Corrective WavesElliott Wave Theory is one of the most complex yet powerful tools in technical analysis. Understanding how to identify impulse and corrective waves, along with the iron rules of Elliott Wave Theory, can help you find direction in the market.
  3. Understanding VPFR: Finding the Hidden Footprints of Market MakersThe Volume Profile Fixed Range (VPFR) is a powerful tool that tells us where the most trading occurred within a specific price range. This helps us identify true support and resistance levels, as well as potential ‘Vacuum Zones’.
  4. S/R Flip Support and Resistance Swap StrategyS/R Flip is one of the most powerful concepts in technical analysis. This article uses real cases to teach you how to use S/R Flip to capture the highest win-rate trading opportunities.
  5. MACD Momentum Indicator Momentum First — What Does the MACD Line Crossing Above Zero Mean? Golden Cross & Divergence Signals!
  6. Gann Fan MasterclassDeep dive into W.D. Gann’s angle theory to identify the geometric relationship between time and price in the market.
  7. EMA Ribbon Practical Guide: Catching Early Trend SignalsThrough the arrangement of multiple exponential moving averages, the EMA Ribbon intuitively displays the strength and changes of market trends. Learning to interpret the convergence and divergence of the EMA Ribbon allows you to spot trading opportunities ahead of others.
  8. Bollinger Band: Long-Term Repricing ZoneThe Ultimate Tool to Capture Massive Market Moves Tired of getting shaken out of winning trades too early? Or buying right before a trend reverses? An ex-banker reveals how to use the Bollinger Band to filter out market noise and ride the big waves.

【Disclaimer】 The content herein is for educational purposes and reflects the author’s personal opinion only; it is not investment advice. All financial investments, including cryptocurrencies, carry significant risk, and you could lose your entire capital. To support this site, this article may contain affiliate links. While we strive for accuracy, we cannot guarantee all information is complete or error-free. Please conduct your own research and be fully responsible for your own investment decisions.

Leave a Reply

Your email address will not be published. Required fields are marked *