Fetching Live Market Data...
When you make a trade, you should have a clear target of where you expect to get out
William Delbert Gann – 1949
Over the past 24 hours, the crypto market’s spotlight has once again fallen on the veteran privacy coin, Zcash (ZEC). Benefiting from the upcoming Ironwood (NU6.3) network upgrade scheduled for late July, ZEC’s price has surged nearly 18% over the past week, breaking through the long-dormant $400 resistance level and currently stabilizing around $471. Market sentiment ignited instantly, with retail investors exclaiming, “The spring of privacy coins is back!”
On the surface, this appears to be a perfect rally driven by a technical upgrade. The Ironwood upgrade aims to address potential vulnerabilities in the earlier Orchard shielded pool, rebuilding market confidence in ZEC’s anti-counterfeiting capabilities. Major media outlets are rushing to report, and KOLs are shouting on social platforms that “ZEC hitting $600 is not a dream.” The entire market is filled with FOMO (Fear Of Missing Out), and countless retail investors are eager to pour their capital into this seemingly surefire opportunity.
However, as a former trader who has navigated traditional bank trading rooms for 20 years, I must warn you: If you only read the news, you might already be half a step behind. News is often just a catalyst for market sentiment, or a “smokescreen” released by smart money in coordination with chart movements. What truly determines price direction is never the headline news, but the capital game structure hidden behind the candlestick charts. While retail investors are still cheering for the Ironwood upgrade, institutional investors had long seen the clues of this eruption through technical charts. In the trading room, we have an old saying: “Buy the rumor, sell the news.” Now, let’s set aside the market noise and return to the truest battlefield—the technical charts—to see exactly where ZEC is heading next.
【📊Analysis Baseline Statement】
All technical analysis below is based on the price snapshot locked on July 8, 2026 (EST 05:00): ZEC = US 471. Please treat this report as an “analysis map” rather than a real-time quote.

📊Weekly Chart: The Life-and-Death Duel of Long-Term Structure
In a bank trading room, we always view the weekly chart as the core of our strategic layout. Daily fluctuations might be noise, but the weekly structure is a trend built with real money.
Weekly Timeframe for ZEC (Zcash)
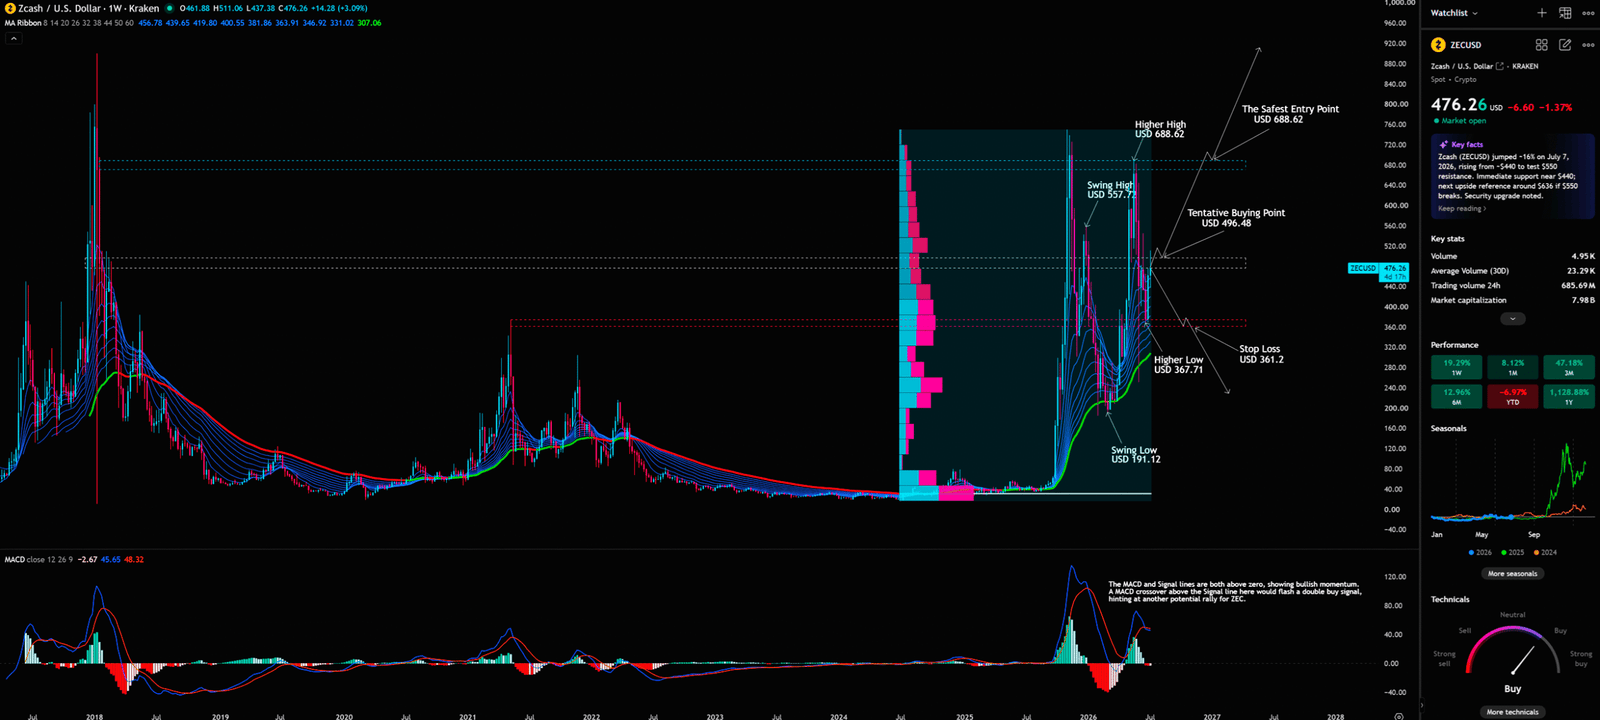
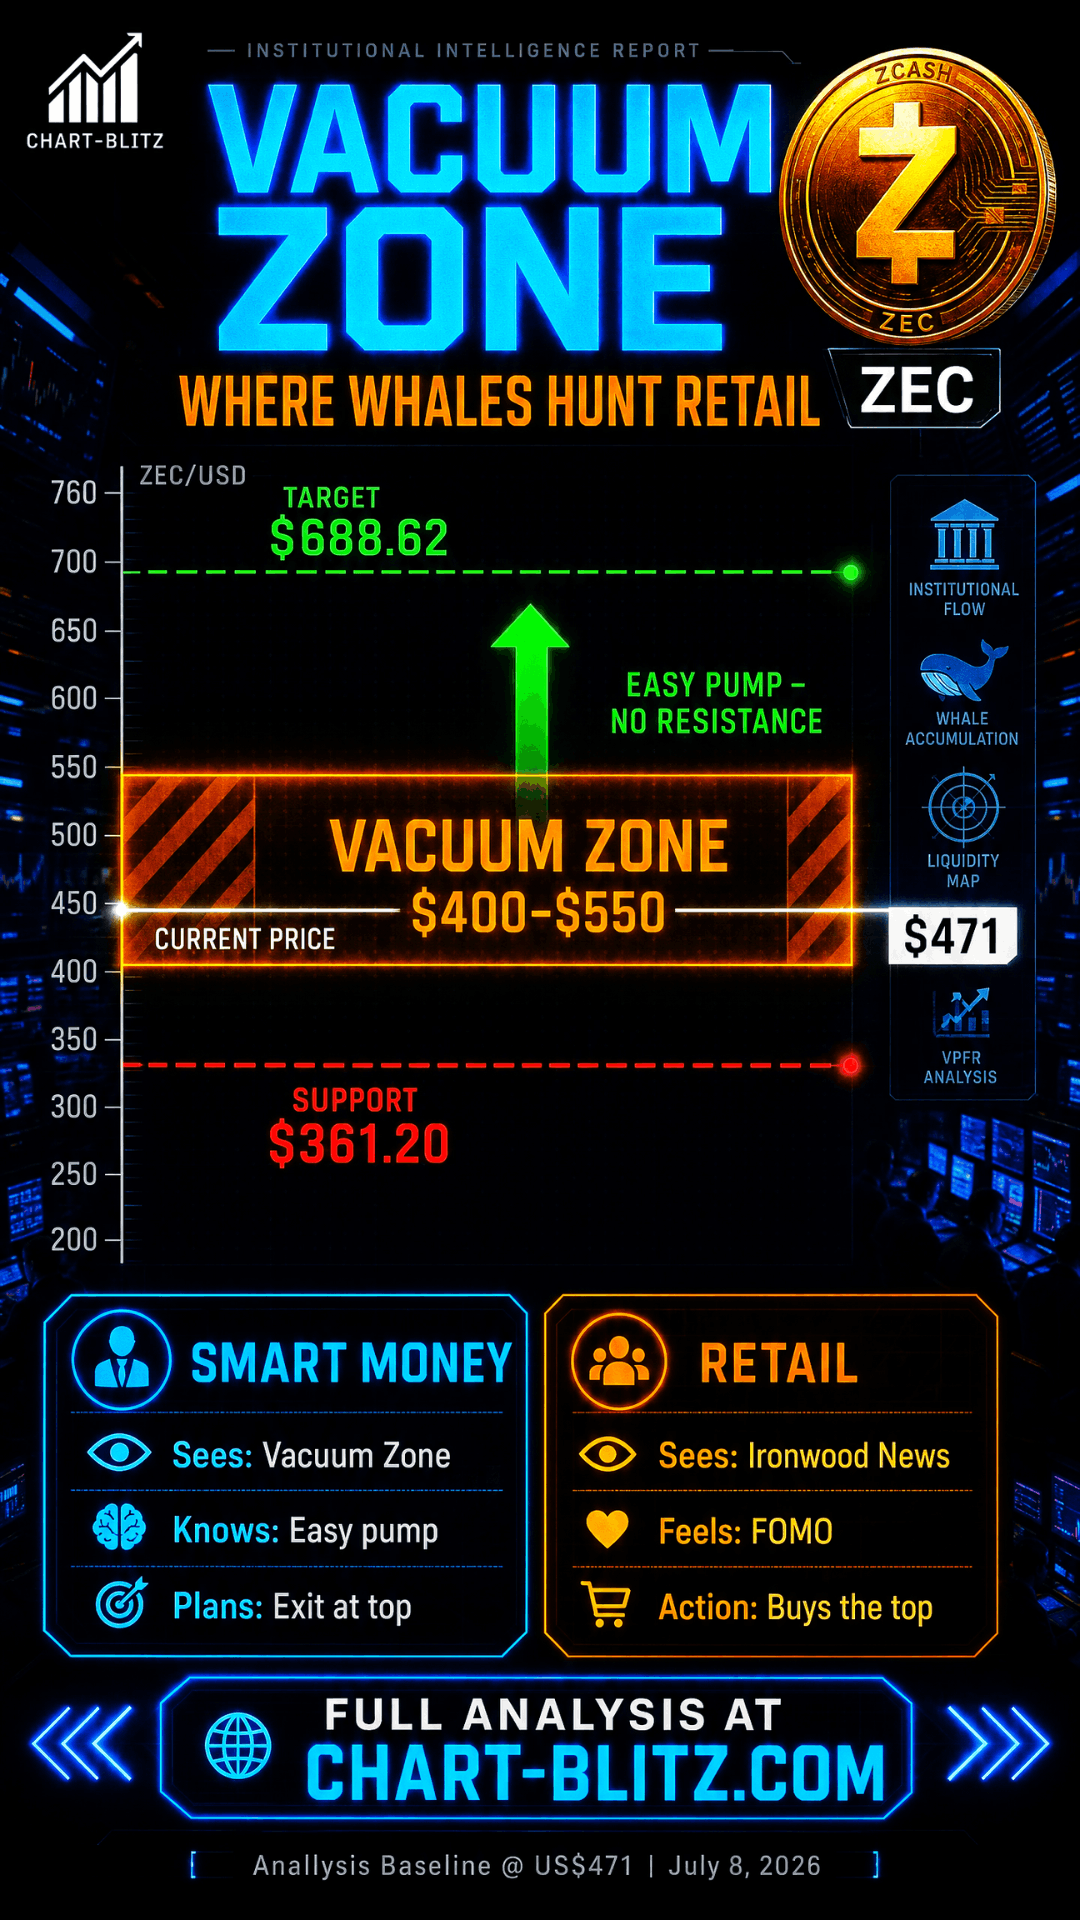
Currently, ZEC’s weekly chart shows that the price is at an extremely critical crossroads. The first thing we need to pay attention to is the Volume Profile Fixed Range (VPFR) indicator. The “past and present” of this indicator can be traced back to the Market Profile in traditional futures markets. Unlike traditional time-based volume displayed at the bottom of the chart, VPFR displays volume across specific price ranges. Its significance lies in revealing the market’s “Point of Control (POC)” and the distribution of liquidity.
From the chart, it’s clear that there is a relative “Vacuum Zone” for ZEC between $400 and $550. This means that within this price range, there has been a lack of strong historical volume support or resistance in the past.
Ex-Banker’s Perspective: When retail investors see bullish news, they often chase the high recklessly. But institutions look at liquidity. When the price enters a vacuum zone, large holders can easily push the price higher with relatively little capital, creating a strong illusion of a breakout. It’s like sliding on ice with no resistance—it’s fast, but also extremely easy to lose control. This is often a trap set by market makers to attract retail investors to take over their positions.
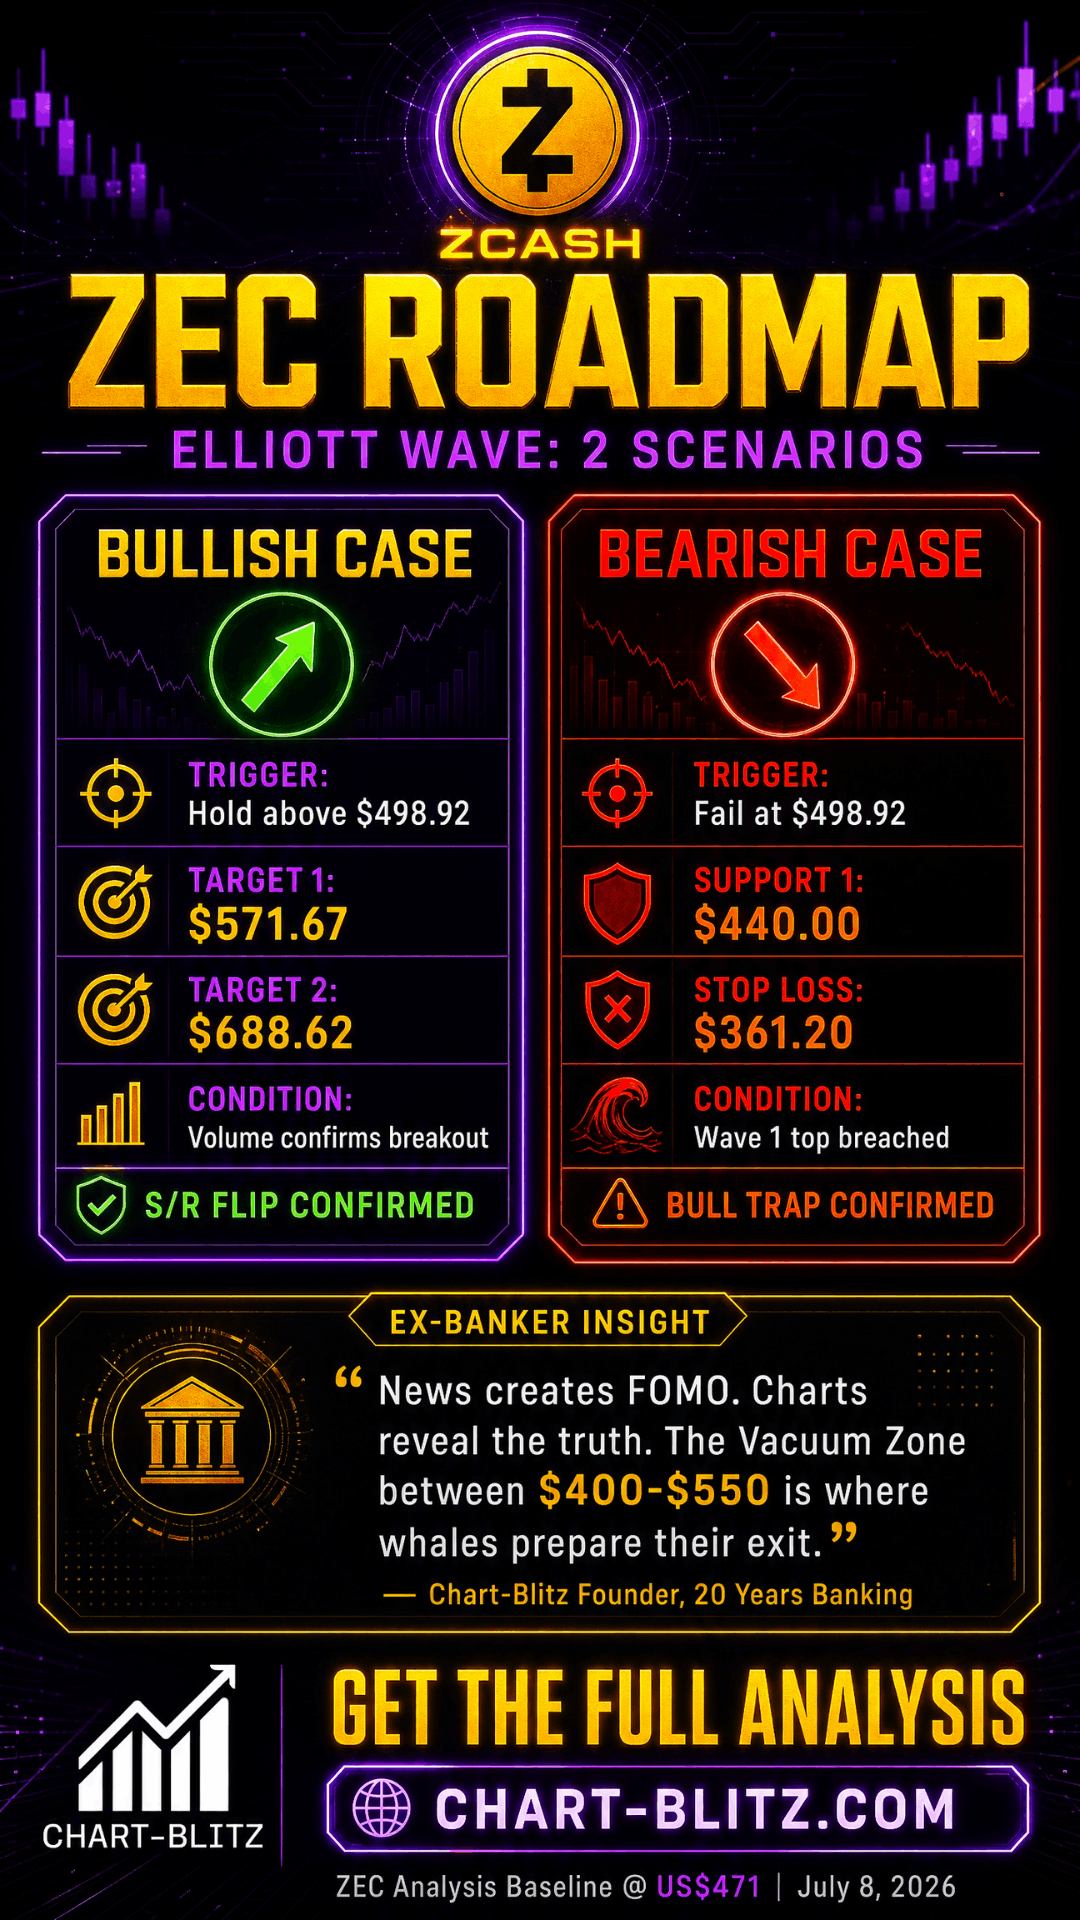
Combining this with the iron rules of Elliott Wave Theory, we must be very cautious. Proposed by Ralph Nelson Elliott in the 1930s, the core idea is that market price movements follow specific wave patterns. The current rebound in ZEC has the potential to be an extension of a larger-degree motive wave. However, we absolutely cannot forget the iron rule of Elliott Wave: “The bottom of Wave 4 must absolutely not overlap with the top of Wave 1.”
If, in the ensuing volatility, ZEC falls below the critical starting point of the previous phase (i.e., the top of Wave 1), then the entire assumption of a 1-2-3-4-5 upward motive wave will be completely shattered. This could mean that the current rise is merely part of a larger-degree corrective wave (A-B-C), what we often call a “dead cat bounce.” It is strictly forbidden to easily determine that a certain downward point is the “bottom of Wave 4” and blindly buy the dip without sufficient confirmation.
Furthermore, the MACD (Moving Average Convergence Divergence) on the weekly chart has shown a clear golden cross, and the histogram has begun to expand above the zero line. Invented by Gerald Appel in the 1970s, MACD is a classic indicator for measuring trend momentum. This is a strong bullish signal for the medium to long term. However, while the EMA Ribbon (Exponential Moving Average Ribbon) shows signs of narrowing and turning upwards, it has not yet formed a perfect “bullish alignment.” This indicates that although long-term bullish forces are recovering, they still need time to consolidate their positions.
☀️ Daily Chart: The Critical Test of S/R Flip
If the weekly chart is the strategic map, then the daily chart is our sandbox for formulating tactics.
Daily Timeframe for ZEC (Zcash)
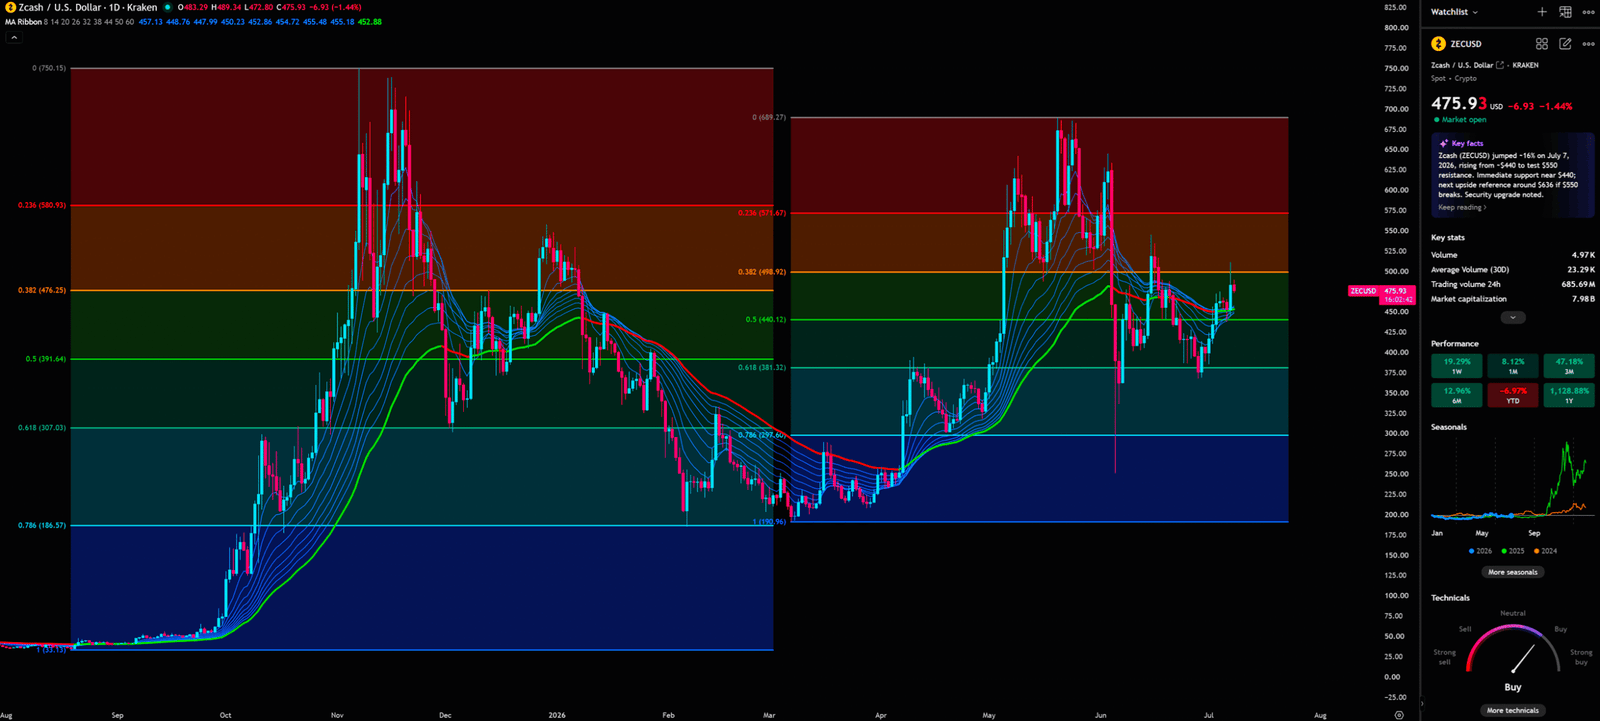
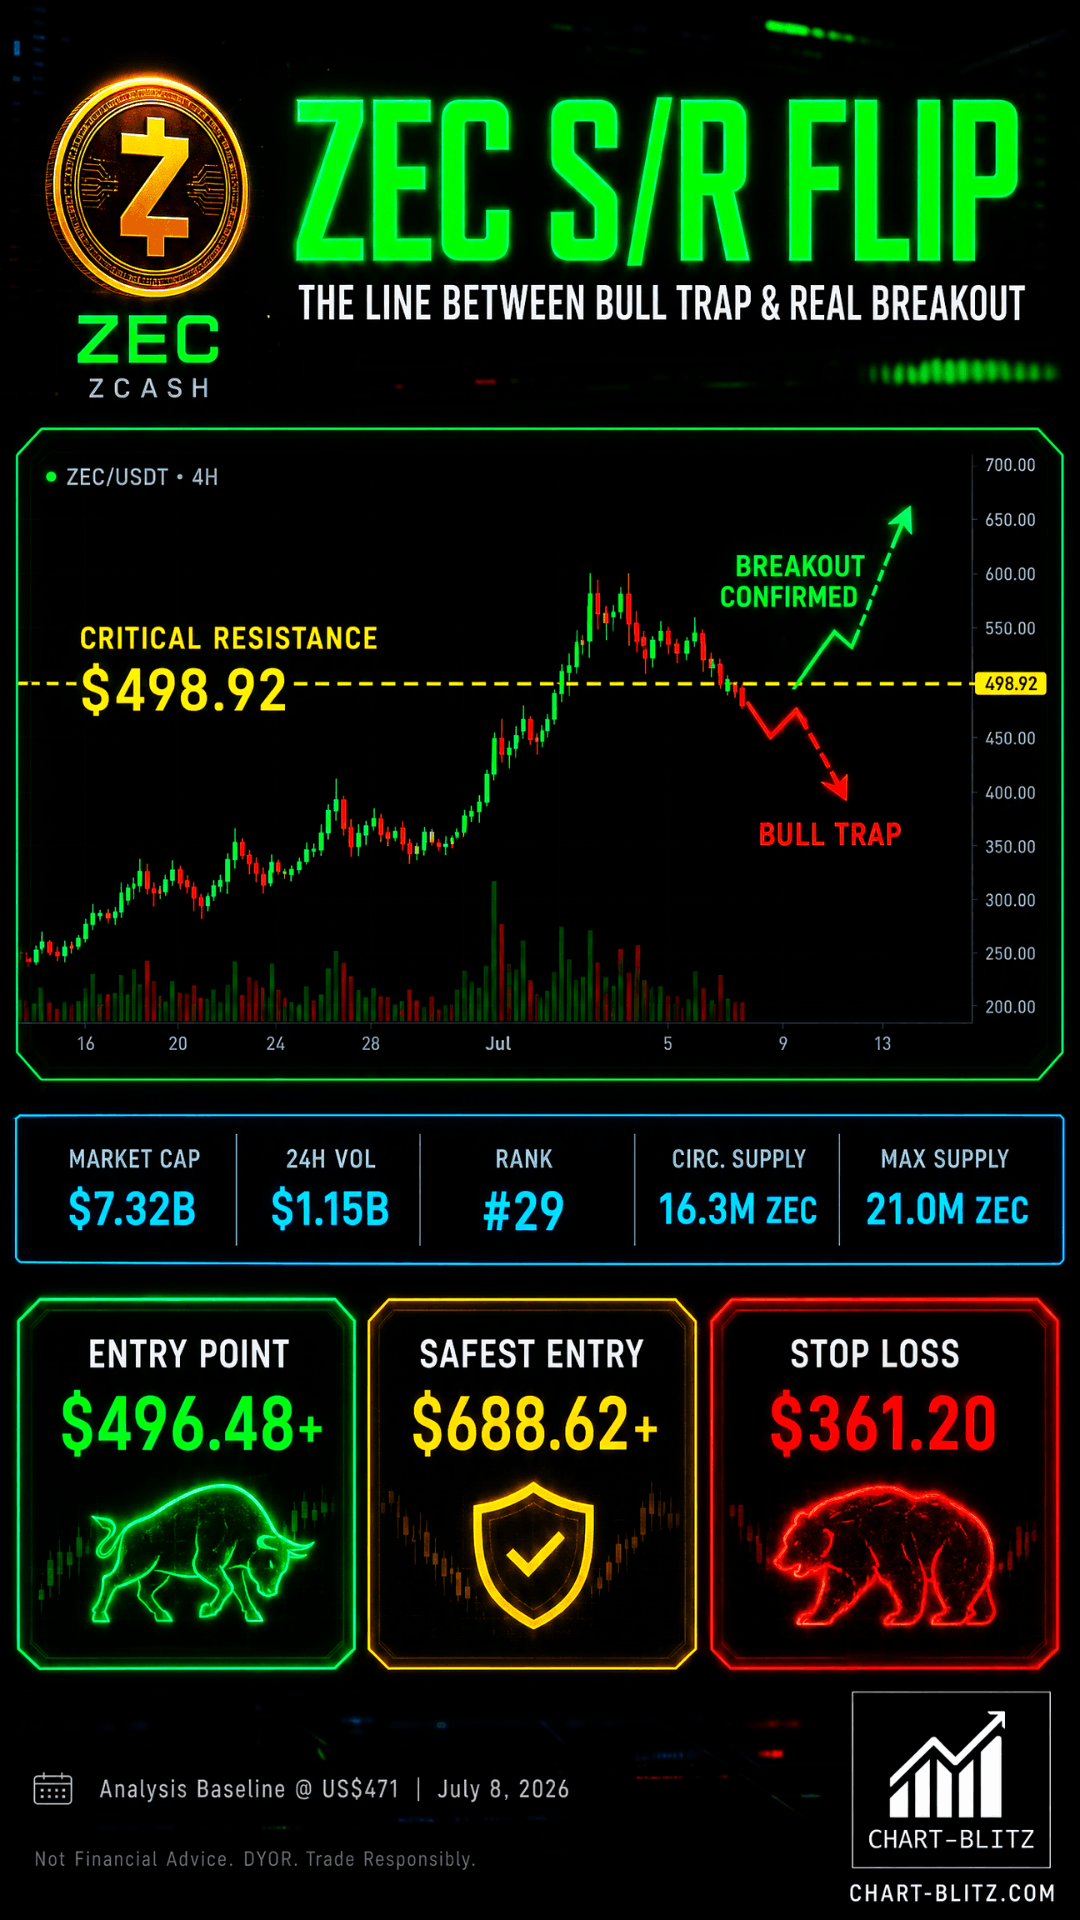
At the daily level, we must focus heavily on the Fibonacci Retracement levels. Originating from the sequence discovered by 13th-century Italian mathematician Leonardo Fibonacci, this indicator is widely used in financial markets to find potential support and resistance levels. ZEC is currently challenging the critical resistance level of 0.382 ($498.92). This is a position of immense strategic significance.
Here, we must introduce the core logic of the S/R Flip (Support and Resistance Interchange). This rule is one of the oldest and most effective principles in technical analysis: once a strong resistance is broken, it becomes a strong future support, and vice versa.
Theoretically, the ZEC downtrend should not be over yet, but if the ZEC price does not continue to fall but instead turns upwards and explodes, it needs to be seen whether it can rise to the resistance zone. If it breaks above and holds, then enter the market; otherwise, it will reach the stop loss and sell off. This is the essence of the S/R Flip.
Retail vs. Institutional Information Gap: When retail investors see a breakout, their first reaction is “FOMO,” and they can’t wait to go all-in. Institutional traders, on the other hand, will patiently wait for a “pullback confirmation.” They know that a true breakout needs to be retested by the market. If it cannot hold after the breakout, then it’s a “Bull Trap,” a snare used to extract retail liquidity.
The EMA Ribbon on the daily chart already presents a clear bullish divergence, which provides strong dynamic support for the short-term upward movement. As long as the price remains above the EMA Ribbon, the short-term bullish logic remains valid.
🌙 Monthly Chart: Resonance of Long-Term Indicators
Zooming out to the monthly chart, we can see the more macroeconomic market rhythm.
Monthly Timeframe for ZEC (Zcash)
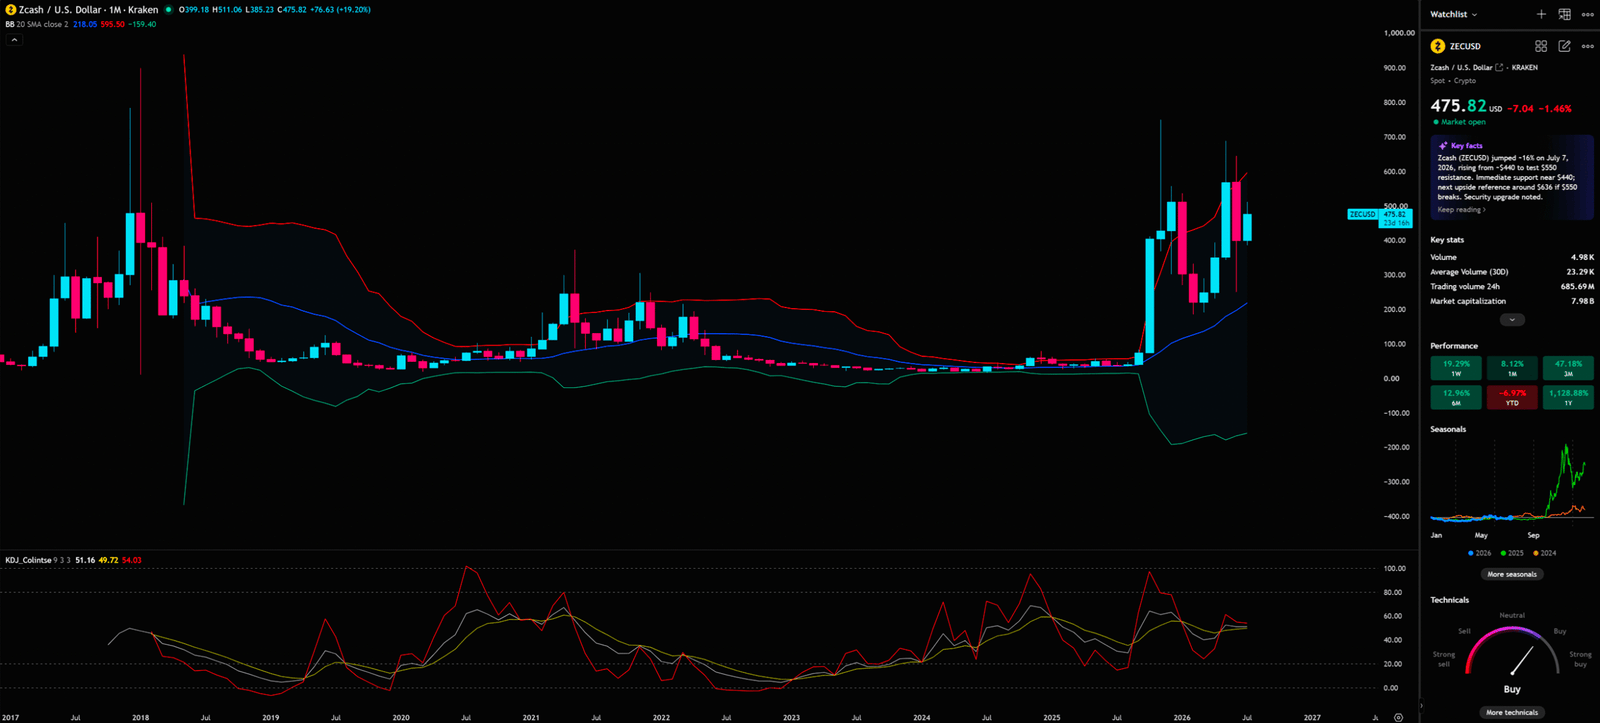
ZEC’s monthly Bollinger Bands show that after a long period of convergence, the price is currently making a strong breakout above the upper band (around $500). Invented by John Bollinger in the 1980s, Bollinger Bands use standard deviation to measure price volatility. When the price breaks above the upper band, it usually heralds the beginning of a larger-degree trend, indicating the market has entered an extremely strong state.
However, we must simultaneously pay attention to the KDJ Indicator (Stochastic Oscillator). Created by George Lane in the 1950s, KDJ is primarily used to analyze overbought and oversold conditions in the market. Currently, the monthly KDJ (9,3,3) shows that the K line (51.16), D line (49.72), and J line (54.03) are all hovering around the median of 50, with the J line being the highest and the K line above the D line. This means that at the monthly level, it has just recovered from the previous oversold zone, and momentum is gradually strengthening, but it has not yet entered the overbought zone. This is a very healthy long-term bullish signal, suggesting that ZEC still has considerable upside potential in the macroeconomic cycle.
⏱️ Chapter 4: 4-Hour Chart Deep Dive — The Dilemma of EMA Ribbon and Pitchfork
Finally, we arrive at the 4-hour chart, which is the battlefield for executing specific trading plans.
4-Hour Timeframe for ZEC (Zcash)
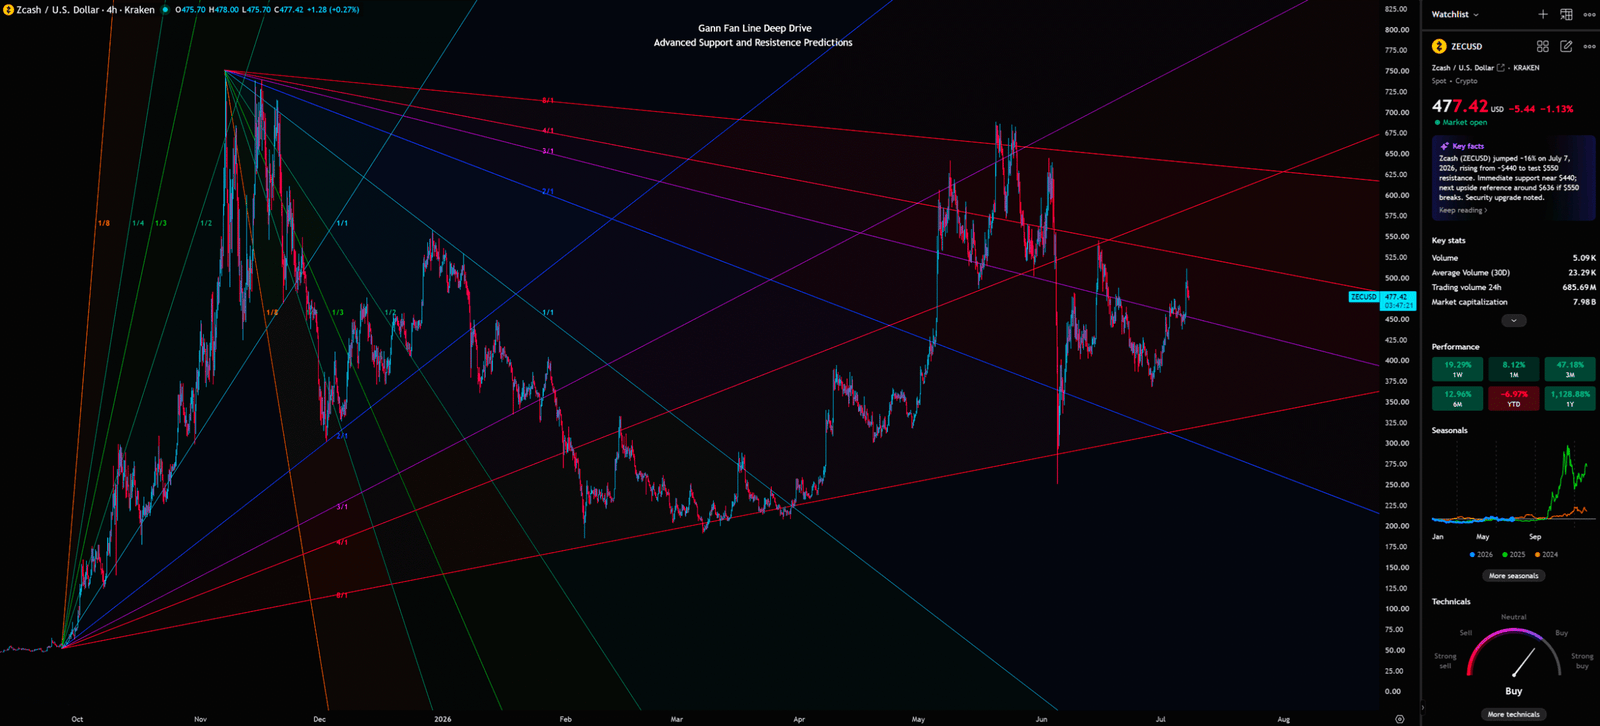
On the 4-hour chart, we have utilized highly advanced Gann Fan Lines for an in-depth analysis. Invented by legendary trader W.D. Gann in the early 20th century, the core concept of Gann angles is the perfect balance between time and price (e.g., a 1×1 line represents one unit of time corresponding to one unit of price).
From the chart, we can see that we have drawn Gann Fan Lines from multiple major pivot points. The current price of $477.42 is situated in an extremely complex convergence zone of these angle lines.
Specifically, there is a cluster of red descending angle lines (2/1, 3/1, 4/1) extending from the November 2025 high, forming a powerful downward resistance in the $500-$550 area. This coincides perfectly with the top of the VPFR Vacuum Zone we observed on the weekly chart.
Simultaneously, below, there is a white ascending 1/1 angle line extending from the October 2025 low, providing support around $450. Further down, purple and blue angle lines build a defense line in the $400-$450 range.
Ex-Banker’s Perspective: Retail investors often only look at simple horizontal support and resistance, while institutions utilize dynamic tools like Gann Fan Lines that incorporate the dimension of time. Currently, ZEC’s price is squeezed between descending resistance lines and ascending support lines, facing an imminent directional decision. If the big players truly want to pump the price, they must use sufficient capital volume to break through the dense red angle line resistance above. If the trading volume does not support this synchronously, the risk of being rejected and falling back near these angle lines is extremely high.
🎯 Comprehensive Conclusion and Multi-Scenario Planning (Trading Scenarios)
Combining fundamental news with multi-timeframe technical analysis, we formulate the following trading plan for ZEC:
🐂 Bullish Scenario
- Trigger Condition: A strong breakout and stabilization above the Fibonacci 0.382 ($498.92) level on the daily chart, completing an S/R Flip, and successfully breaking through the Gann descending angle line resistance zone on the 4-hour chart. Simultaneously, there must be a clear amplification in trading volume.
- Target Price: The short-term target looks toward the Fibonacci 0.236 ($571.67) area; if broken, the medium-term target points directly to $688.62 (the resistance area above the ‘The Safest Entry Point’ marker).
- Institutional Logic: Large players utilize the bullish sentiment from the Ironwood upgrade to push the price to the upper edge of the vacuum zone, attracting more retail investors to chase the high.
🐻 Bearish Scenario
- Trigger Condition: The price faces resistance near $498.92 or the Gann descending angle lines, or it breaks out but quickly falls back below this level (a false breakout).
- Downside Target: The first support level looks back to around $440 (Fibonacci 0.5 and Gann ascending support line); if broken, it will test the critical stop-loss defense line at $361.2.
- Invalidation Condition: If it falls below the top of Wave 1 (needs confirmation based on specific wave counting), the entire motive wave assumption is invalidated, and one must decisively cut losses and exit.
- Institutional Logic: The good news is exhausted, and large players distribute their chips near the resistance level, creating Exit Liquidity, leaving the retail investors who chased the high to hold the bag.
Trading Strategy Summary:
- Tentative Buying Point: > US 496.48 (Requires confirmation of stabilization)
- The Safest Entry Point: > US 688.62 (Confirmation of major trend reversal)
- Stop Loss: < US 361.2 (Strictly execute).
I will continue to closely monitor the price action of this Crypto. As soon as a critical reversal signal appears on the charts, I will update my analysis and insights right here immediately. Remember to Bookmark this page and come back often to check for the latest updates!
Want to see our full, interactive chart breakdown? If you want to learn how to draw weekly VPFR, Fibonacci, EMA Ribbon, MACD, Supertrend, and S/R Flip frameworks designed for real trading decisions. Please browse the following『Further Reading』links. Fundamental news tells you what happened. Technical analysis predicts what will happen. To master the professional framework that separates market signal from noise, explore our exclusive models at www.chart-blitz.com.
📚Further Reading:
To help everyone gain a deeper understanding of the various technical indicators mentioned in this article, we have specially prepared the following further reading materials. These cover key analytical tools found across the weekly, daily, monthly, and 4-hour charts.
- Decoding Fibonacci Retracement: The Perfect Blend of Natural Law and Market Psychology — Fibonacci Retracement is not just a set of magical numbers; it is a manifestation of market psychology. Learning how to correctly draw and interpret Fibonacci levels is a required course for every serious trader.
- Elliott Wave Theory Practical Manual: Key Rules for Identifying Impulse and Corrective Waves — Elliott Wave Theory is one of the most complex yet powerful tools in technical analysis. Understanding how to identify impulse and corrective waves, along with the iron rules of Elliott Wave Theory, can help you find direction in the market.
- Understanding VPFR: Finding the Hidden Footprints of Market Makers — The Volume Profile Fixed Range (VPFR) is a powerful tool that tells us where the most trading occurred within a specific price range. This helps us identify true support and resistance levels, as well as potential ‘Vacuum Zones’.
- S/R Flip Support and Resistance Swap Strategy — S/R Flip is one of the most powerful concepts in technical analysis. This article uses real cases to teach you how to use S/R Flip to capture the highest win-rate trading opportunities.
- MACD Momentum Indicator Momentum First — What Does the MACD Line Crossing Above Zero Mean? Golden Cross & Divergence Signals!
- Gann Fan Masterclass — Deep dive into W.D. Gann’s angle theory to identify the geometric relationship between time and price in the market.
- Strategies for EMA Ribbon Bearish Alignment: Dead Cat Bounce or Real Reversal — Deep dive into the EMA Ribbon to understand the battle between short-term and long-term capital.
- Bollinger Band: Long-Term Repricing Zone — The Ultimate Tool to Capture Massive Market Moves Tired of getting shaken out of winning trades too early? Or buying right before a trend reverses? An ex-banker reveals how to use the Bollinger Band to filter out market noise and ride the big waves.
【Disclaimer】 The content herein is for educational purposes and reflects the author’s personal opinion only; it is not investment advice. All financial investments, including cryptocurrencies, carry significant risk, and you could lose your entire capital. To support this site, this article may contain affiliate links. While we strive for accuracy, we cannot guarantee all information is complete or error-free. Please conduct your own research and be fully responsible for your own investment decisions.