When you make a trade, you should have a clear target of where you expect to get out

William Delbert Gann – 1949

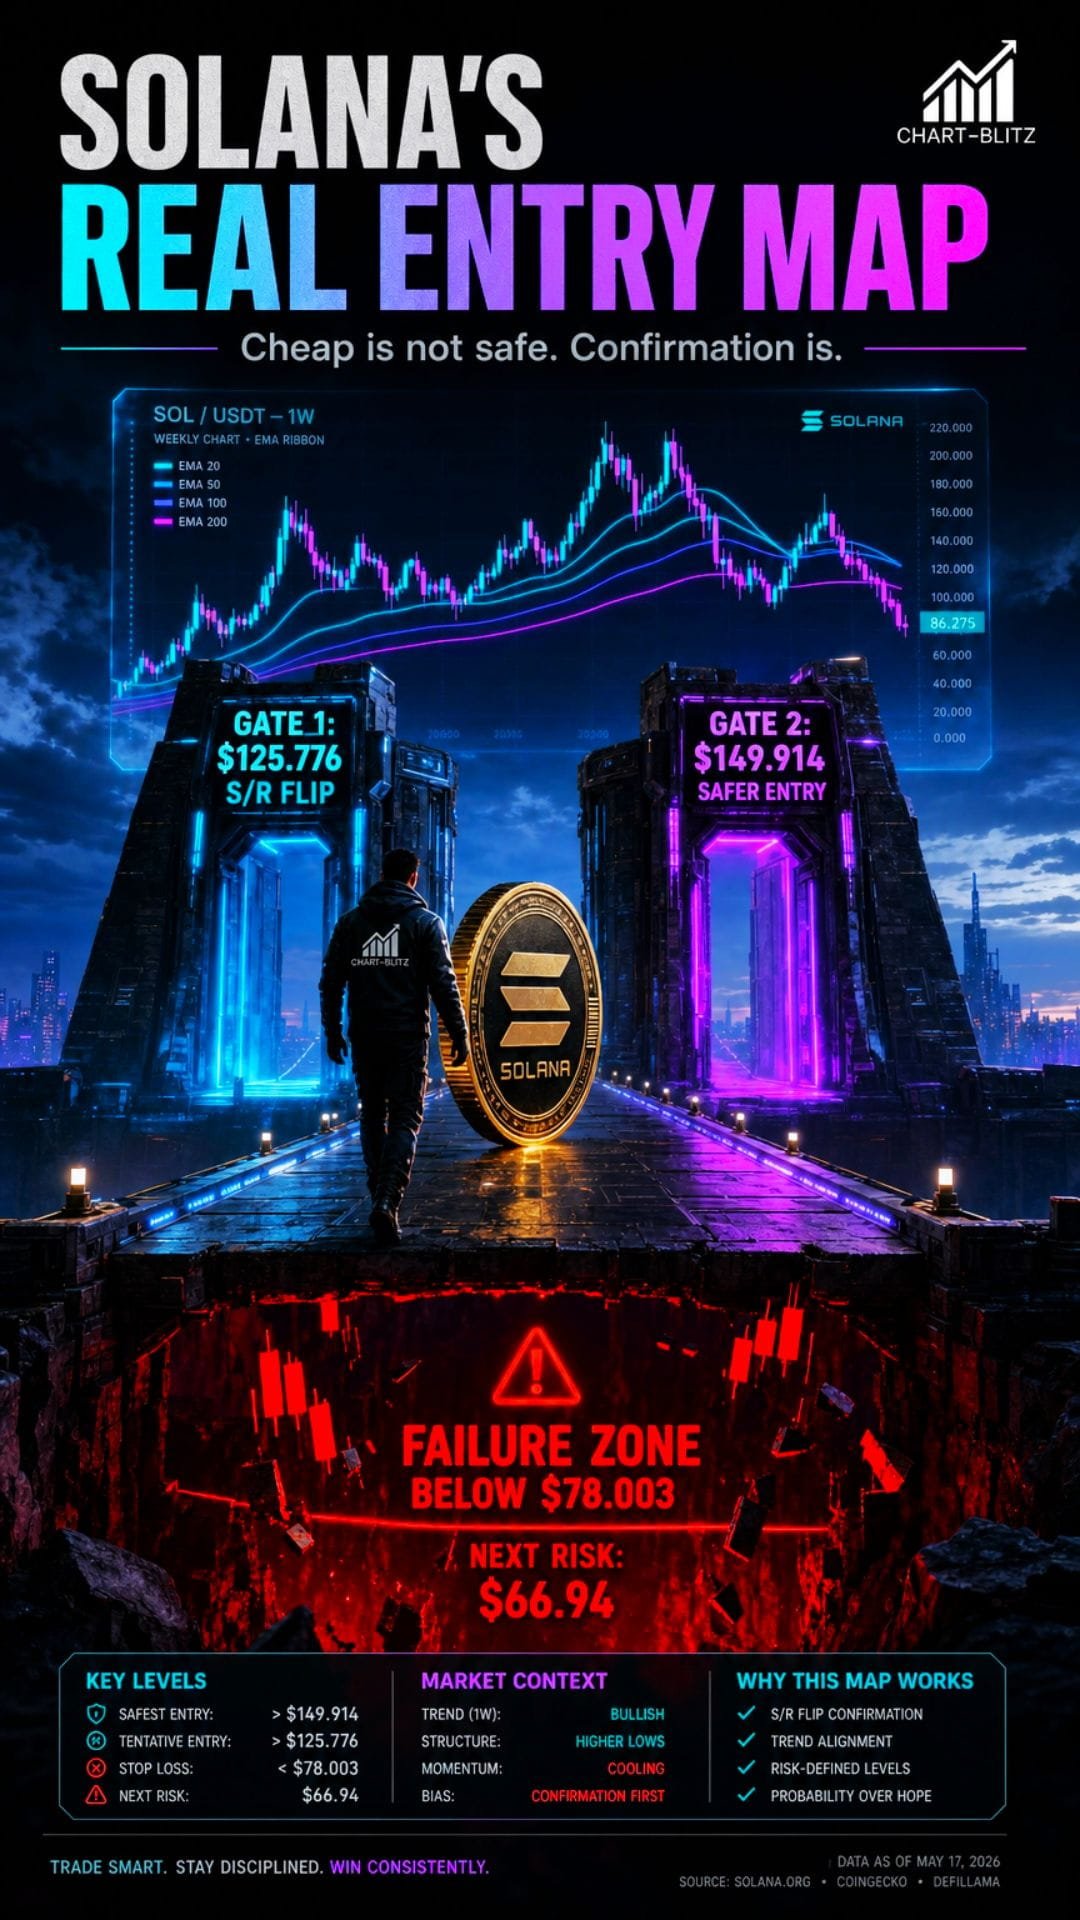
📰 Alpenglow can ignite the narrative, but SOL’s real trend decision still belongs to the weekly S/R Flip between $125.776 and $149.914.

The most dangerous thing about SOL right now may not be the drop itself. It is the temptation for retail traders to look at $86.62 and immediately conclude that Solana is “cheap enough.” A former banking trader would read this chart very differently. In institutional trading, a falling price does not automatically create value. The chart must first prove that former resistance can turn into new support, that buyers are willing to defend higher levels, and that the market structure has stopped printing lower highs and lower lows.

The current Solana setup is a powerful case study in the tension between narrative and structure. On the narrative side, the market still has a major catalyst to discuss. CoinMarketCap Alexandria reported that Anza announced on May 11 that Solana’s Alpenglow consensus upgrade had entered community validator testing. The upgrade is described as one of Solana’s largest proposed consensus overhauls, with goals that include improving performance under heavy network load and sharply reducing transaction finality.6 For retail traders, this sounds like the kind of news that can trigger FOMO. For an institutional trader, however, the first question is not whether the story sounds bullish. The first question is whether the chart has already started confirming accumulation.

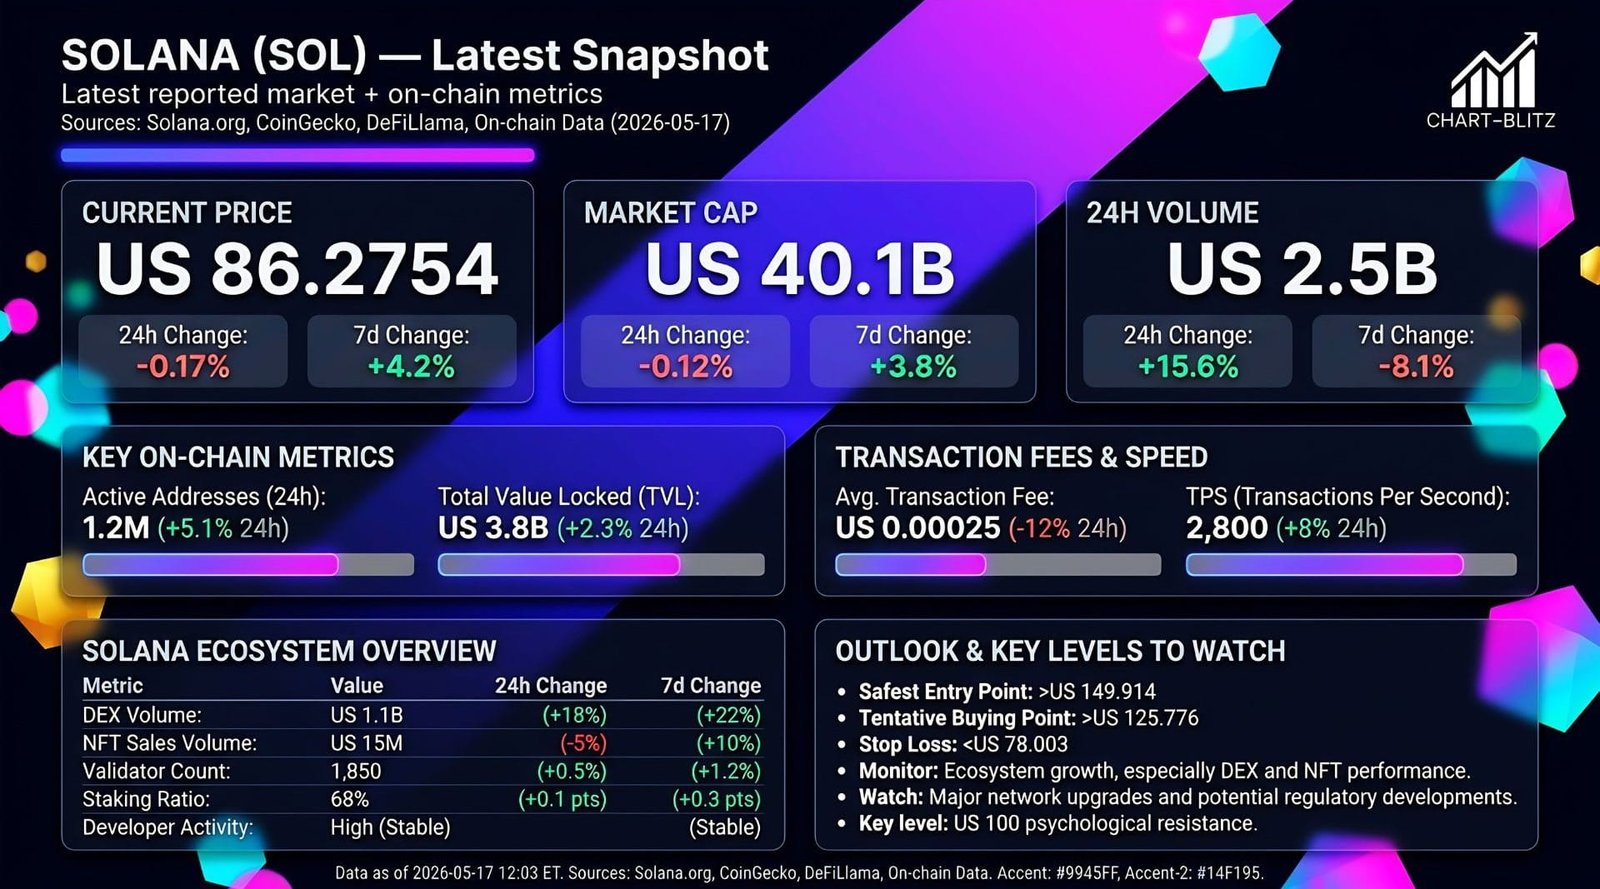
At the locked analysis snapshot, SOL was benchmarked at $86.62. CoinGecko API showed SOL around $86.60 with a 24-hour move of approximately -2.66%, Binance API showed SOLUSDT around $86.65 with a 24-hour move of approximately -2.61%, while Coinbase and Kraken quotes clustered near $86.60–$86.62.1345 Public pages from Binance, CoinGecko, and CoinMarketCap showed slightly different values due to timing and methodology, which is why this report uses the cross-checked average as a fixed baseline rather than a moving live quote.

【📊Analysis Baseline Statement】

All technical analysis below is based on the locked price snapshot at 2026-05-17 00:15 ET / 2026-05-17 12:15 GMT+8: SOL = 86.62 USD. Please treat this report as an analytical map, not a live quote. The benchmark is derived from the cross-average of CoinGecko and CoinMarketCap, with CryptoSlate’s widget reading used as a third sanity check.

ComponentLocked Reading / Chart ObservationTrading Meaning
Baseline Price$86.62All scenarios are measured from this fixed snapshot
Weekly Tentative Buying Point$125.776First serious S/R Flip checkpoint
Weekly Safest Entry Point$149.914Higher-quality trend confirmation zone
Weekly Stop Loss$78.003Structural invalidation for the current rebound thesis
Weekly Lower Low$66.94Next major downside risk zone if stop fails
Daily Fib 0.618$117.5991Key resistance aligned with weekly structure
Daily Fib 0.786$69.4443Deep retracement support aligned with weekly downside risk
Monthly Stoch RSIAround 1.28 / 0.43Macro momentum is compressed but not confirmed bullish
4H ChannelLow-$80s to mid-$90sUseful for timing, not for the main thesis

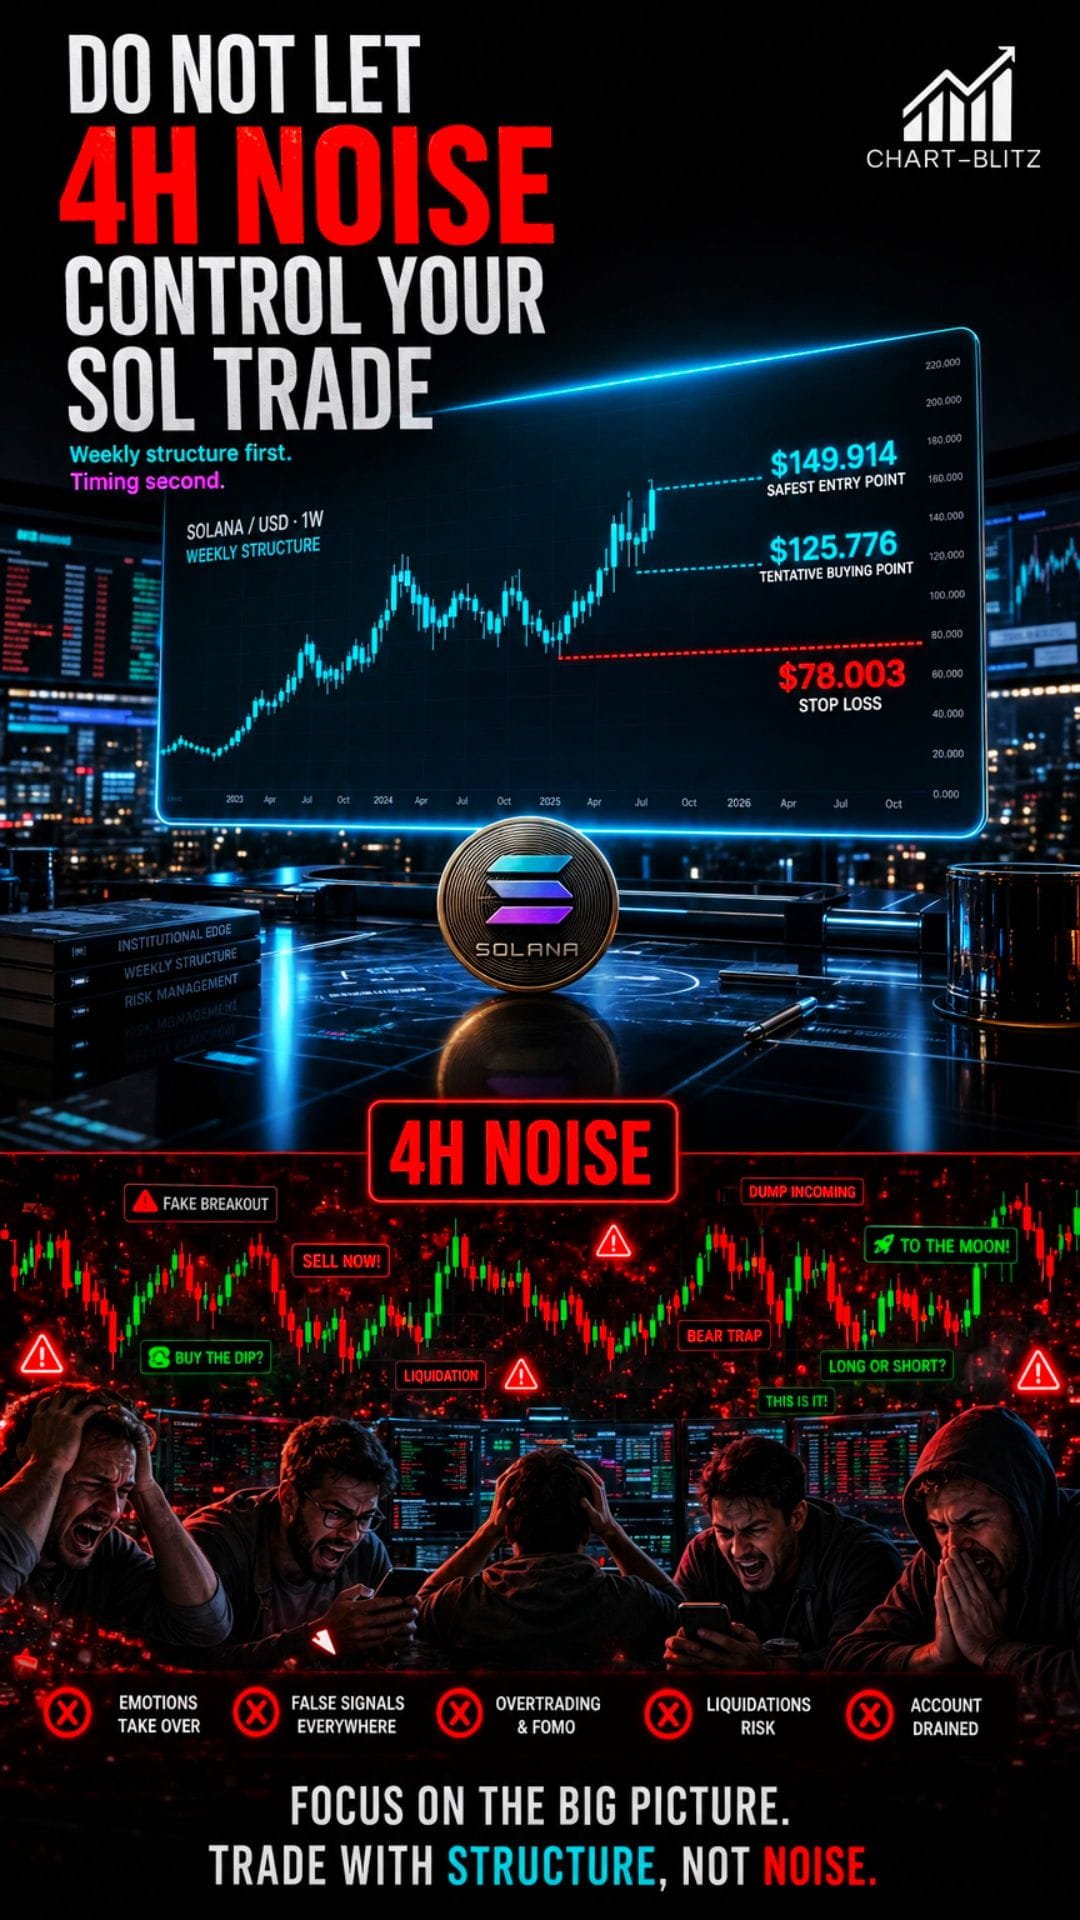
📈Weekly Chart: The Real Map Is Not $86; It Is the S/R Flip from $125.776 to $149.914

The weekly chart is the core of this analysis. The Weekly Chart’s annotations define the market structure clearly: Swing High $253.505, Swing Low $155.948, Lower High $148.908, Lower Low $117.227, and Lower Low $66.94. These levels matter because they describe the language of Dow Theory. A healthy uptrend needs higher highs and higher lows. A market that keeps printing lower highs and lower lows remains structurally defensive until proven otherwise.

Weekly Timeframe for SOL (Solana)

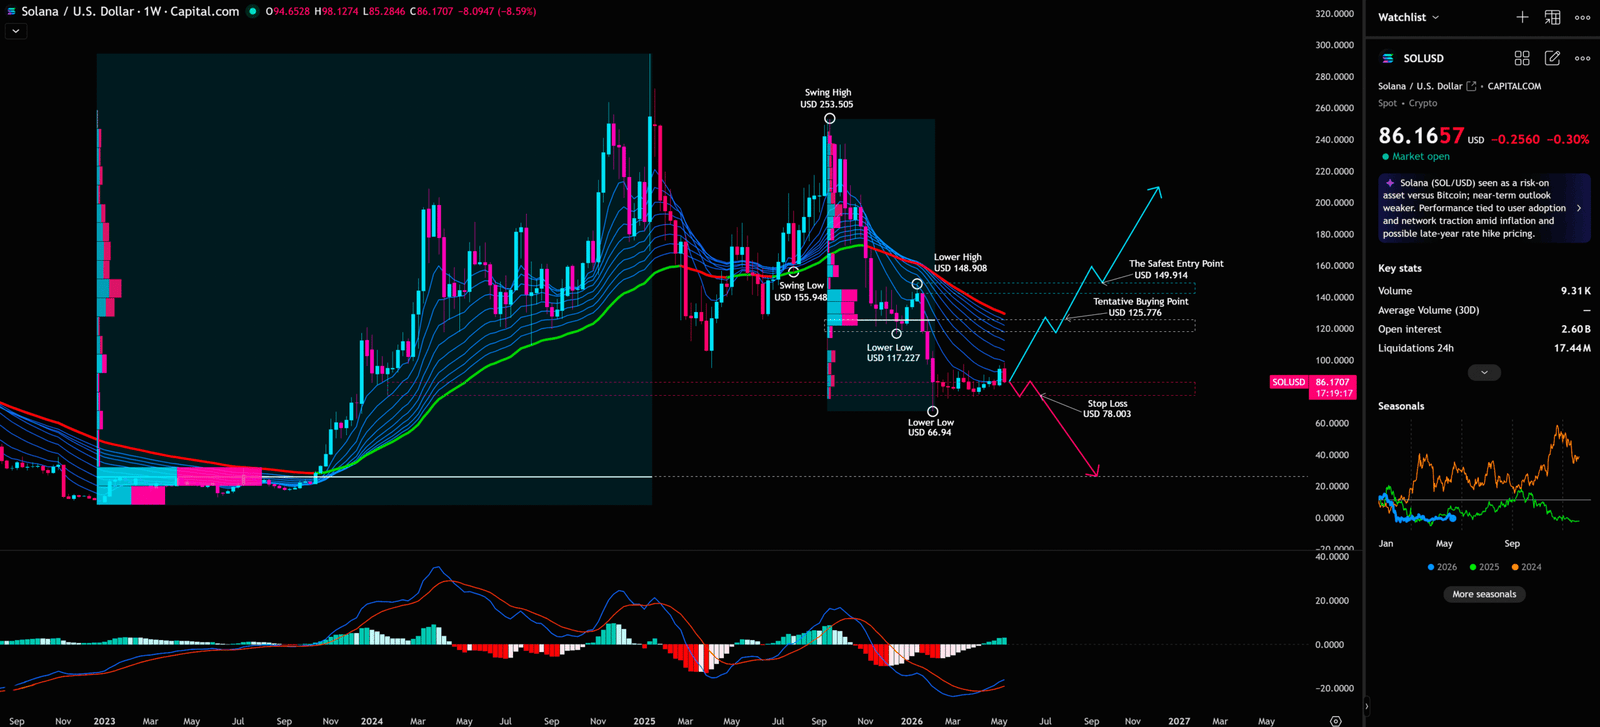
SOL’s weekly chart has not yet delivered that proof. After the major advance, price failed to hold $155.948, then created a lower high near $148.908, then moved toward $117.227, and eventually marked a lower low at $66.94. That is not yet a clean trend reversal. It is a rebound attempt inside a larger repair process.

This is where retail and institutional thinking diverge. Retail sees the fall from $253 to $86 and says, “It has already dropped a lot.” An institutional trader asks a colder question: Can SOL reclaim the lost $117–$126 zone, then reclaim the former lower high around $149, and then defend those levels as new support? That is the essence of the support/resistance flip. A resistance break is not real simply because price spikes above a line. It becomes meaningful only when the market returns to that area and buyers defend it.

The first key user-defined level, $125.776, sits above the weekly lower-low region and near the first major recovery zone. If SOL rallies from $86.62, the first serious test is not whether social media can dream about $200 again. The first test is whether SOL can reclaim the $117–$126 battlefield. If price reaches this area and gets rejected, the market is simply confirming that old support has become new supply.

The second key user-defined level, $149.914, is more important for trend quality. It sits very close to the weekly lower high at $148.908. This makes the level strategically powerful. Buying higher does not automatically mean buying riskier. In many institutional frameworks, a higher entry after confirmation can carry lower structural risk than a lower entry before confirmation. A cheap price without structure is a trap. A higher price with confirmed support can be a plan.

The weekly EMA ribbon also warns that the market has not yet earned a clean bullish label. When a ribbon slopes downward above price, it acts like a ceiling of systematic supply. The weekly MACD may be showing early signs of repair, but momentum improvement is not the same as trend reversal. A MACD histogram recovery can tell us selling pressure is slowing; it cannot by itself overturn a weekly sequence of lower highs and lower lows.

From a wave perspective, SOL’s decline still looks more like a large corrective structure than a clearly confirmed new impulse wave. If the market later tries to label a rebound as a five-wave advance, the rules must remain strict. The low of wave 4 must not overlap the top of wave 1. If it does, the bullish impulse count fails and the structure is more likely part of a larger correction. That matters here because SOL is still in a repair phase, not in a confirmed new macro uptrend.

The weekly plan is therefore simple but strict: Stop Loss $78.003 < Tentative Buying Point $125.776 < Safest Entry Point $149.914. This is a risk map, not a prediction poster. Below $78.003, the rebound thesis weakens materially. Above $125.776, the first S/R Flip becomes possible. Above $149.914, the chart begins to show a stronger case that the prior lower-high structure has been challenged.

📊Daily Chart: Fibonacci Says $86 Is a Deep-Water Zone, Not a Confirmed Bottom

The daily Fibonacci structure provides the next layer of evidence. The chart shows a retracement range from roughly $294.7402 at the top to $8.1041 at the bottom, with key levels at $227.0941, $185.7452, $151.4222, $117.5991, and $69.4443. SOL at $86.62 sits between the 0.786 and 0.618 retracement levels, which is an emotionally tempting zone for bottom-fishing.

Daily Timeframe for SOL (Solana)

But Fibonacci does not say “buy because price is low.” A deep retracement only tells us that price has given back a large portion of its prior move. It does not prove that buyers have regained control. For that, the market must reclaim resistance, hold a retest, and ideally show multi-timeframe alignment.

The daily 0.618 level at $117.5991 is especially important because it aligns closely with the weekly $117.227 structure. When a daily Fibonacci level and a weekly structural level cluster together, that area becomes more than a normal resistance. It becomes a battlefield of market memory. If SOL reclaims it, the market starts to repair. If SOL rejects there, the rebound may simply become another distribution opportunity.

The daily MACD appears to be repairing from a depressed state, but this should be treated as a supporting clue rather than a green light. A trader who buys only because MACD improves is still vulnerable to a major resistance rejection. A trader who waits for MACD repair, Fibonacci recovery, and weekly S/R Flip confirmation is thinking in layers rather than chasing a single signal.

📅Monthly Chart: Macro Compression Is Real, but Compression Is Not Confirmation

The monthly chart gives the macro risk context. The user’s monthly chart shows Supertrend and Stoch RSI. Supertrend support appears to sit in the broader $60s area, which aligns with the weekly $66.94 lower low and the daily 0.786 Fibonacci zone near $69.4443. This cluster matters because, if $78.003 fails, the next institutional area of interest is more likely to be the $66–$69 region than a random round number.

Monthly Timeframe for SOL (Solana)

The monthly Stoch RSI near the floor signals extreme momentum compression. However, compression is not reversal. In a strong downtrend or large corrective phase, oversold conditions can stay oversold for a long time. Retail traders often confuse “oversold” with “must bounce.” Institutional traders treat oversold as a condition that requires confirmation, not as a standalone entry signal.

This means the monthly chart is supportive but not decisive. It says SOL is in a deep macro compression zone worth watching. It does not say the market has already reversed. The decisive evidence still has to come from the weekly S/R Flip.

⏱️4-Hour Chart: Useful for Timing, Dangerous for Thesis-Building

The 4-hour chart shows SOL trading inside a short-term rising channel or range, roughly from the low-$80s into the mid-$90s. Price recently rejected near the $96 area and returned toward the lower-middle part of the channel. Several downward-sloping fan lines remain overhead, reminding traders that short-term rebounds are still meeting angled resistance.

4-Hour Timeframe for SOL (Solana)

The 4-hour chart is attractive because it feels immediate. But it is also noisy. Using a 4-hour channel bottom as the main reason for a weekly bullish thesis is a classic time-frame mistake. The correct hierarchy is the opposite: weekly decides the thesis, daily tests the quality of the rebound, and 4-hour only refines execution.

For now, the 4-hour structure says SOL is still oscillating inside a short-term repair zone. A recovery above $96 would improve short-term tone, but it would not confirm the larger reversal. The bigger test remains the $117–$126 zone and then the $149.914 zone.

News vs Chart: Alpenglow Is the Story; S/R Flip Is the Password

Solana’s fundamental narrative still has strength. The Alpenglow upgrade, if successfully implemented, could improve finality and network performance under load, which matters for DeFi, trading applications, and high-throughput blockchain use cases.6 CoinGecko also describes Solana as a high-performance Layer 1 blockchain designed for low-cost, fast decentralized applications.2

But trading is not whitepaper reading. News creates attention; charts reveal whether capital is actually committing. If the news is bullish but SOL cannot reclaim $117–$126, then large buyers may still be refusing to chase. If the news is only moderately bullish but price breaks and retests $125.776 successfully, the chart may already be front-running the next narrative wave.

The Chart-Blitz principle is clear: fundamental news gives the market an object to analyze, but only rigorous technical analysis can map the timing and structure of the move

💡 Trading Plan: Three Layers of Confirmation, Not One All-In Guess

At the locked baseline of $86.62, SOL should be treated through three layers. The first is the observation layer. As long as price remains above $78.003 but below the $117–$126 resistance zone, SOL is watchable but not confirmed. Short-term trades may exist, but the weekly reversal thesis has not been validated.

The second layer is the tentative S/R Flip. If SOL reclaims the $117.5991 / $117.227 cluster and then breaks and retests $125.776, the chart begins to show its first credible repair signal. The key is not the breakout candle. The key is the retest.

The third layer is the safer trend-confirmation zone. If SOL then breaks and retests $149.914, it would challenge the prior weekly lower high and raise the probability that the market is transitioning from a lower-high structure into a higher-high structure. That would still require risk management, but the setup would be much cleaner than buying blindly at $86.

ScenarioTriggerMeaningAction Framework
Defensive WatchHolds above $78.003 but below $117–$126Rebound repair, not confirmed reversalMonitor only; do not call $86 a safe bottom
Initial StrengthBreaks and retests $125.776First credible S/R FlipConsider staged exposure only after confirmation
Structural ConfirmationBreaks and retests $149.914Prior lower high challengedHigher-quality entry zone, still risk-managed
Bearish InvalidationBreaks below $78.003Rebound structure failsExit thesis; watch $66.94 / $69.44

🧠Final View: SOL Is Interesting, but the Chart Has Not Paid the Entry Fee Yet

SOL has a strong narrative, a deep retracement, and a monthly momentum profile that makes it worth monitoring. But the weekly chart has not yet paid the entry fee required for a high-conviction bullish reversal. The market is still asking traders to separate price attractiveness from structural confirmation. The smartest reading is not “buy because SOL is cheap.”

The smarter reading is: watch whether SOL can turn $125.776 into support, then prove itself again at $149.914. If that happens, the chart begins to look like accumulation. If $78.003 fails, the entire rebound thesis must be downgraded and the $66–$69 zone becomes the next major risk area.

I will continue to closely monitor the price action of this Crypto. As soon as a critical reversal signal appears on the charts, I will update my analysis and insights right here immediately. Remember to Bookmark this page and come back often to check for the latest updates!

Want to see our full, interactive chart breakdown? If you want to learn how to draw weekly VPFR, Fibonacci, EMA Ribbon, MACD, Supertrend, and S/R Flip frameworks designed for real trading decisions. Please browse the following『Further Reading』links. Fundamental news tells you what happened. Technical analysis predicts what will happen. To master the professional framework that separates market signal from noise, explore our exclusive models at www.chart-blitz.com.

📚Further Reading:

To help everyone gain a deeper understanding of the various technical indicators mentioned in this article, we have specially prepared the following further reading materials. These cover key analytical tools found across the weekly, daily, monthly, and 4-hour charts.

  1. Decoding Fibonacci Retracement: The Perfect Blend of Natural Law and Market Psychology Fibonacci Retracement is not just a set of magical numbers; it is a manifestation of market psychology. Learning how to correctly draw and interpret Fibonacci levels is a required course for every serious trader.
  2. Elliott Wave Theory Practical Manual: Key Rules for Identifying Impulse and Corrective WavesElliott Wave Theory is one of the most complex yet powerful tools in technical analysis. Understanding how to identify impulse and corrective waves, along with the iron rules of Elliott Wave Theory, can help you find direction in the market.
  3. Understanding VPFR: Finding the Hidden Footprints of Market MakersThe Volume Profile Fixed Range (VPFR) is a powerful tool that tells us where the most trading occurred within a specific price range. This helps us identify true support and resistance levels, as well as potential ‘Vacuum Zones’.
  4. S/R Flip Support and Resistance Swap StrategyS/R Flip is one of the most powerful concepts in technical analysis. This article uses real cases to teach you how to use S/R Flip to capture the highest win-rate trading opportunities.
  5. MACD Momentum Indicator Momentum First — What Does the MACD Line Crossing Above Zero Mean? Golden Cross & Divergence Signals!
  6. Gann Fan MasterclassDeep dive into W.D. Gann’s angle theory to identify the geometric relationship between time and price in the market.
  7. EMA Ribbon Practical Guide: Catching Early Trend SignalsThrough the arrangement of multiple exponential moving averages, the EMA Ribbon intuitively displays the strength and changes of market trends. Learning to interpret the convergence and divergence of the EMA Ribbon allows you to spot trading opportunities ahead of others.
  8. Supertrend IndicatorThe Ultimate Tool to Capture Massive Market Moves Tired of getting shaken out of winning trades too early? Or buying right before a trend reverses? An ex-banker reveals how to use the Supertrend indicator to filter out market noise and ride the big waves.

【Disclaimer】 The content herein is for educational purposes and reflects the author’s personal opinion only; it is not investment advice. All financial investments, including cryptocurrencies, carry significant risk, and you could lose your entire capital. To support this site, this article may contain affiliate links. While we strive for accuracy, we cannot guarantee all information is complete or error-free. Please conduct your own research and be fully responsible for your own investment decisions.

Leave a Reply

Your email address will not be published. Required fields are marked *