When you make a trade, you should have a clear target of where you expect to get out
William Delbert Gann – 1949
BNB is not bullish simply because the news is constructive. BNB becomes interesting only when the chart proves it — first above 688.78, then with a banker-grade confirmation above 933.75. That is the difference between retail chart-watching and institutional-style technical analysis. Retail traders often react to headlines first and buy into green candles later. A banking-style framework asks a colder question: has price broken structure, has it held the breakout, where is the invalidation point, and what must happen after a stop-loss before re-entry is justified?
【📊Analysis Baseline Statement】
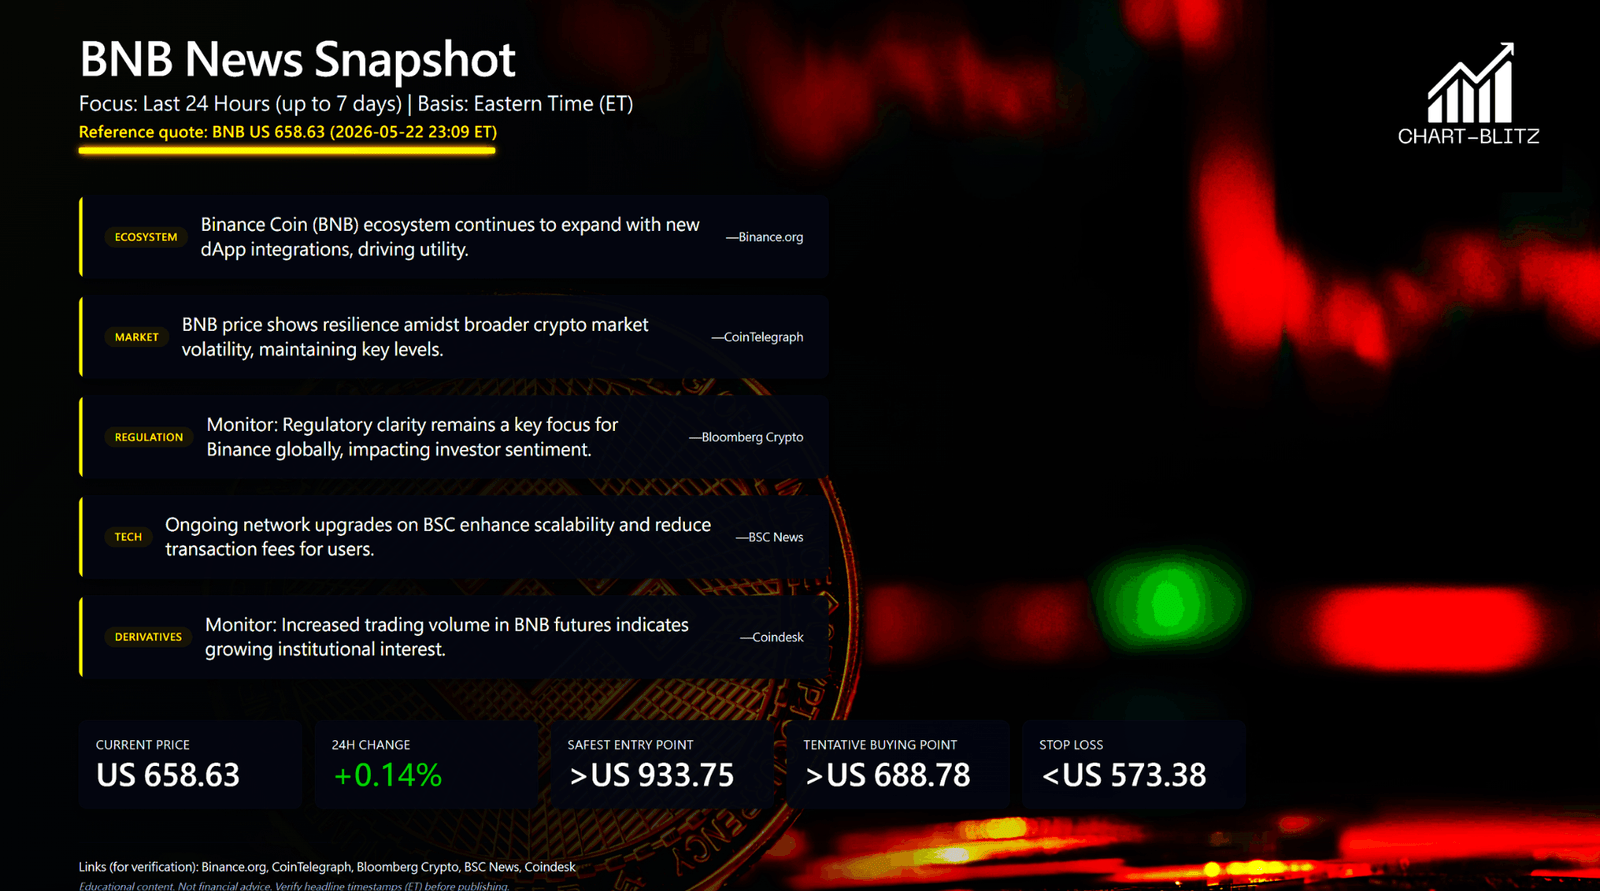
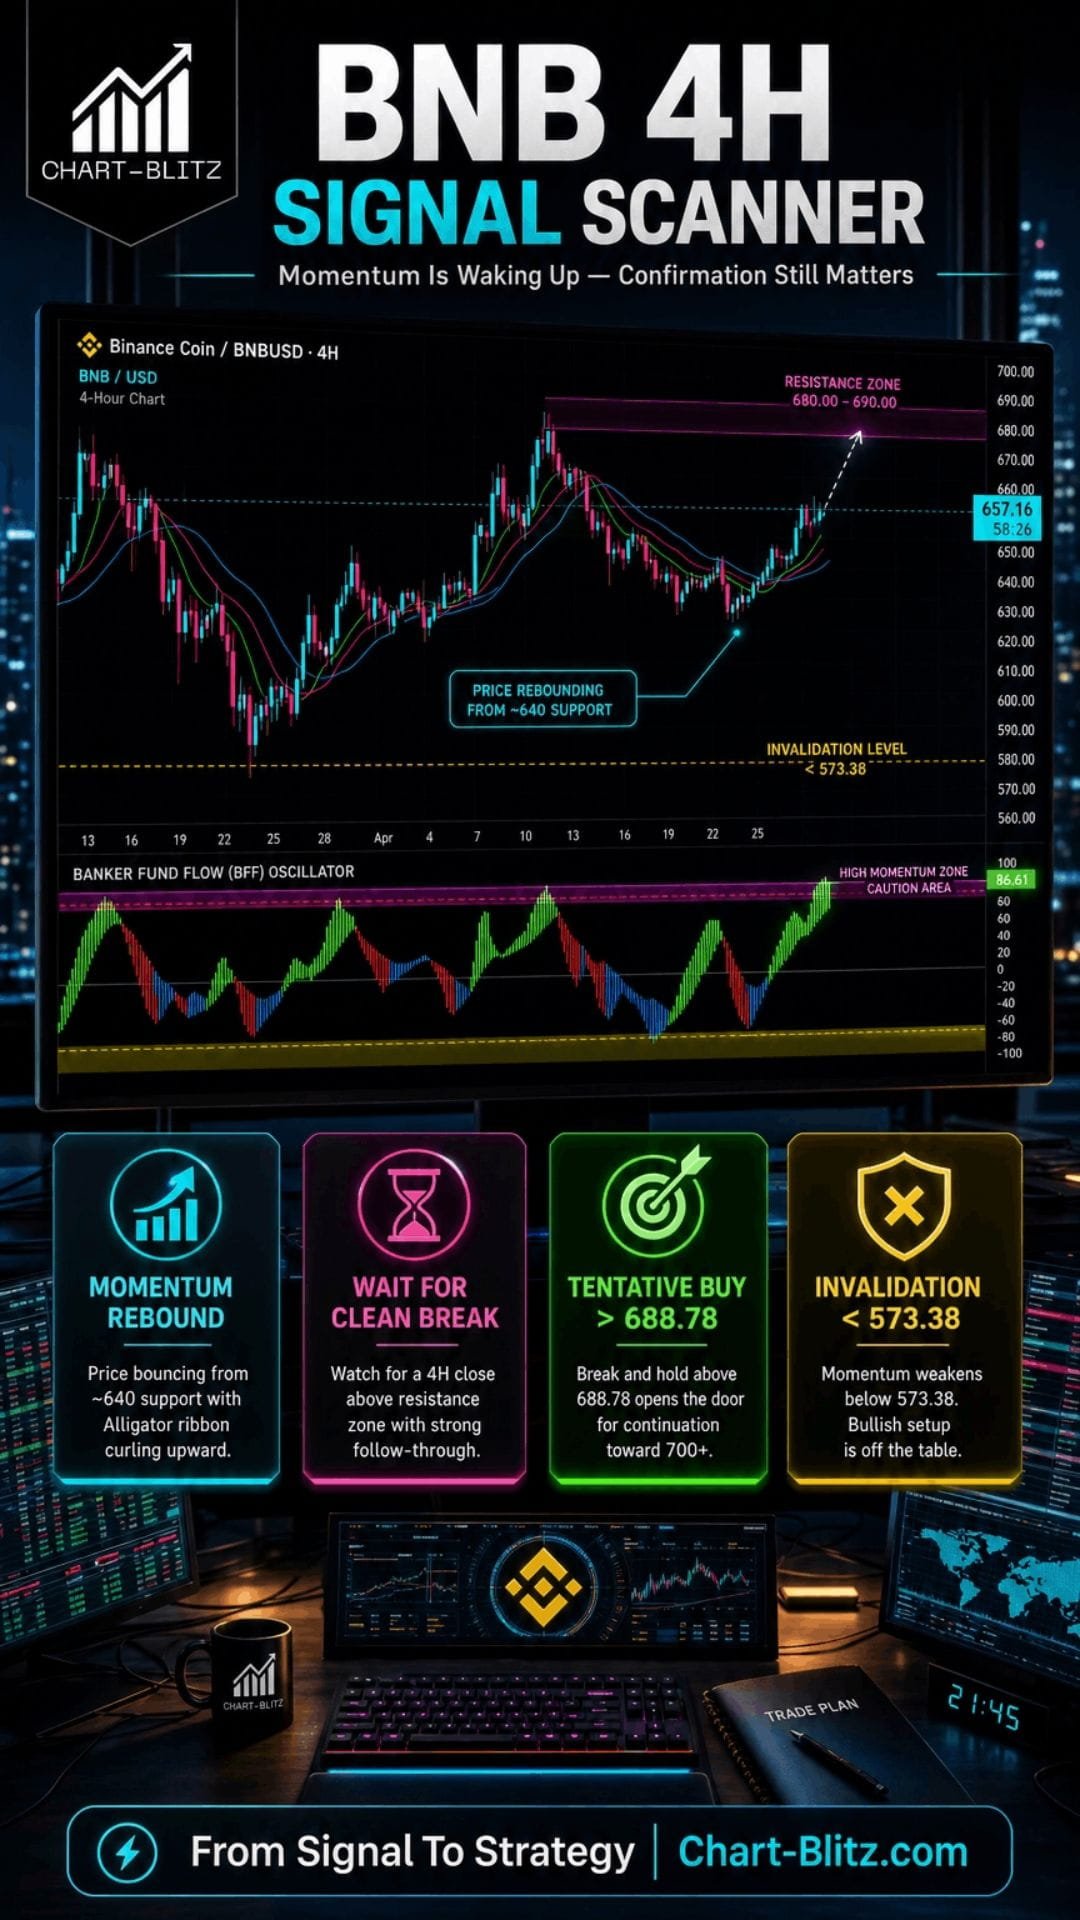
All technical analysis below is based on the price snapshot locked at 2026-05-22 23:27 UTC / 2026-05-22 19:27 ET: BNB = 657.28 USD. Please treat this report as an analysis map, not as a real-time quote.
The locked benchmark is not taken from a single venue. It is the average of three active cross-checks: CoinGecko at approximately 657.36 USD, CoinMarketCap at approximately 657.32 USD, and Yahoo Finance at approximately 657.15 USD, producing a working reference of 657.28 USD. This matters because the current market sits below the chart’s first tactical trigger at 688.78 USD and far below the more conservative weekly confirmation zone at 933.75 USD. Therefore, the real question is not whether BNB has bounced. The question is whether the bounce can evolve into a structure-confirmed reversal.
News Catalyst: The Story Is Strong, but the Chart Still Decides Timing
BNB’s recent fundamental backdrop is attractive enough to justify attention. CoinStats’ 22 May 2026 market analysis reported BNB trading near 657 USD, up modestly over 24 hours but still down over the prior week, implying short-term resilience without full trend restoration.5 Meanwhile, BNB Chain continues to expand around AI agents, x402 programmable payments, the Fetch.ai launchpad, Anoma, stablecoin liquidity, RWA infrastructure and developer tooling.5 8
| Catalyst | Market Meaning | Technical Implication |
| BNBAgent SDK and AI-agent infrastructure | Strengthens the narrative that BNB Chain is not just an exchange-token ecosystem | Positive attention driver, but not a standalone buy signal without 688.78 confirmation |
| Stablecoin and RWA expansion | Improves the real-world utility narrative | Supports long-term interest, but must be validated by price structure |
| Post-quantum cryptography testing | Shows forward-looking security research | Bullish for resilience, but performance trade-offs must be considered |
| Traders watching the 663 region | Confirms short-term market focus near current resistance | Creates a stepping-stone toward 688.78 and 703.25 |
Crypto Briefing reported that BNB Smart Chain tested post-quantum cryptography using ML-DSA-44 and pqSTARK-related components, but also noted a material throughput cost: cross-region native transfers dropped from 4,973 TPS to 2,997 TPS, while mixed workloads fell from 3,695 TPS to 2,406 TPS.6 This is a classic long-term-positive but short-term-complex development. It demonstrates engineering ambition, but also reminds traders that infrastructure upgrades involve trade-offs.
This is why the Chart-Blitz framework remains strict: fundamental news defines what deserves attention; technical analysis decides timing, method and risk. BNB’s ecosystem news earns a place on the watchlist, but it does not remove the need for confirmation on the chart
📈Weekly Chart: The Banker’s Map Starts with 571.96, 688.78 and 933.75
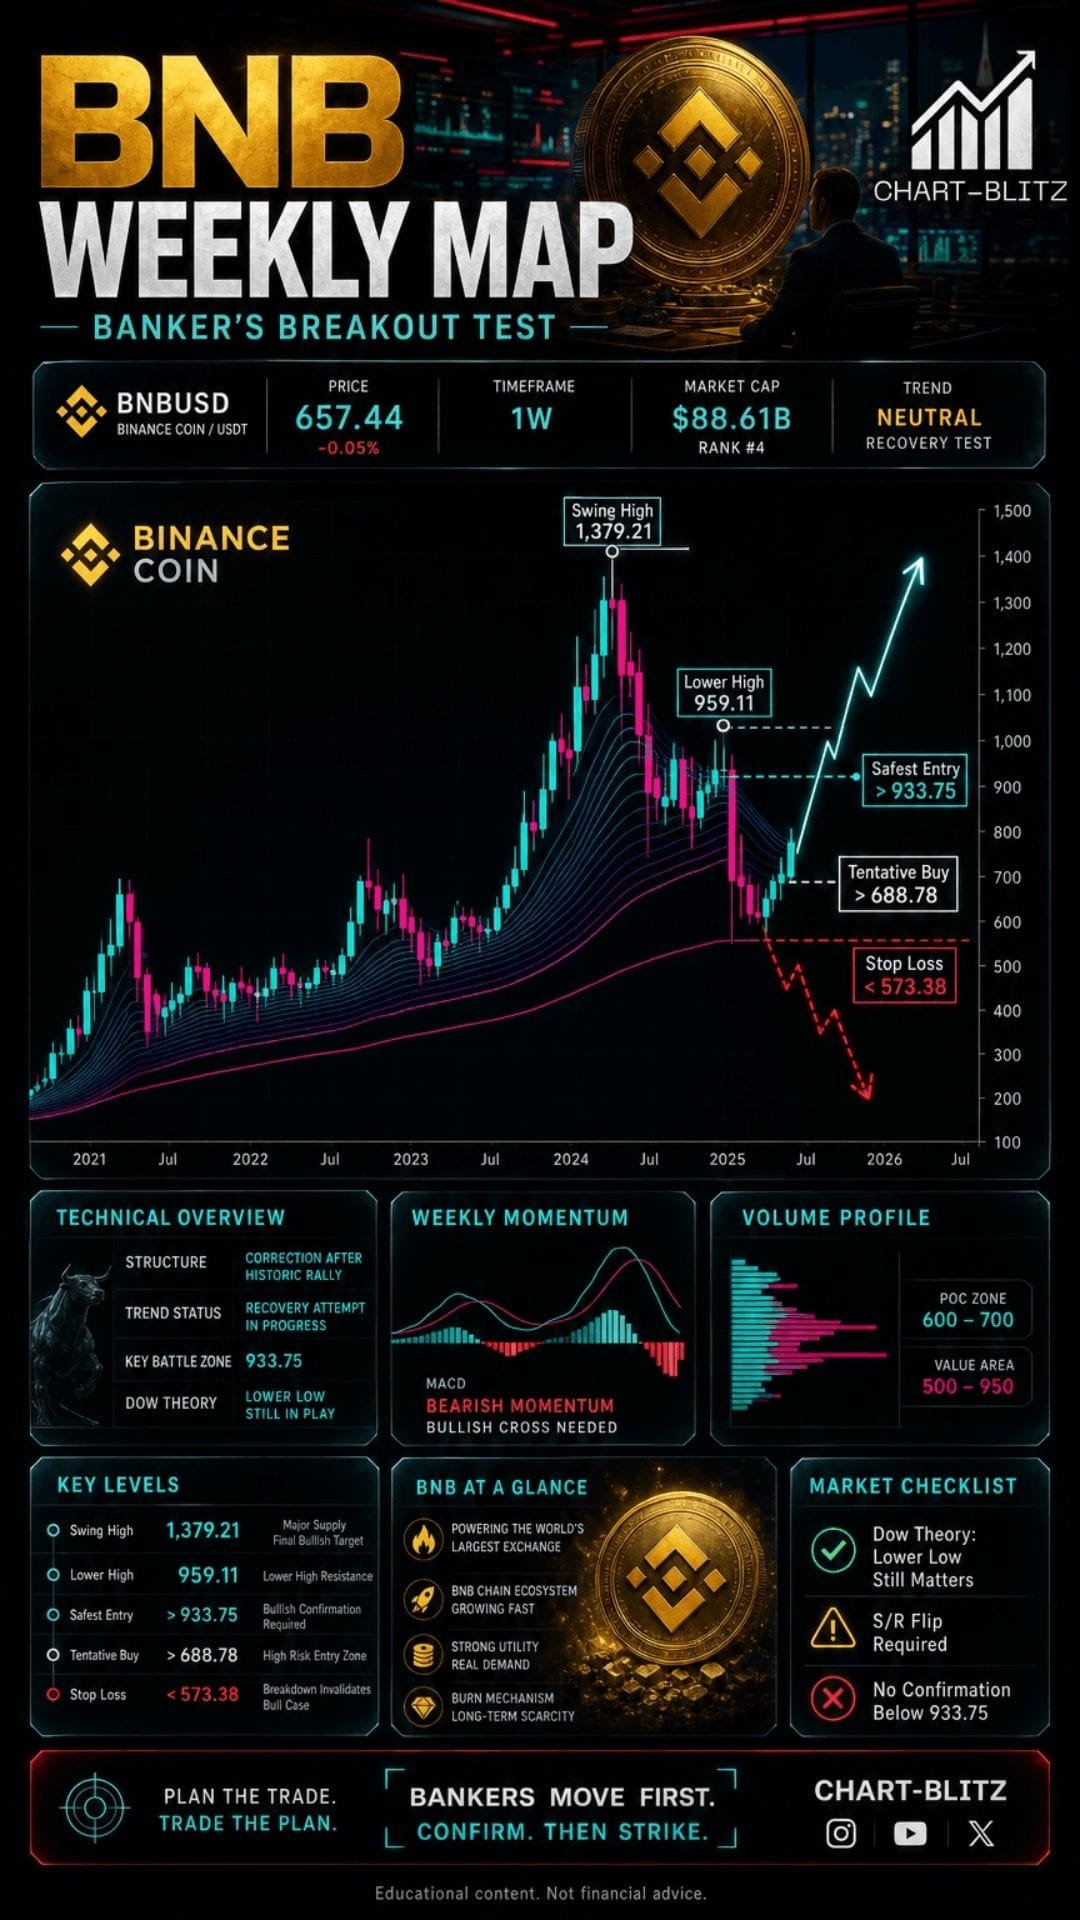
The weekly chart is the core of this analysis. Based on the user-provided chart, the most important framework is not a single indicator but a combination of Volume Profile, EMA Ribbon, MACD, Dow Theory, support/resistance flip logic, and swing structure. The chart marks a major Swing High at 1,379.21 USD, followed by a Lower High at 959.11 USD, a Lower Low at 796.43 USD, and then another key Lower Low near 571.96 USD before the current rebound.
Weekly Timeframe for BNB (Binance Coin)
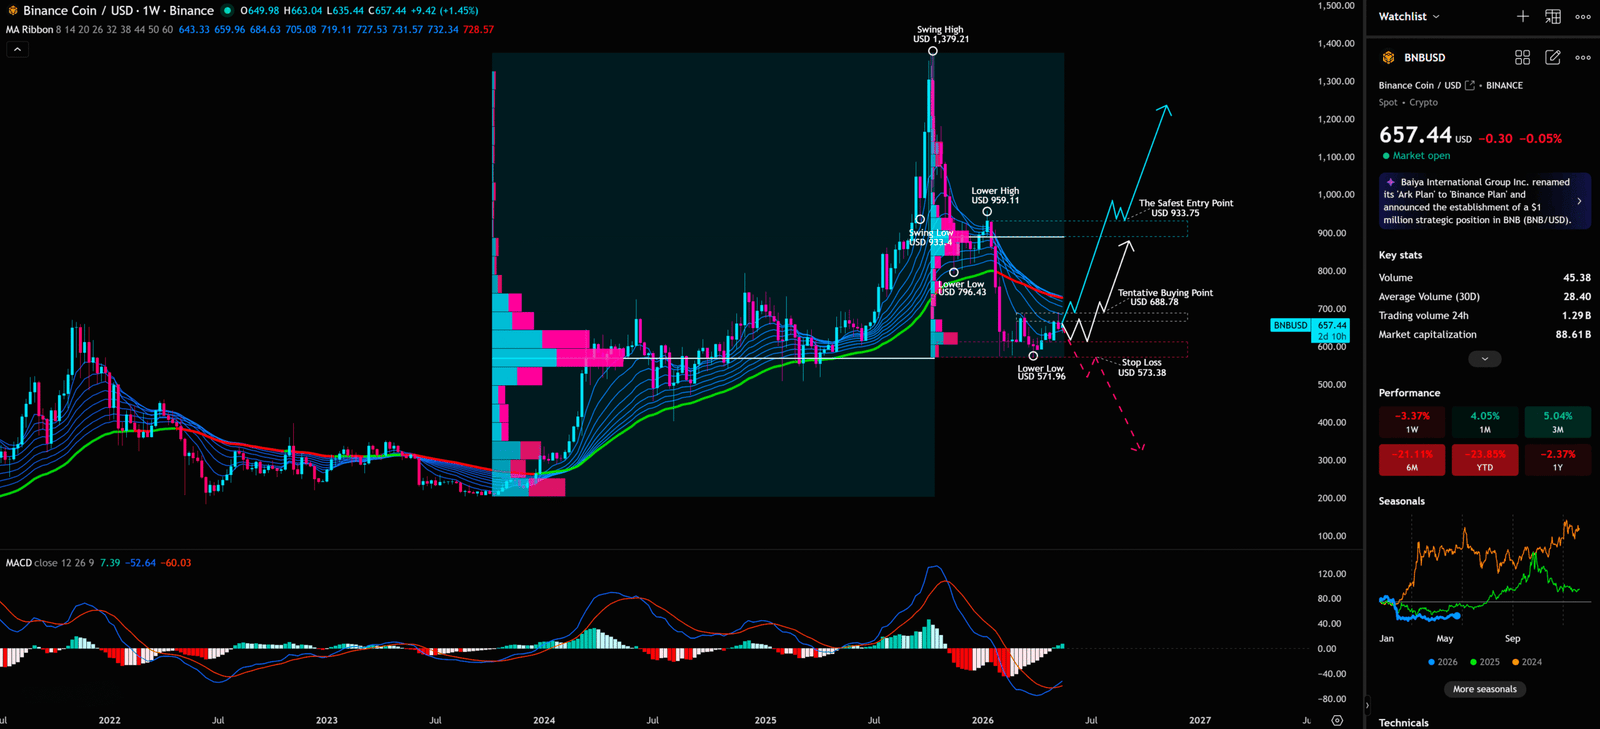
This structure should not be called a confirmed bull trend too early. Dow Theory does not reward one rebound candle; it demands a new sequence of higher highs and higher lows. For BNB to move from a damaged structure into a healthier reversal structure, the first requirement is that the 571.96 area must hold. The second requirement is a break above the user-marked 688.78 USD Tentative Buying Point. The third, and much higher-quality confirmation, is a move through 933.75 USD, the chart’s Safest Entry Point.
| Weekly Level | Chart Role | Strategy Interpretation |
| 571.96 | Recent lower-low zone | If broken, the rebound thesis is damaged |
| 573.38 | Marked stop-loss area | Defines where the current setup is invalidated |
| 688.78 | Tentative buying point | Early trigger, suitable only for controlled exposure |
| 933.75 | Safest entry point | Higher-confidence confirmation if reclaimed and held |
| 959.11 | Prior lower high | A major structure-improvement level |
| 1,379.21 | Swing high | Long-term reference resistance, not an immediate target |
From a former banking-desk perspective, the appeal of this setup is not that BNB is “about to moon.” The appeal is that the risk map is becoming clearer. Below 573.38 is the error zone; above 688.78 is the test zone; above 933.75 is the confirmation zone. This type of layered structure is more useful than vague bullish or bearish language because professional trading begins with knowing where the idea is wrong.
The weekly MACD also appears to be in an early repair phase rather than a full momentum expansion phase. The EMA Ribbon still reflects the damage from the prior decline, and price needs time to force the moving averages back into a healthier alignment. This should be described as a reversal-watch phase, not a confirmed bull-market phase.
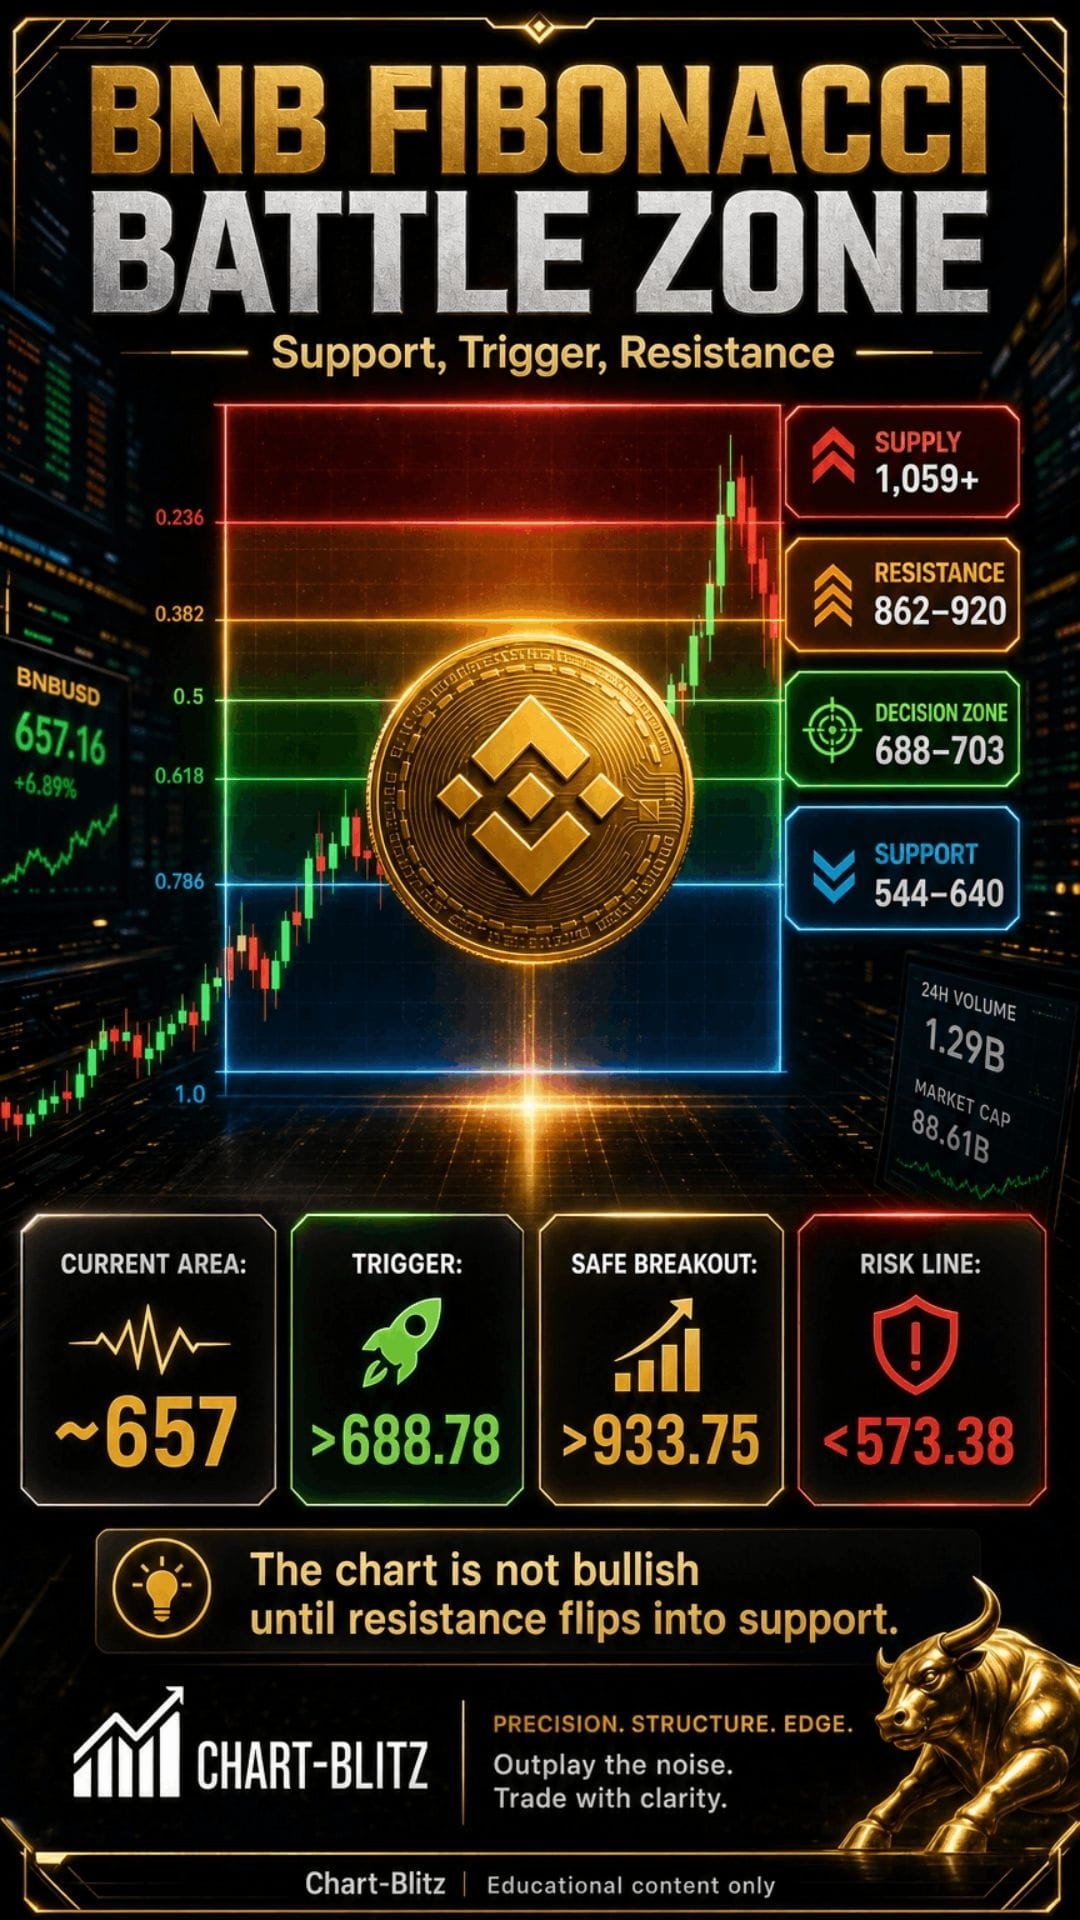
📊Daily Chart: Fibonacci Says 657 Is Still a Battlefield, Not a Victory Zone
The daily chart applies a broad Fibonacci retracement framework, with key levels around 544.17 USD at 0.618, 703.25 USD at 0.5, 862.34 USD at 0.382, and 1,059.17 USD at 0.236. The locked benchmark of 657.28 USD sits between the 0.618 and 0.5 retracement levels. That makes the current price zone a mid-range battlefield rather than a high-confidence victory zone.
Daily Timeframe for