The speculator’s chief enemies are always boring from within. It is inseparable from human nature to hope and to fear
William Delbert Gann – 1949
While the broader cryptocurrency market reacts to every piece of macroeconomic news, the chart of decentralized exchange giant Uniswap (UNI) is quietly telling a more significant story. As most focus on potential U.S. government shutdowns or Bitcoin’s daily fluctuations, UNI’s weekly chart is forming a massive technical pattern that could define its trajectory for the next year. This article provides a deep dive into this multi-timeframe “chart war,” revealing the real trend forming behind the news headlines.
Analysis Benchmark Statement All subsequent technical analysis is based on a price snapshot locked in on October 3, 2025, at 16:29 (UTC): UNI = $8.25 USD. This price snapshot provides a stable reference for the analysis. All support, resistance, and projected paths are relative to this benchmark. As market prices are volatile, readers should treat this report as an “analytical map,” not as real-time pricing.
Catalysts and Fundamental View (The Rear-view Mirror) Over the last 24 hours, there has been no significant, direct news concerning Uniswap. The market is filled with macro “noise,” such as regulatory uncertainty in the U.S. and overall market sentiment driven by Bitcoin. This news explains why the market is paying attention but offers no specific clues about UNI’s next directional move. In the absence of a clear fundamental driver, the importance of technical analysis becomes paramount.
The Predictive Lens: A Multi-Timeframe Technical Deep Dive
Multi-Timeframe Technical Deep Dive (The Predictive Lens) This is the core of the analysis. The user-provided charts reveal a fascinating battle between bulls and bears.
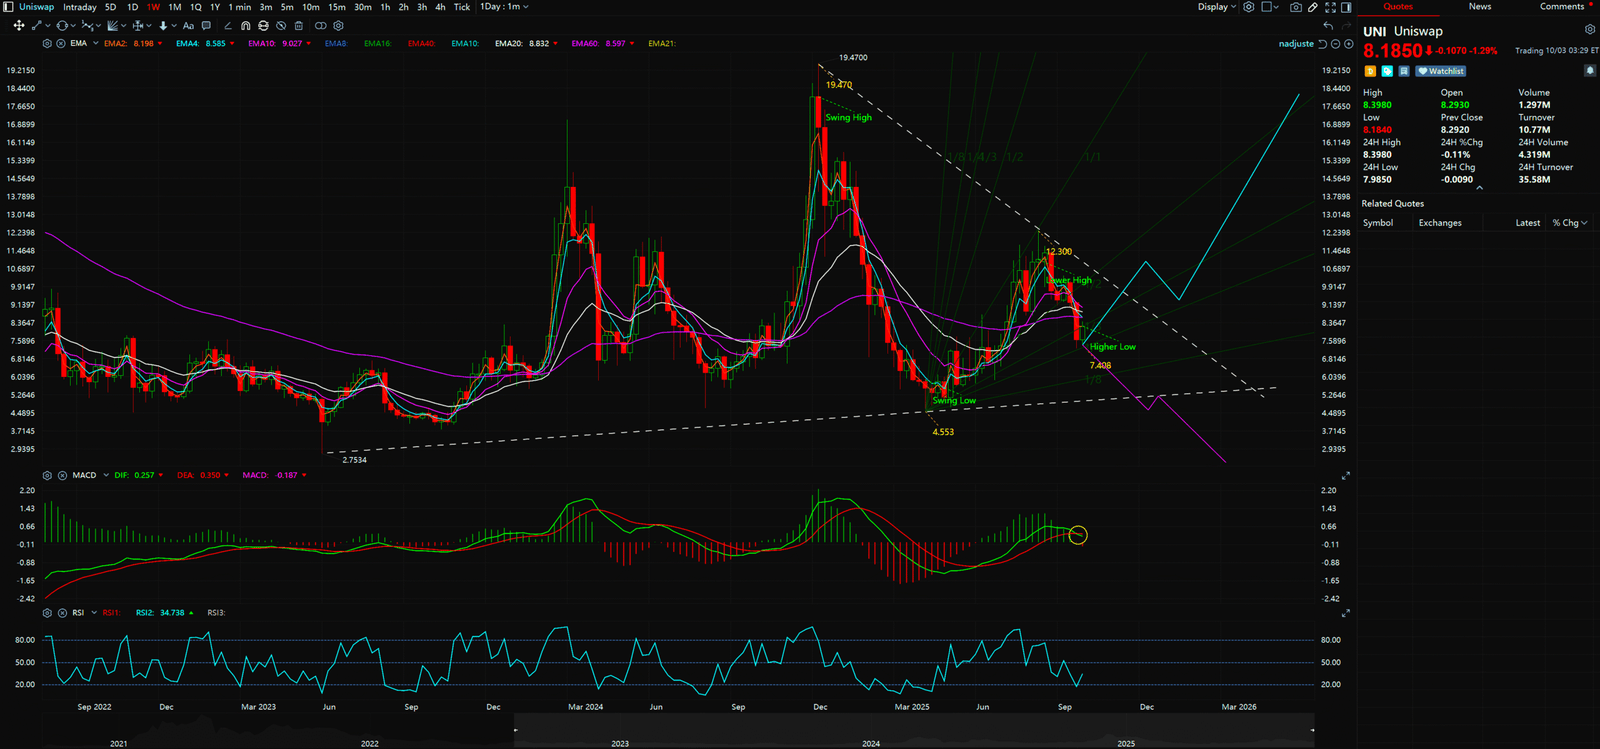
- The Weekly Chart (The Macro View): By observing UNI’s weekly chart, a massive Symmetrical Triangle is clearly forming. This is characterized by a series of Lower Highs (from approx. $19.47 down to $12.3) and, simultaneously, Higher Lows (from approx. $4.553 up to $7.408). This is a classic period of market indecision, where bullish and bearish forces reach a temporary equilibrium, coiling up energy for the next major trend. Notably, the price is currently pulling back towards the 1×4 Gann Fan ascending angle, a line that has historically served as strong support. Furthermore, while the MACD indicator shows a short-term bearish cross, its main body (both MACD and signal lines) remains firmly above the zero line, confirming that the foundation of the long-term uptrend is still intact.
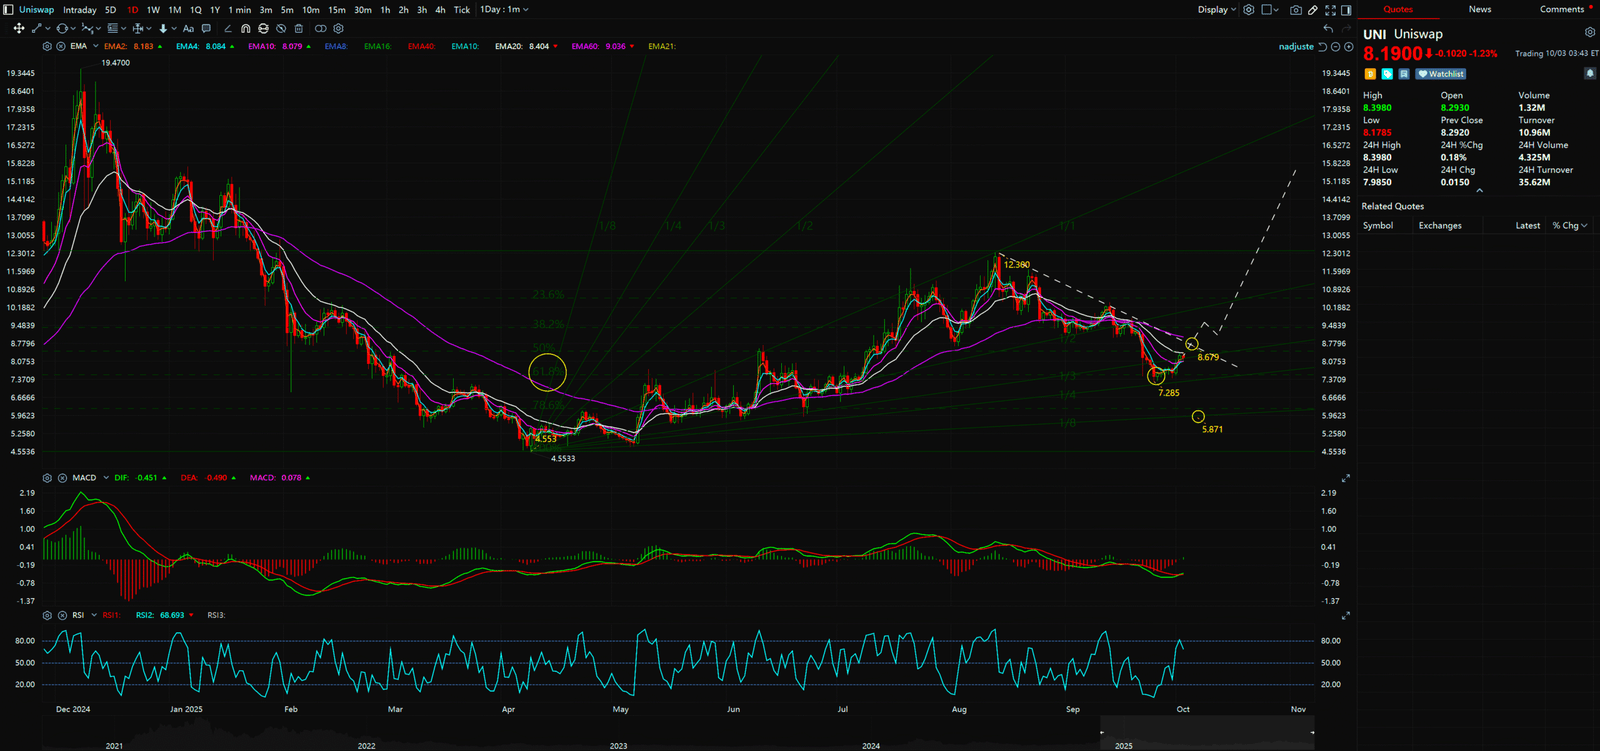
- The Daily Chart (The Tactical View): Switching to the daily chart, the short-term pressure becomes evident. The price is being suppressed by the long-term descending trendline drawn from the previous major highs ($19.47 and $12.3). Until the price can decisively break and hold above this line, any rally is likely to be temporary. The user’s analysis also points out a critical “line in the sand”: if the price breaks below the Gann Fan’s 1×8 angle (approx. $5.871), it could confirm the start of a bearish trend.
Synthesis Analysis & Unique Insight
The “trend divergence” between the weekly and daily charts is the core of the current analysis. The weekly chart tells us, “long-term players are accumulating, bullish for the future,” while the daily chart warns, “short-term selling pressure is significant, and a breakout is not yet confirmed.”
This situation implies the market is at a “compression point.” A healthy bullish scenario would involve the price finding solid footing at the weekly support zone (approx. $7.40 – $8.00), consolidating briefly, and then breaking out with volume above the long-term descending trendline on the daily chart. If this occurs, it would confirm the Symmetrical Triangle’s upward resolution, and the subsequent rally could be extremely powerful, with an initial target of the previous high at $12.3 and a long-term potential to challenge $19.47.
Conversely, a bearish scenario would see the price fail to hold support at the current levels and ultimately break down below the weekly ascending trendline and the Gann 1×8 line (approx. $5.871). This would invalidate the entire macro bullish structure and could send the market into a deeper, more prolonged correction.


Key Takeaways
Summary / Key Price Levels:
- Core Resistance (Must Break): The long-term descending trendline (currently around the $9.50 – $10.00 zone).
- Major Support (Must Hold): $7.408 (the previous Higher Low).
- Bull/Bear Demarcation Line: $5.871 (Gann 1×8 Fan support).
For continuous, real-time analysis of these developing market structures, visit www.chart-blitz.com.
Fundamental news tells you what happened. Technical analysis predicts what will happen. To master the professional framework that separates market signal from noise, explore our exclusive models at www.chart-blitz.com.
Sources:
- U.S. Government Shutdown Delays New Crypto ETF Approvals
- Crypto AI Sector Valuation Hits $32B as Nvidia Stock Price Taps All-Time Highs
- Bitcoin Pulls $90B Inflows, Yet Altcoins Could Lead Q4 Gains
- JPMorgan Sets Bitcoin Year-End Target of $165k, Citi Expects $133k
Unlocking Technical Analysis: Power Moves with Diagrams !
Weekly Timeframe for Uniswap (UNI)
Daily Timeframe for Uniswap (UNI)