The speculator’s chief enemies are always boring from within. It is inseparable from human nature to hope and to fear
William Delbert Gann – 1949
The undisputed star of the crypto market recently has been Zcash (ZEC). With its price skyrocketing over 50% in a single week, ZEC has not only captured headlines but also sparked heated debate about its potential to challenge industry leaders in the privacy coin sector. But behind the news hype and FOMO, the real story unfolding on the charts will determine whether ZEC’s next stop is the moon or a painful return to Earth. For investors looking to seize the opportunity without getting burned, the answer may lie in a single “magic number.”
Analysis Benchmark Statement All technical analysis below is based on a price snapshot locked in on October 31, 2025, 16:09 (UTC+8): ZEC = $380.50 USD. This price snapshot provides a stable reference for analysis. All support, resistance, and projected paths are relative to this benchmark. Market prices are highly volatile; readers should treat this report as an “analytical map,” not as real-time pricing.The Catalyst & Fundamental View (The Rear-view Mirror: Why the Hype?) Over the past 24 hours, news about ZEC has been everywhere. Crypto News Flash reported a significant surge in Zcash’s shielded supply, fueling speculation that it could challenge Monero’s dominance. Simultaneously, multiple outlets listed ZEC as a “Top Crypto Gainer.” This news successfully ignited market enthusiasm and explains the sudden influx of capital. However, as savvy analysts, we treat this as “background noise” and a “catalyst.” True directional forecasting must come from the charts.
Multi-Timeframe Technical Deep Dive (The Predictive Lens: What’s the Chart Story?)
Our core philosophy is: News tells you what to analyze, but only charts can predict the timing and manner of future moves.
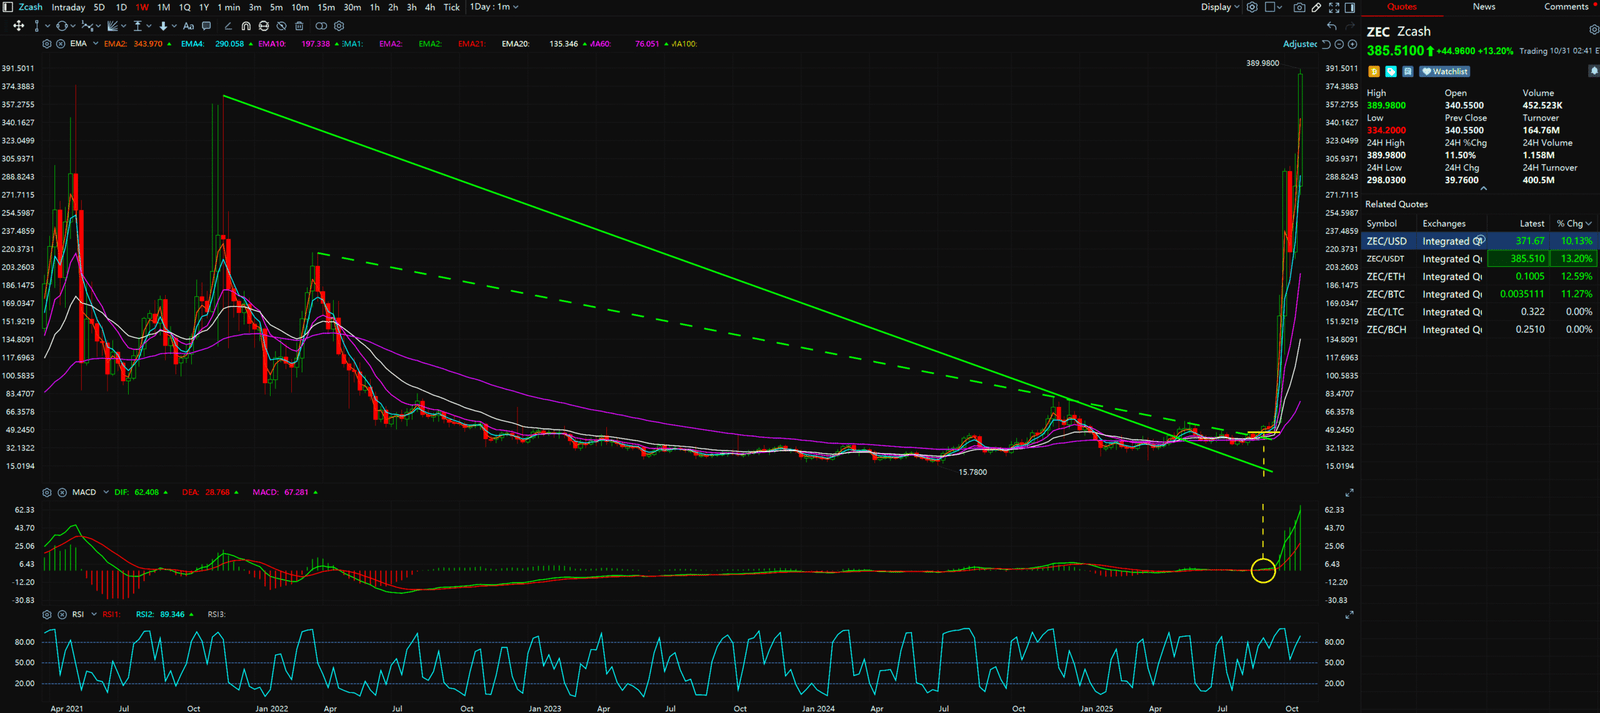
- The Weekly Chart (The Big Picture): Breaking a Two-Year Shackle From the user-provided weekly chart, we can clearly see a long-term descending trendline that has suppressed the price of ZEC since early 2022. In recent weeks, the price has powerfully broken through this “ceiling,” a profoundly significant signal of a long-term trend reversal. More importantly, the MACD indicator below shows a strong “double-bull buy signal” (with both the MACD line and signal line crossing bullishly above the zero axis), confirming the powerful momentum behind this uptrend.
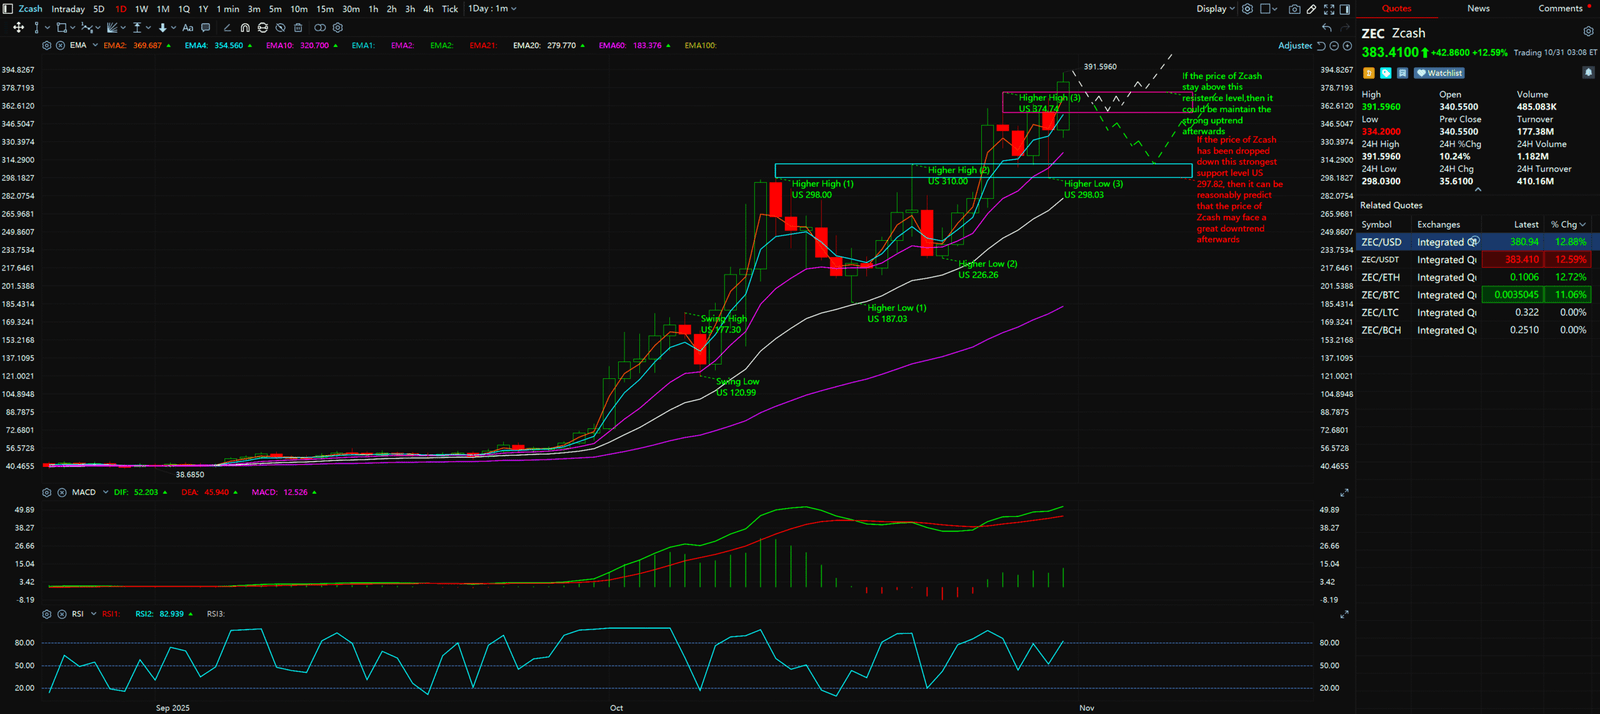
- The Daily Chart (The Tactical View): The ‘$375 Magic Number’ Switching to the daily chart allows for a more precise tactical view. The price has just broken above the previous high (around $374.74), a level we can simplify to a key psychological threshold: $375. This is our “magic number.” Based on the classic technical analysis principle of “support/resistance flip,” a strongly breached “old ceiling” is expected to become a solid “new floor.” The current script for ZEC is all about testing whether this transformation is successful.
Synthesized Analysis & Unique Insight (The Scenarios)
By combining the different timeframe analyses, we can derive two clear scenarios:
- The Bullish Scenario: If ZEC undergoes a healthy pullback in the coming days and manages to hold firm above the $375 “new floor” (e.g., showing a clear bounce after retesting it), it would serve as confirmation that the engines are fired up, paving the way for the next major leg of the rally.
- The Bearish Scenario: If ZEC unfortunately falls back below $375 and breaches the short-term support zone around $356, it would suggest the breakout was a “fakeout.” In this case, the next “ultimate line of defense” to watch would be the next major support level on the daily chart, located around $300. A break below this level would signify the uptrend has failed, warranting a strict stop-loss.


Key Takeaways
Summary / Key Price Levels:
In summary, while news hype has brought attention to ZEC, the true decision point lies on the chart. All eyes should now be on the $375 level. Its ability to successfully flip from an “old ceiling” to a “new floor” is the key to determining ZEC’s next major move.
- Key Support (The New Floor): $375 USD
- Major Support (The Ultimate Defense): $300 USD
- Upper Resistance: Having broken long-term highs, the price is now in a state of price discovery.
For continuous, real-time analysis of these developing market structures, visit www.chart-blitz.com.
Fundamental news tells you what happened. Technical analysis predicts what will happen. To master the professional framework that separates market signal from noise, explore our exclusive models at www.chart-blitz.com.
Sources:
- https://www.crypto-news-flash.com/zcash-shielded-supply-rises/
- https://crypto2community.com/crypto-news/top-crypto-gainers-today-october-30-zec-hbar-aero/
- https://beincrypto.com/zcash-price-pullback-or-breakout-next/
Unlocking Technical Analysis: Power Moves with Diagrams !
Weekly Timeframe for Zcash (ZEC)
Daily Timeframe for Zcash (ZEC)