Look for the cause. The effect will take care of itself.
William Delbert Gann – 1923
Date: Jan 01, 2026 | Time: 08:00 EST | Source: Institutional Desk
The party isn’t over; it just moved to a different room. While everyone is still staring at NVDA’s price action in awe, hesitating whether to chase at all-time highs, Wall Street’s top Algos have already quietly pivoted. Smart Money is always Pre-emptive. They don’t crowd into the exit; they find the next entrance.
The theme for 2026 is ingular: “Sector Rotation.” Capital is spilling over from the overcrowded “Tier 1” (AI Chips) and flowing into the “Tier 2” (Runner-Ups)—sectors that have been neglected by the market for two years and where valuations are compressed to the extreme. This isn’t gambling; this is the physics of Mean Reversion.
This article isn’t for retail tourists; it’s for the ambitious. I have prepared 8,000 words of Institutional Intelligence, covering 5 Rotation Sectors and 22 Relay Stocks. First, I will give you the “Macro Logic to Dominate Conversations”—read this, and you become the Cycle Expert in your circle. Then, the Charts is your hunting rifle.
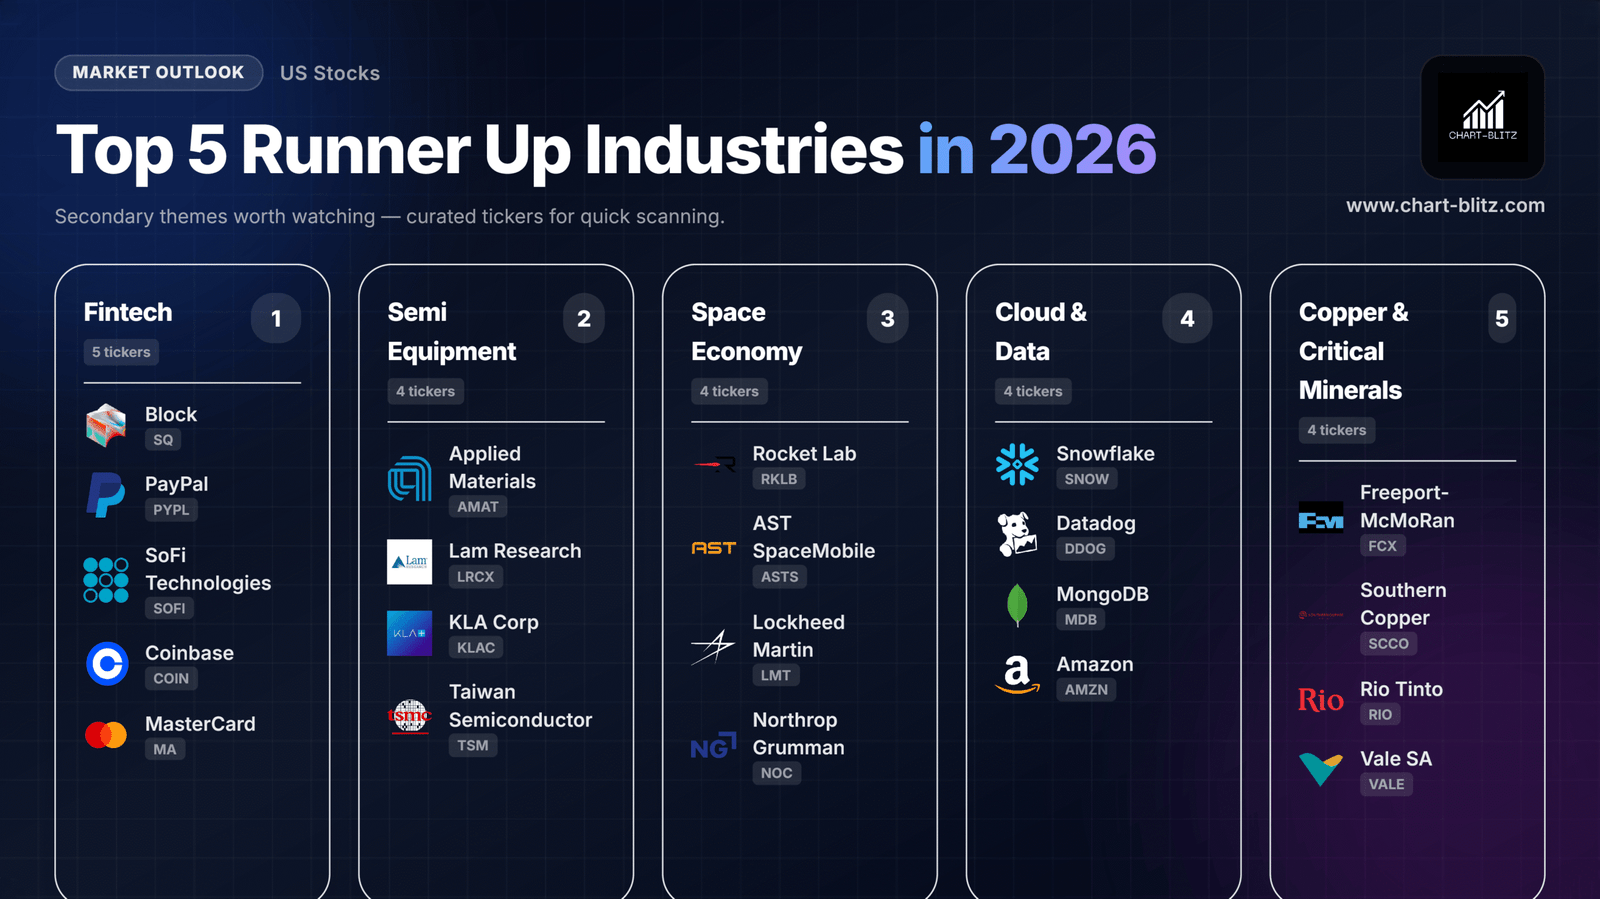
The「Tier 2」Top Pick Industry:Fintech (The Wallet)

Many believe Fintech is dead because it was slaughtered by interest rates over the last two years. But in 2026, the macro environment has pivoted 180 degrees. You need to articulate these three logical pillars:
- The Macro Pivot (Rate Cuts)
Explain this: Fintech companies are essentially “Long-duration Assets.” For the past two years, high rates crushed their valuation multiples (Multiple Compression) while increasing their cost of capital. As the Fed enters a Rate Cut cycle, two things happen: First, financing costs drop, automatically expanding Net Margins. Second, the market is willing to pay a higher P/E. This is math, not faith. - The “Super App” Convergence:
Tier 2 players (PayPal, Block) are no longer just doing payments. They are building a “Commerce Operating System.” Look at Block (Square): It integrates Merchant POS, Payroll, and Cash App (Personal Finance). This Ecosystem Lock-in is infinitely more powerful than transaction fees. Data shows that churn rates for users utilizing 3+ features are near zero. - Crypto as Rails:
This is the sexiest point. Traditional banking uses SWIFT—slow and expensive. Stripe and PayPal are now using Stablecoins (like USDC) for settlement layers. This drops Cross-border Payment costs from 3% to 0.5%. Fintech has finally found the real use case for Crypto: Not speculation, but Efficiency.
The fundamentals say “The worst is over,” but the charts say “Whales are accumulating.” These stocks have experienced deep drawdowns, so we typically see massive bottoming patterns. Do not fear the volatility at the bottom; this is Accumulation.
1. SQ (Block Inc.) – The Rounding Bottom
- Pattern: Rounding Bottom
- Chart Decode: Look at the Block chart. It was decimated previously. But in the last six months, it has carved out a standard Rounding Bottom. The moving averages (EMA 50/100) are curling up, and the EMA 200 (Yellow line) is being trampled underfoot.
- Action: As long as price holds the EMA 50, it is a Strong Buy. A breakout above the $80 neckline triggers a massive explosion.
2. PYPL (PayPal) – The Value Trap Reversal
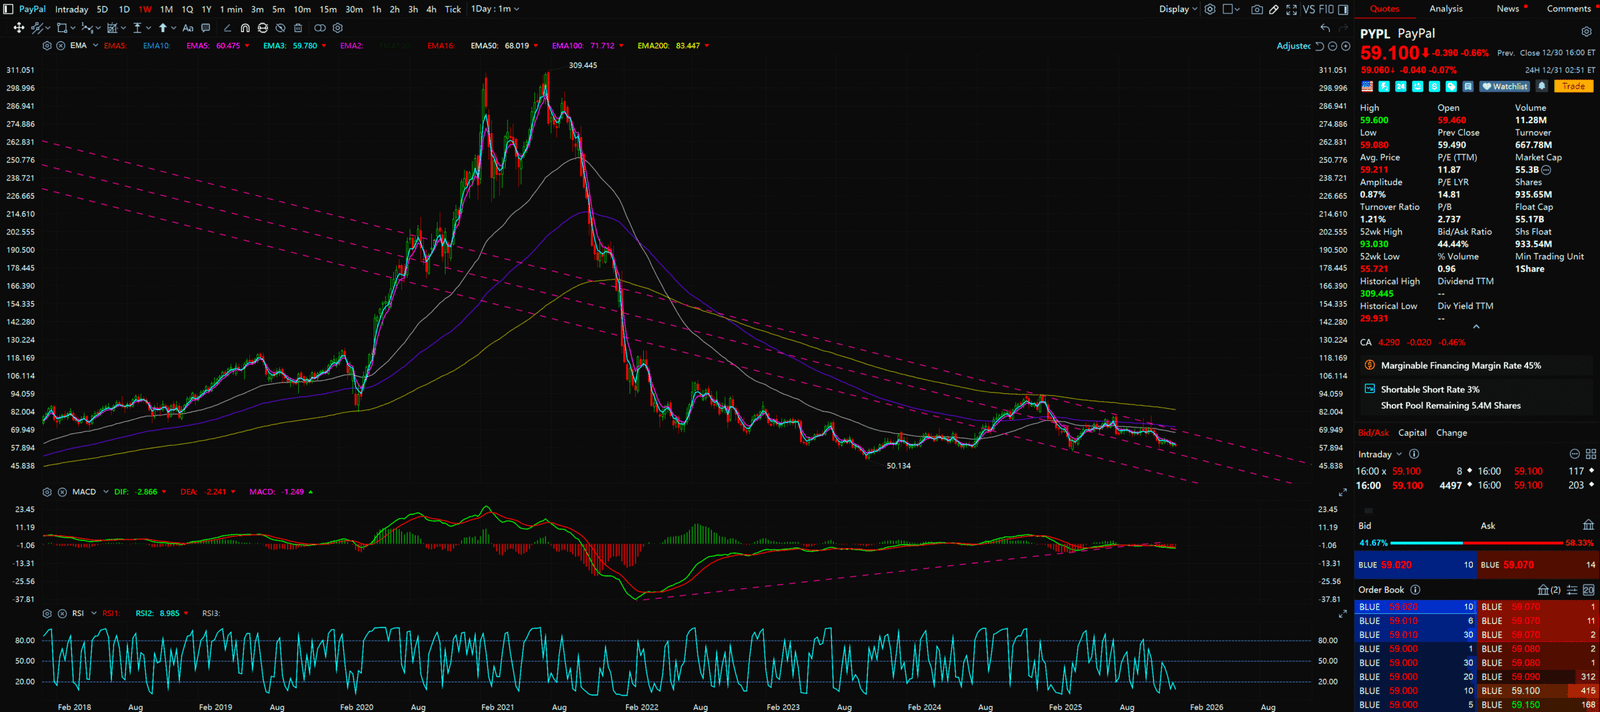
- Pattern:Double Bottom / Base Building
- Chart Decode: PYPL has been called a “Value Trap” for ages. But the chart shows a solid Double Bottom in the 55−60 zone. RSI shows Bullish Divergence—price made a lower low, but RSI made a higher low, indicating seller exhaustion.
- Action: This is a Value Play. Enter upon confirmation above the EMA 200. Target the valuation gap fill above.。
3. SOFI (SoFi Technologies) – The New Bank
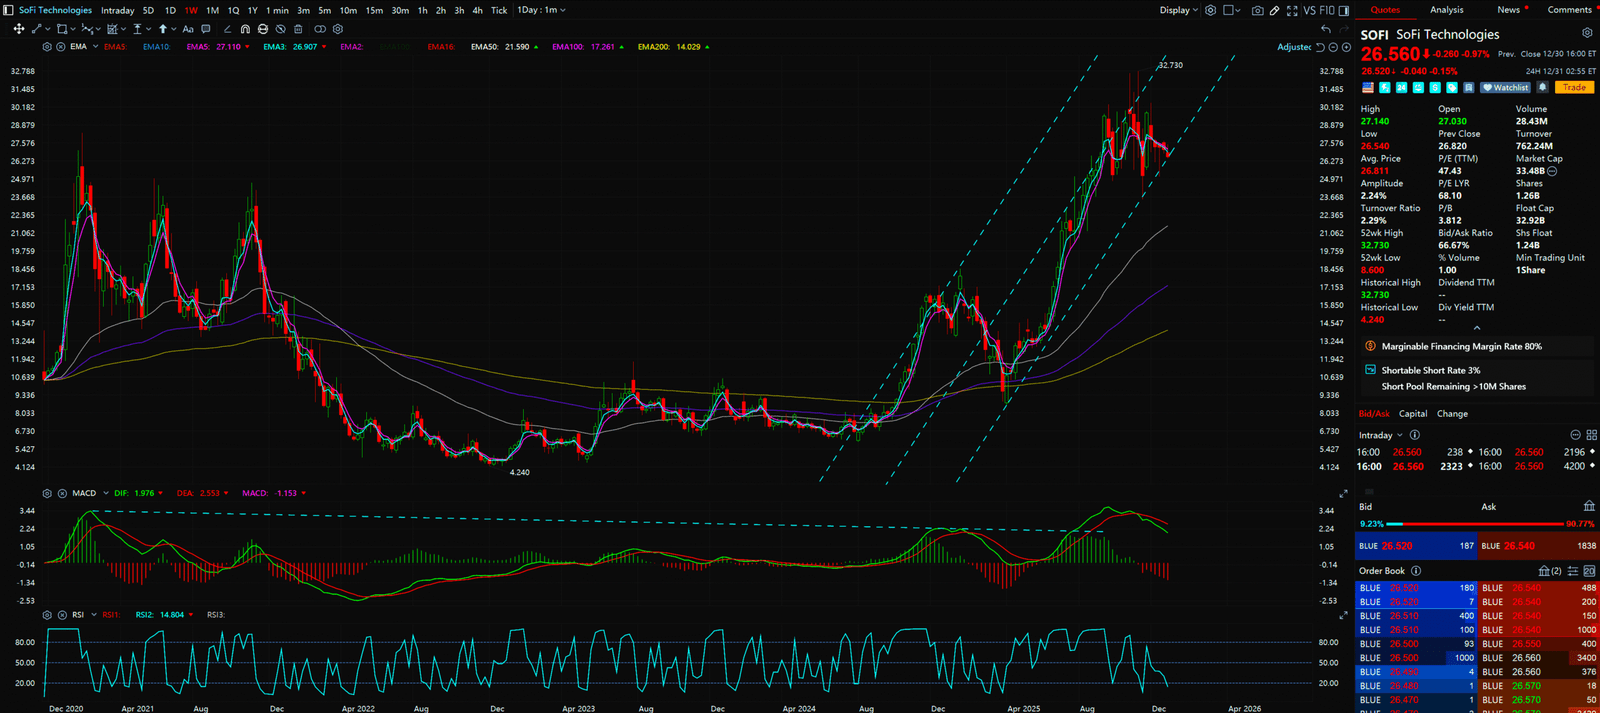
- Pattern: Ascending Triangle
- Chart Decode: SOFI is volatile, but the chart shows Higher Lows. This is a coiled Ascending Triangle.
- Action: Wait for the breakout of the $10 psychological level. Once through, there is no resistance overhead。
4. COIN (Coinbase) – The Crypto Beta
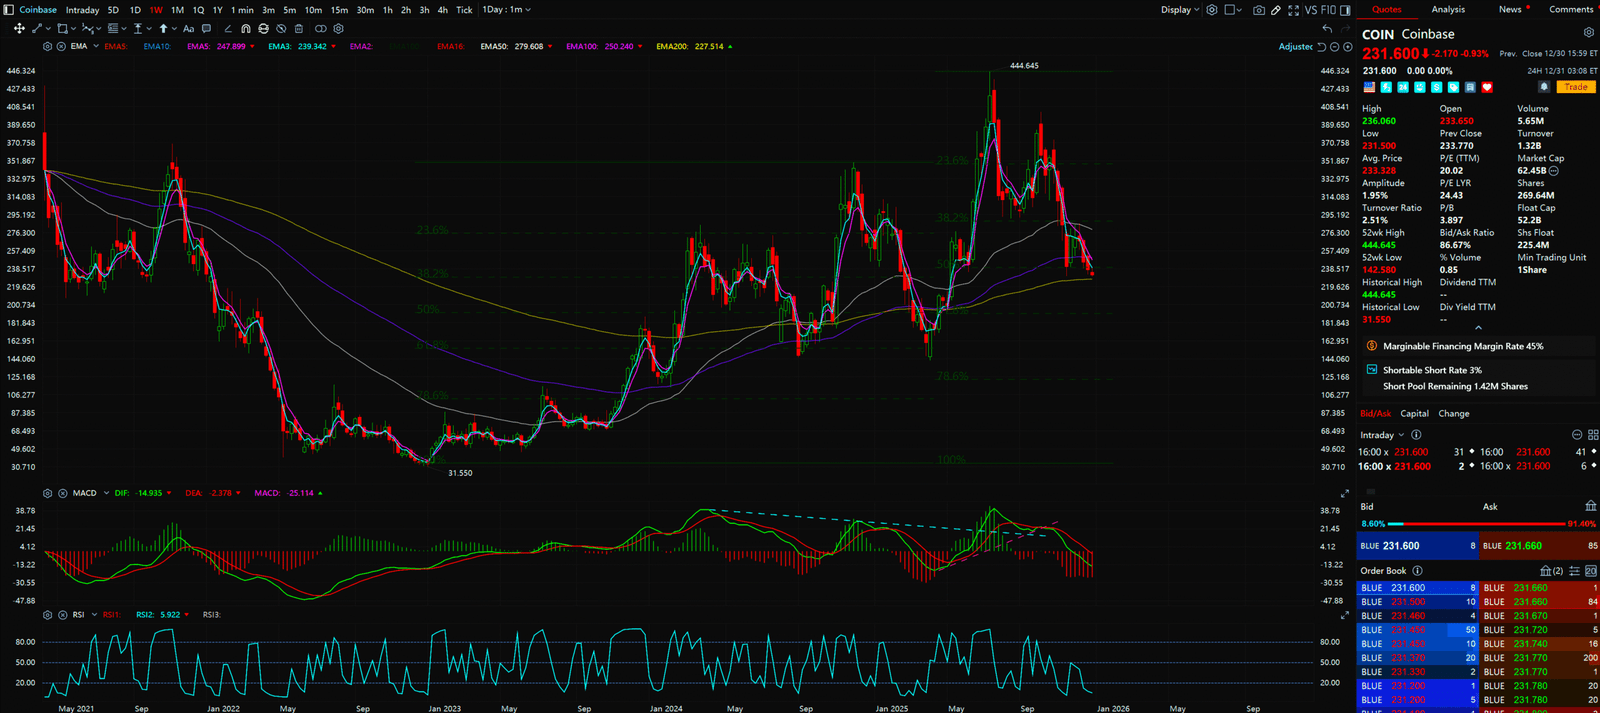
- Pattern:Volatile Bull Flag
- Chart Decode: COIN follows BTC but with higher Beta. The chart shows it consolidating in a flag pattern after a rally.
- Action: This is a High Beta trade. Buy at the bottom rail of the flag. Strict stop loss if support breaks。
5. MA (Mastercard) – The Payment Rail
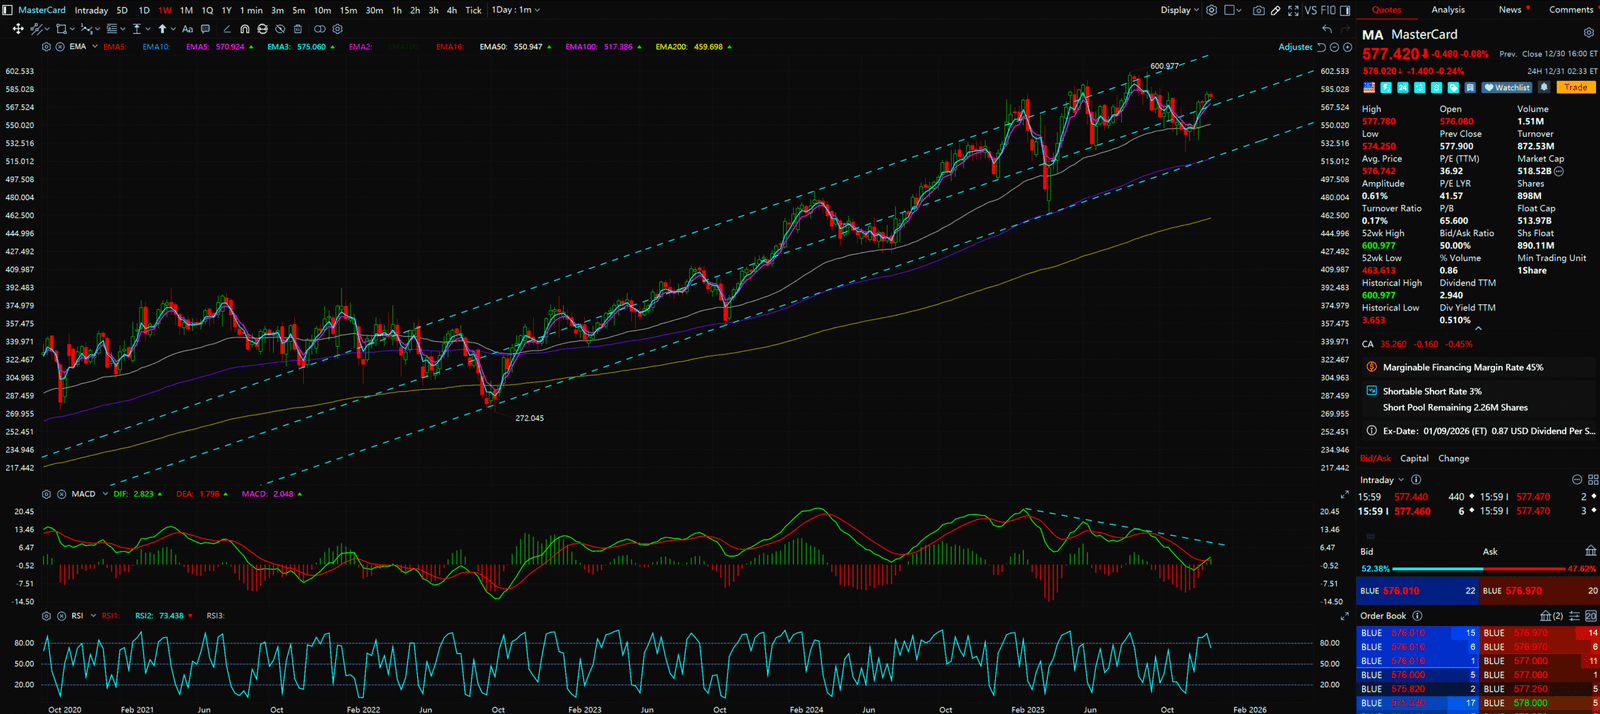
- Pattern: Steady Ascending Channel
- Chart Decode: MA is a Tier 1 leader. The chart is a perfect 45-degree ascending channel. This is defensive growth.
- Action: Trend Following. Every backtest of the lower channel rail or EMA 50 is a buy zone.
The「Tier 2」Runner-Up Industry:Semi Equipment (The Toolmakers)

If NVDA is the gold in the rush, these companies are the “Pick-and-Shovel Plays.”
You need to talk about: Sovereign AI and Tech Nationalism.
- CapEx Supercycle:
It’s not just Tech Giants buying chips anymore; it’s Nations buying Fabs. Japan, Germany, USA, Middle East—everyone is building their own domestic Fabs. Building a Fab costs billions, and 70% of that money goes to Equipment, not land. AMAT and ASML are the biggest beneficiaries. This is inelastic demand, decoupled from the consumer electronics cycle. - Technology Node Transition:
To sound like an expert, mention GAA (Gate-All-Around) and High-NA EUV. As we move from 3nm to 2nm, transistor architecture changes. This requires entirely new Etching and Deposition tools. Lam Research (LRCX) and Applied Materials (AMAT) are the Duopoly here. - Advanced Packaging (CoWoS):
AI chips aren’t just getting smaller; they are getting taller (HBM stacking). TSM’s CoWoS capacity is the bottleneck. Who provides the packaging tools? These guys again.
Equipment stock charts are generally “steadier” than chip stocks. Less mania than NVDA, more industrial strength. We are looking for Continuation Patterns—rest stops in the middle of a rally.
6. TSM (Taiwan Semiconductor) – The Foundry King

- Pattern:Ascending Channel / Cup and Handle
- Chart Decode: TSM is incredibly strong. After breaking ATH, it is backtesting. The moving averages show perfect bullish alignment.
- Action: Any pullback to the EMA 50 is an opportunity. Target market cap to challenge for Global #1.
7. AMAT (Applied Materials) – The Tool King
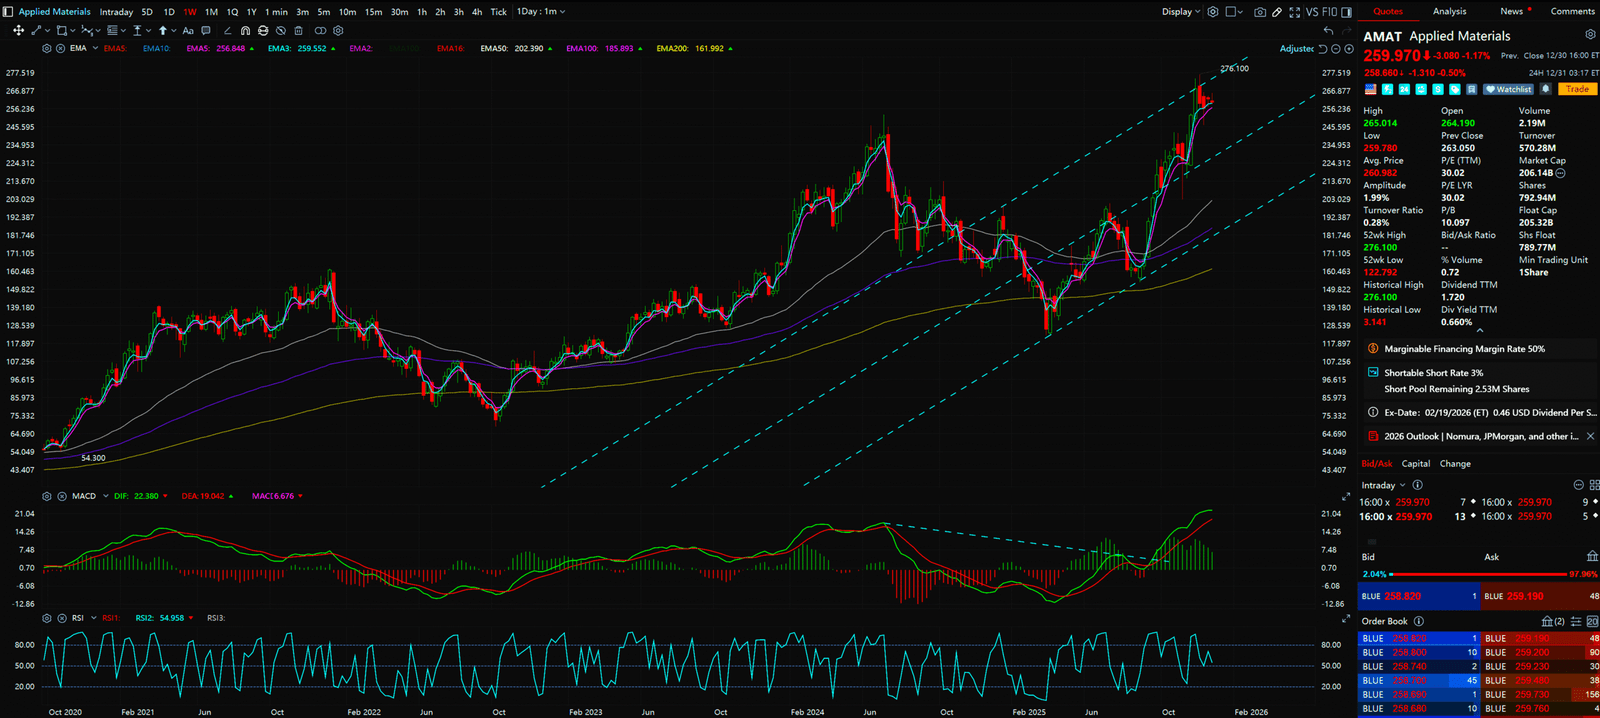
- Pattern: Bull Flag Consolidation
- Chart Decode: After a massive run, AMAT has moved sideways for months. This is digesting profit-taking. The chart shows Volume Contraction, the calm before the storm.
- Action: Buy the breakout of the box top.
8. LRCX (Lam Research) – Memory Recovery

- Pattern: Step-up Trend
- Chart Decode: Benefiting from Memory (HBM) recovery, LRCX moves in steps. Rally, then consolidate.
- Action: Accumulate at the bottom of the box, play the breakout.
9. KLAC (KLA Corp) – Yield Keeper
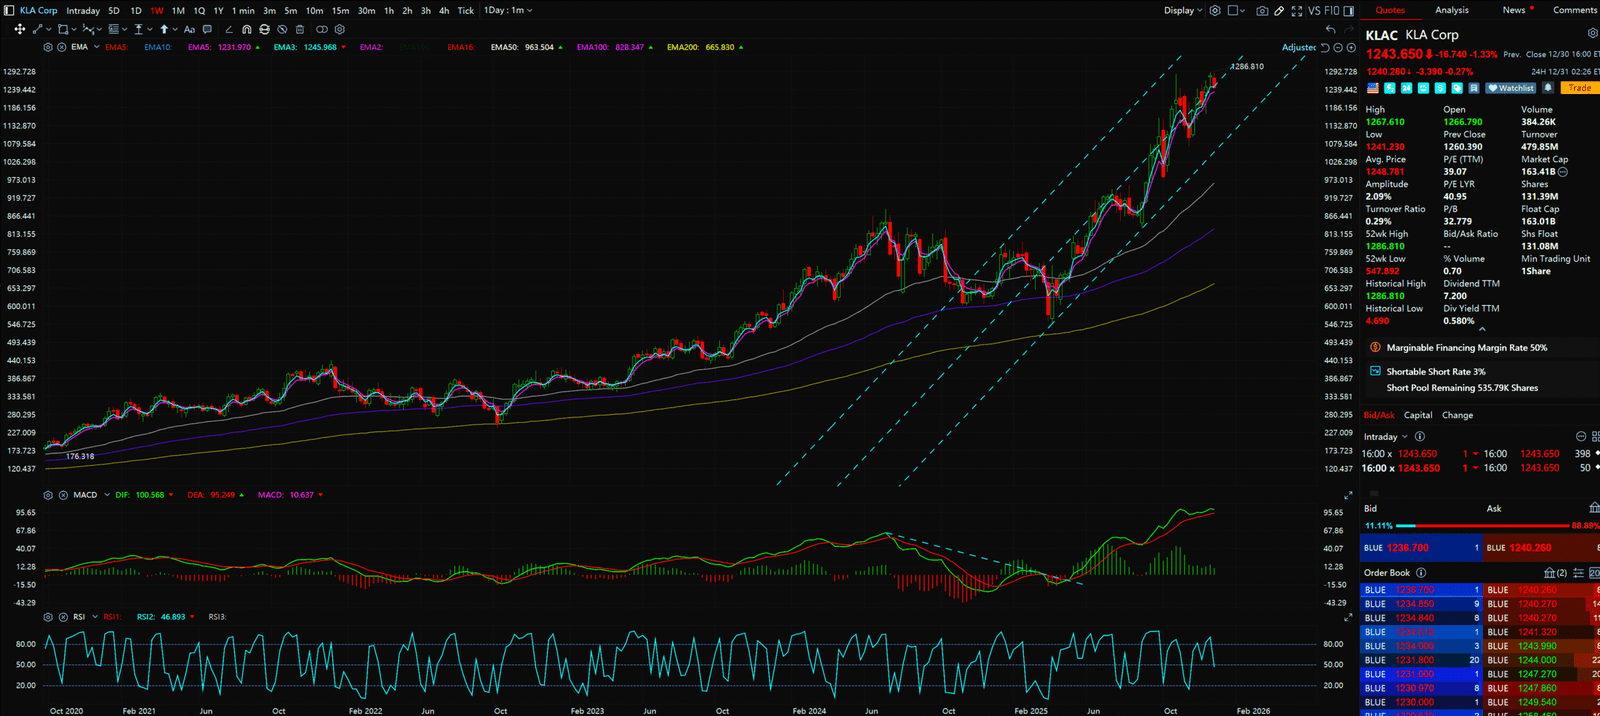
- Pattern: Linear Uptrend
- Chart Decode: KLAC rarely has deep drawdowns. It is the “Rent Collector” of semis because yield inspection tools have insane margins.
- Action: DCA (Dollar Cost Average). Hold along the long-term trendline.


The「Tier 2」Third Seed Industry:Space Economy (The Final Frontier)

Space is no longer Sci-Fi; it is the next Trillion Dollar Industry. You need to talk about: Moore’s Law for Launch Costs ($/kg).
- The Starship Effect:
SpaceX’s Starship drops launch costs from $2,000/kg to $100/kg. This means business models that were previously impossible (Space Factories, Mega-Constellations) are suddenly Economically Viable. Rocket Lab (RKLB) is the only listed competitor with a track record. It is building “End-to-End Space Services” (Build + Launch + Operate). - Space Defense:
Geopolitics has extended to orbit. The US Space Force budget is growing double-digits annually. Lockheed Martin (LMT) and Northrop Grumman (NOC) aren’t just making old missiles; they are building Next Gen Interceptors and military satellite meshes. This is the Alpha in defense budgets. - Direct-to-Cell:
AST SpaceMobile (ASTS) is doing something insane: Connecting standard smartphones directly to satellites, no ground stations needed. If it works, this is a Telecom Disruption. This is a Binary Play (Zero or 100x).
This sector is polarized. Defense (LMT) is a Slow Bull; Space Startups (RKLB, ASTS) are Raging Bulls. You need a strong stomach.
10. RKLB (Rocket Lab) – The Only Rival
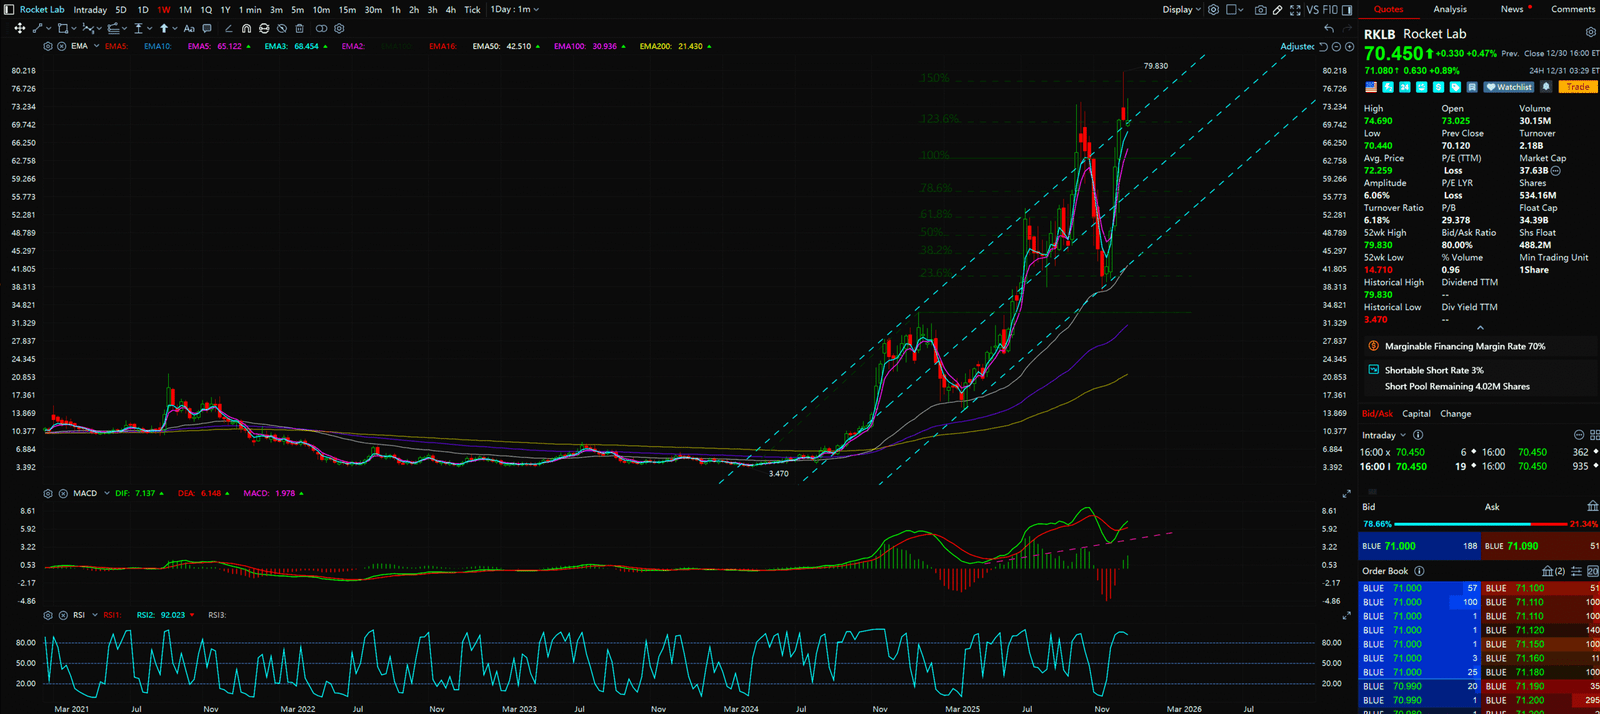
- Pattern:Parabolic Move into Correction
- Chart Decode: RKLB recently went parabolic, followed by a deep correction. This is normal. Watch for support at the Fibonacci 0.5 retracement.
- Action: Wait for a reversal signal (like a Hammer Candle) at support. Do not chase the green candles.
11. ASTS (AST SpaceMobile) – The Speculator’s Dream

- Pattern:Volatility Expansion
- Chart Decode: ASTS is news-driven. The chart shows wild swings. Support holds at key moving averages.
- Action:High Risk. Use “Play Money.” Watch for a Trendline Breakout.
12.LMT (Lockheed Martin) – The War Machine

- Pattern:Ascending Channel
- Chart Decode: LMT is steady, supported by geopolitical tension. It runs cleanly in a channel.
- Action: Defensive allocation. Buy at the lower channel rail.
13. NOC (Northrop Grumman) – Space Defense

- Pattern: Cup and Handle
- Chart Decode: NOC completed a large base and is attempting a breakout.
- Action: Chase the entry after the neckline breakout.
The「Tier 2」Fourth Contender Industry:Cloud & Data (The Brain Infrastructure)

After AI Training comes the Inference Phase. Inference needs Data. If your enterprise data is siloed, you cannot use AI.
- The Unstructured Data Explosion:
Old databases (SQL) handled tables; AI handles images, video, PDF. This requires Vector Databases and NoSQL. MongoDB (MDB) is the expert here. - Data Gravity & The Lakehouse:
Snowflake (SNOW) and Datadog (DDOG) survived the 2024 Software Recession, and valuations are compressed. Enterprises now realize that to train proprietary AI, data must be centralized in a Data Lakehouse. Snowflake’s Cortex AI allows companies to run models right next to the data. This is massive Data Gravity. - Cloud Repatriation vs. Hybrid:
Despite “Repatriation” talk, AWS (AMZN) remains King. Specifically, AWS custom chips (Trainium/Inferentia) offer cheaper compute than NVDA, attracting cost-conscious inference workloads.
SaaS charts are currently “crawling on the floor.” This is the best place for Bottom Fishing.
14. AMZN (Amazon) – The Cloud Emperor

- Pattern:Steady Uptrend / Breakout
- Chart Decode: AMZN is stronger than other SaaS. It is in an uptrend with strong moving average support.
- Action: Core Holding. Hold along the trendline.
15. DDOG (Datadog) – The Observer

- Pattern:Falling Wedge Breakout
- Chart Decode: DDOG formed a falling wedge during its correction. Recently showed breakout signals with volume.
- Action: Buy the retest of the upper wedge rail.
16. SNOW (Snowflake) – Valuation Repair

- Pattern: Double Bottom
- Chart Decode: SNOW has grinded at the lows for a long time, forming a solid W-Bottom. Buffett is still holding; why are you scared?
- Action: Breakout of the W-Bottom neckline is a strong buy signal.
17. MDB (MongoDB) – AI Database
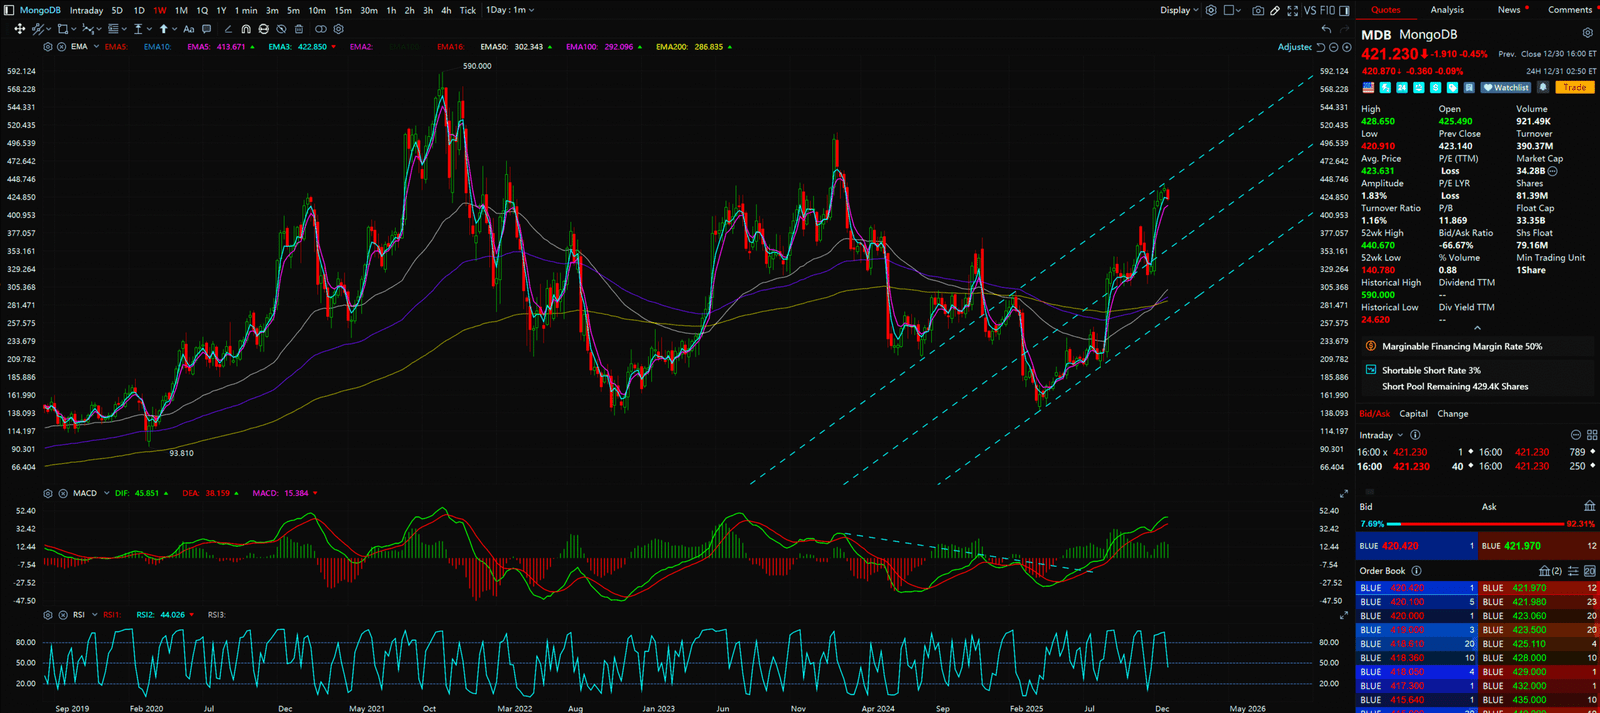
- Pattern: Base Consolidation
- Chart Decode: MDB is volatile, currently oscillating in a box.
- Action: Accumulate at the bottom of the box, play the bounce.
The「Tier 2」Final Spot Industry:The Tier 2 Final Spot
Copper is “The New Oil.” AI Data Centers and EVs are “Copper Vampires.”
- The Supply Crunch:
Quote this stat: An AI Data Center uses 2x the copper of a traditional office; an EV uses 4x the copper of an ICE car. But on the supply side, mines in Chile and Peru face Ore Grade Decline. We are digging more dirt to get less metal. - No New Mines:
It takes 15 years to open a new mine (Exploration, Permitting, Construction). Due to ESG pressure, miners have Under-invested for a decade. This means a mathematically unavoidable Supply Deficit in 2026. Goldman Sachs predicts Copper needs to hit $12,000/ton to incentivize new supply. - Strategic M&A:
BHP trying to buy Anglo American was the precursor. Giants (Rio Tinto, Vale) have cash, and they know they can’t dig fast enough, so they must Buy. Tier 2 miners (FCX, SCCO) are prime targets.
Commodities are Cyclical. Once a trend forms, it lasts for years. On the charts, we respect the Long-term Moving Averages.
18. FCX (Freeport-McMoRan) – Pure Play Leader

- Pattern:Ascending Channel
- Chart Decode: FCX is most sensitive to copper prices. The chart runs in a wide ascending channel.
- Action: Buy near the lower channel rail or EMA 200. This is a long-term hold.
19. SCCO (Southern Copper) – Reserve King

- Pattern: Trend Acceleration
- Chart Decode: SCCO is steeper than FCX because it holds the world’s largest copper reserves.
- Action: Do not chase. Accumulate on pullbacks to the EMA 20.
20. RIO (Rio Tinto) – Diversified Giant
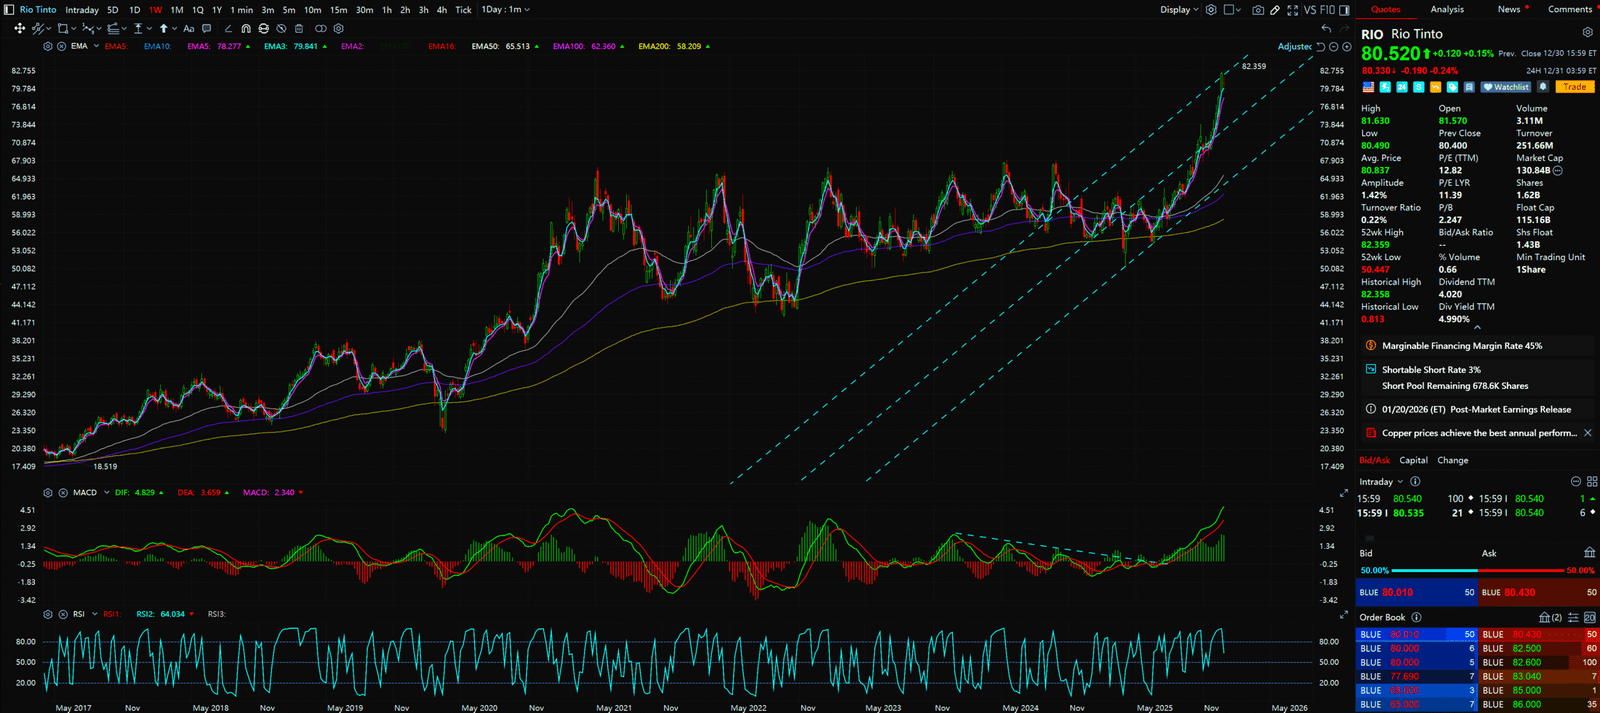
- Pattern: Range Bound to Breakout
- Chart Decode: RIO is steadier. It is breaking out of a long-term range.
- Action: Buy the breakout confirmation. Enjoy the high dividend.
21. VALE (Vale SA) – Value Pocket

- Pattern: Recovery from Lows
- Chart Decode: VALE is relatively low. The chart shows bottoms are rising.
- Action: Value investment choice. Good for contrarians.
Conclusion: Other Prey in the Forest (The Close)
After seeing these 5 Sectors and 21 Charts, you should understand: NVDA is not the only game in town. There is plenty of other prey in the forest. The Fintech repair, the Semi Equipment necessity, the exponential growth of Space, the value return of Cloud, and the Copper supply crunch. 2026 is a Stock Picker’s Market. Don’t be the last one holding the bag. Be the smart hunter. Position yourself early.
🔥 Want the Chart-Blitz Team’s list of the “Top 5 Undervalued Niche US Stocks for 2026”?
👉 Visit Top 5 Undervalued Niche US Industries for 2026 now to explore our proprietary trading models!
References:
- Morgan Stanley, “2026 REIT Outlook: The Great Repricing”.
- Goldman Sachs, “Powering AI: The Natural Gas Opportunity”.
- PBOC & Bloomberg, “China Market Liquidity Report 2025”.
This content is for educational and entertainment purposes only and does not constitute financial advice. Investing involves risk. The author may hold positions in the securities mentioned. Do Your Own Research (DYOR).