Fetching Live Market Data...
When you make a trade, you should have a clear target of where you expect to get out
William Delbert Gann – 1949
Bitcoin is not being tested by the headline. The headline is being tested by the chart.
The latest move back above $80,000 has created the type of emotional compression that attracts young traders: ETF inflows improve, the tape turns green, short positions are forced to cover, and social feeds begin to frame the move as the next bull-market leg. The professional question is colder. Can BTC reclaim resistance, hold it after the first burst of buying, and print a higher high without depending on another headline?
【📊Analysis Baseline Statement】
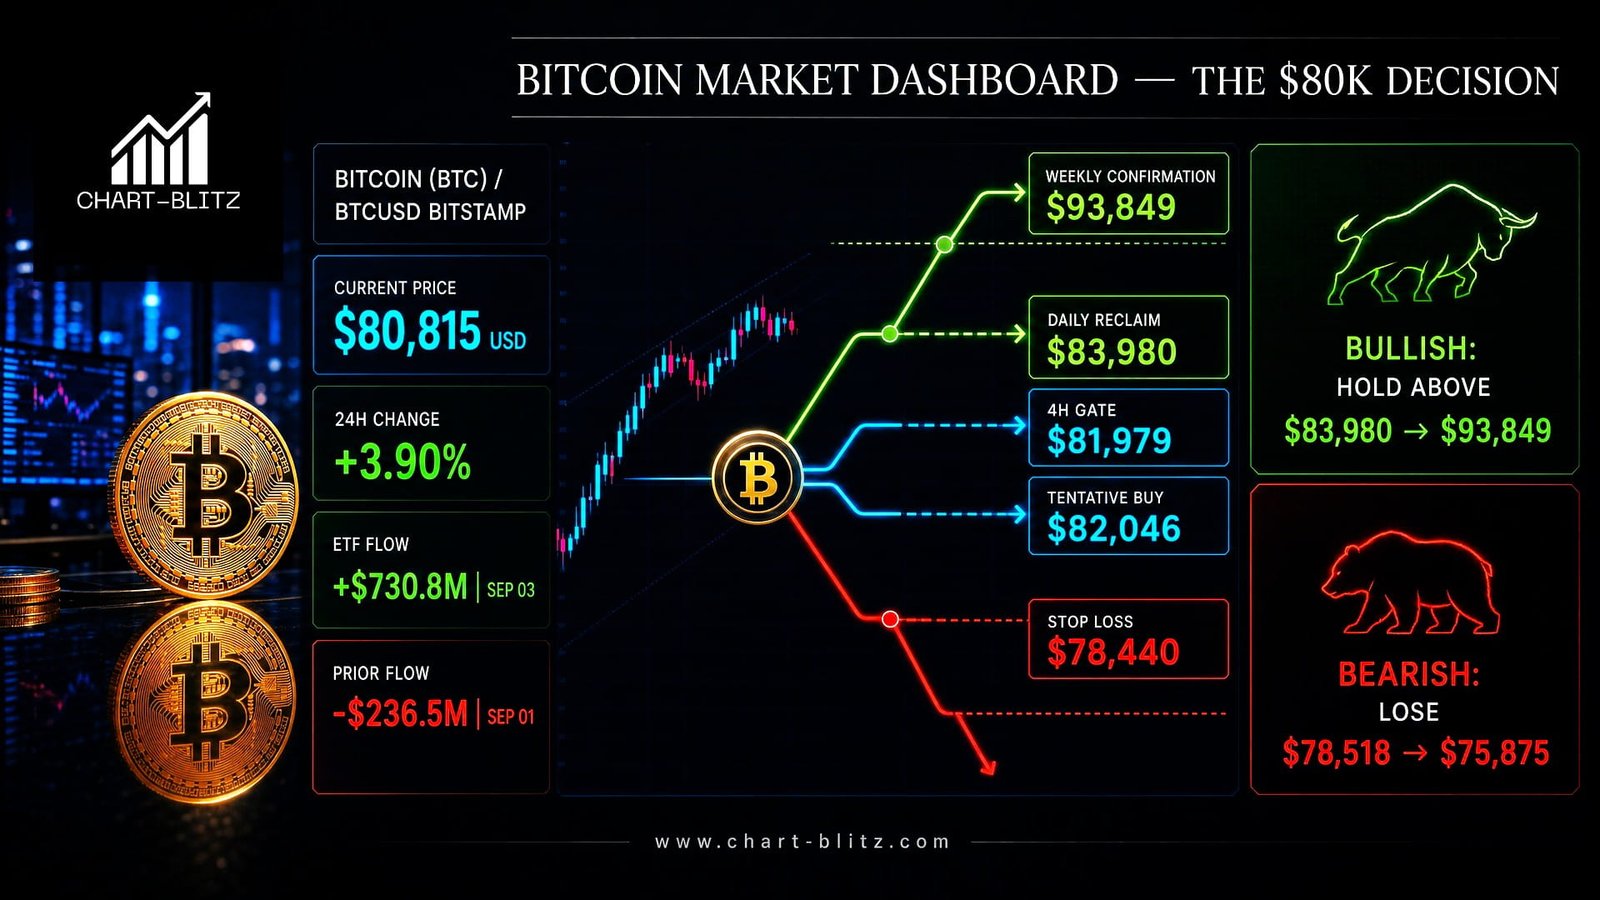
All technical analyses below are based on the price snapshot locked on September 04, 2026 (EST): 02:21 Bitcoin (BTC) = $80,917 USD. Please treat this report as an “analytical map” rather than a real-time quote.
Farside’s table showed +$730.8m in total US spot BTC ETF flows on September 3, after +$101.1m on September 2, but that came after -$236.5m on September 1. The flow is constructive, but it is not yet a straight-line demand signature. Bloomberg/Yahoo also described uneven US demand, a persistently negative Coinbase premium, and possible long-holder supply in the $83,000–$86,000 region.
That is the central conflict. News supplies the subject; price structure supplies the timing and method. In a bank dealing room, a large flow ticket is not automatically a clean trend signal. It is a clue about inventory, urgency, and who may be forced to transact next. ETF flow can ignite a squeeze, but only closing-price acceptance can repair a damaged market structure.
📈 Weekly: The Rebound Still Faces the Lower-High Test
The weekly chart carries the highest authority. The visible structure marks a Swing High at $125,725, a Swing Low at $107,389, then Lower High (1) at $97,939, Lower High (2) at $82,833, and lower-low references around $80,573, $62,525, and $58,035. That sequence matters more than the emotional size of the rebound. A market that continues to speak in lower highs and lower lows has not yet issued a trend-reversal certificate.
Weekly Timeframe for BTC (Bitcoin)
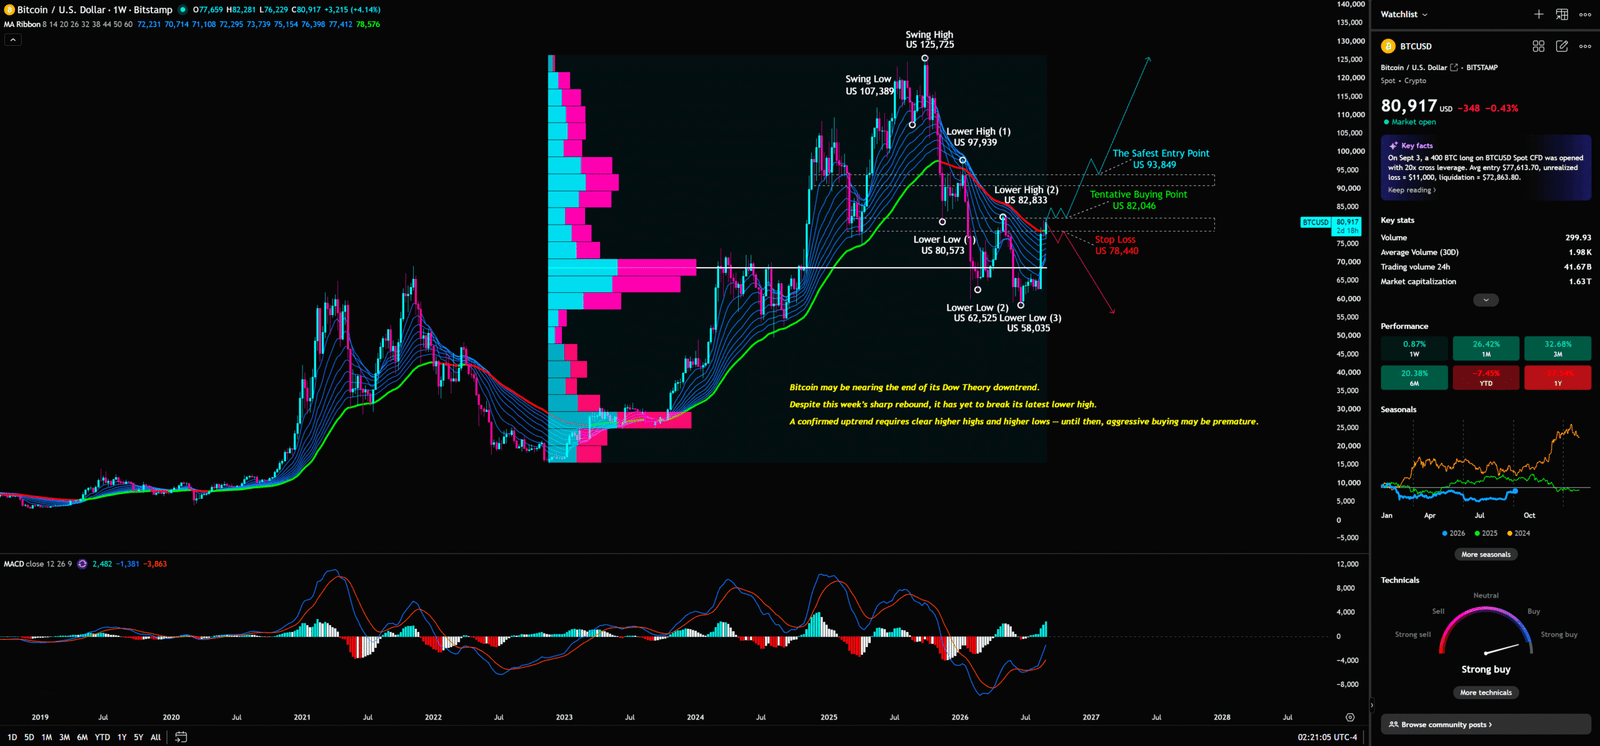
Dow Theory defines an uptrend through higher highs and higher lows, and a downtrend through lower highs and lower lows. On a weekly timeframe, this framework filters out intraday noise and forces the analyst to identify whether capital is actually repairing structure. BTC must do more than trade near $80,000. It must reclaim the lower-high supply map and defend it after the first wave of buying fades.
VPFR, or volume profile visible range, distributes traded volume by price rather than by time. Its value here is institutional: it identifies where the market accepted inventory and where price travelled through thinner liquidity. A high-volume node can behave like an area of negotiation; a vacuum zone can allow price to travel quickly, but fast travel is not the same as durable acceptance. A positive headline pushing price through a thin zone can become exit liquidity for earlier holders and an entry trap for late buyers.
The weekly chart also displays a MACD 12,26,9. MACD compares two exponential moving averages and tracks their difference against a signal line, with the histogram showing changes in momentum. The histogram’s recovery from negative territory says that downside velocity has moderated and rebound momentum has improved. It does not say the lower-high sequence has disappeared. Capital behaviour is consistent with short covering and tactical buying. Retail may read the improving histogram as a full reversal. Institutions can use that improving momentum to pull liquidity toward overhead resistance.
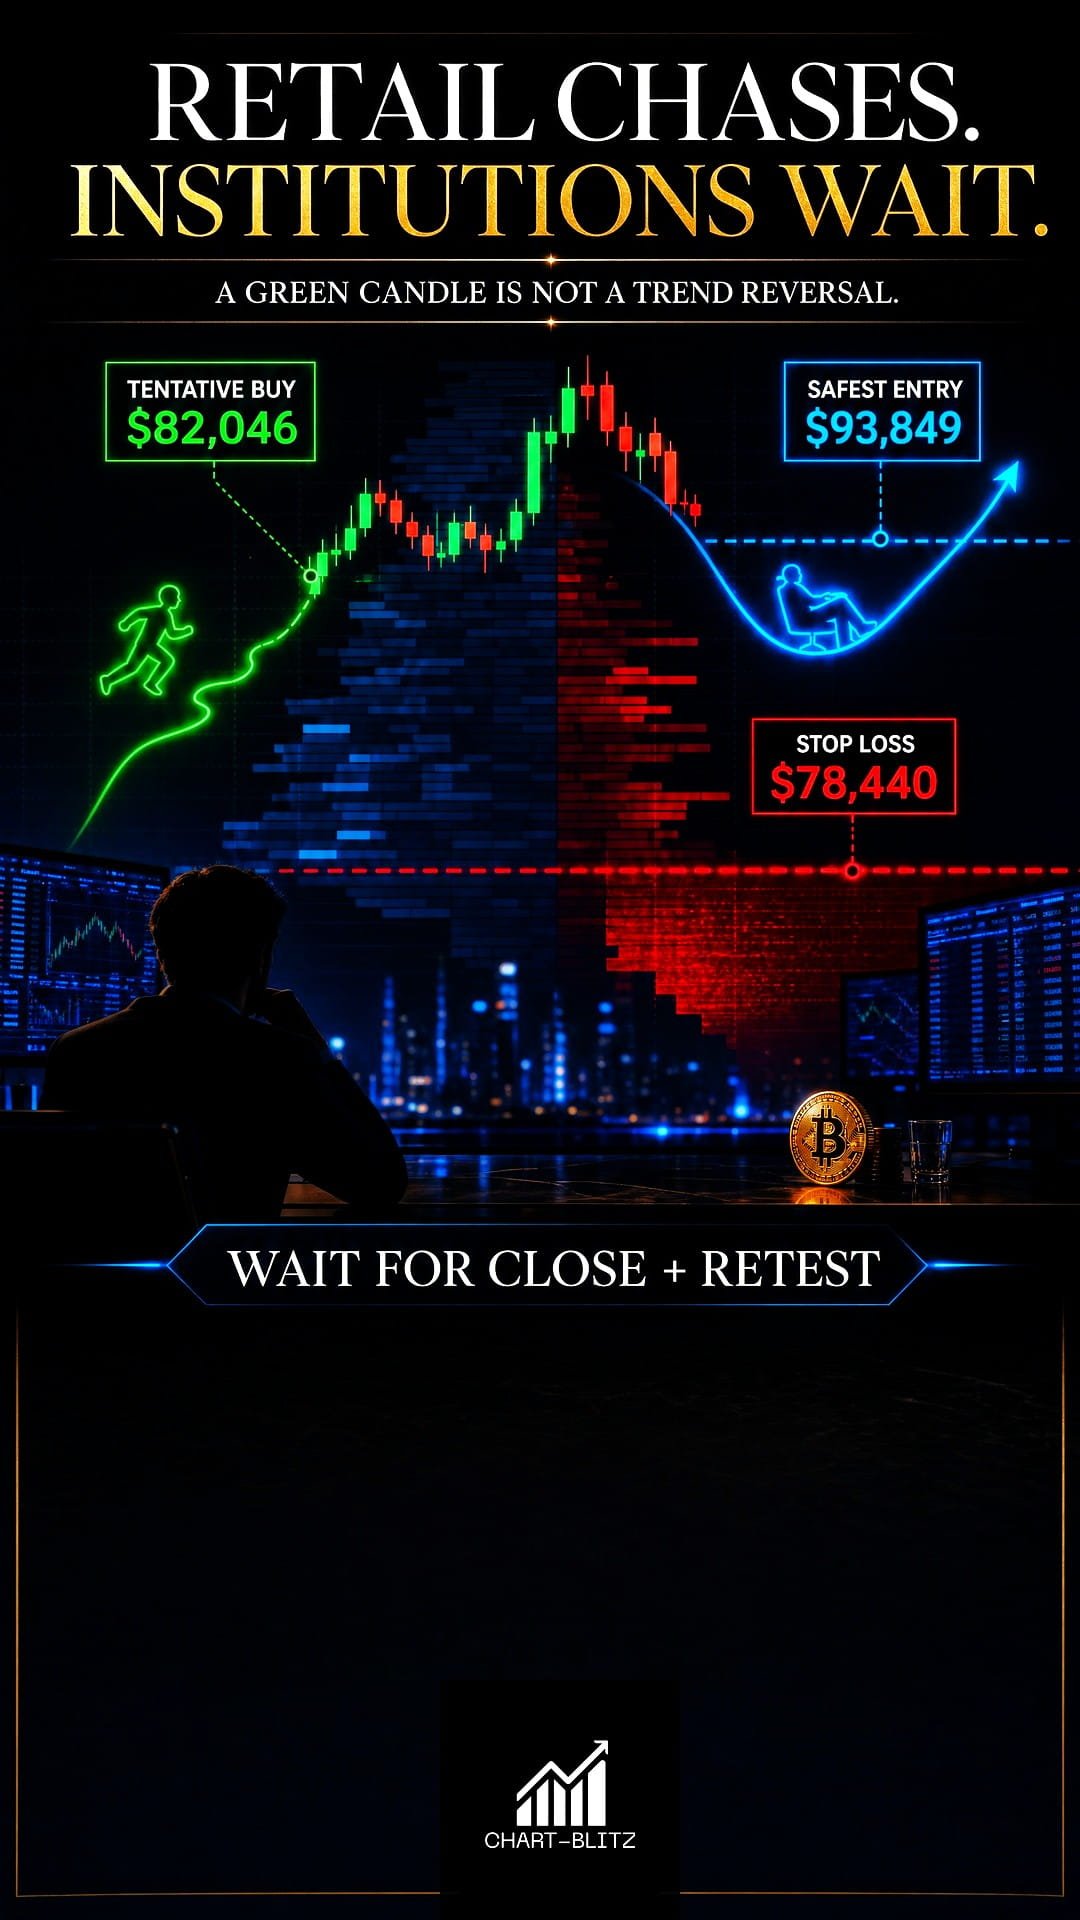
The marked decision map is unusually clear: Tentative Buying Point $82,046, The Safest Entry Point $93,849, and Stop Loss $78,440. Theoretically, BTC’s downtrend is not fully over. If price turns upward and breaks through resistance, the market must prove that the breakout can hold before a long position becomes rational. If the stop-loss logic is reached, the correct response is to exit, not to negotiate with the chart.
Weekly answer: money is testing supply, not confirming a completed bull trend; retail mistakes a rebound for a confirmed low; institutions can use the tentative-buy area and the stop-loss area as two-sided liquidity. A bullish trigger is a close above resistance followed by a successful hold. A bearish invalidation is a loss of $78,440, reopening the path toward the lower structural references.

📊 Daily: $83,980 Is the Reclaim Test
Fibonacci retracement divides a defined swing into proportional levels to frame possible retracement and reaction zones. The newer daily structure visibly marks 0.236 near $100,131, 0.382 near $83,980, 0.5 near $70,925, and 0.618 near $57,872, alongside older swing references. At approximately $80,815, BTC is close enough to $83,980 for the level to become a market test rather than a decorative line.
Daily Timeframe for BTC (Bitcoin)
A daily close above $83,980 followed by a successful retest would open the path toward $93,849 and potentially $100,131. A rejection around $83,980 followed by a loss of $70,925 would downgrade the bounce into a range-bound countertrend move. The difference is not the first candle through resistance. The difference is whether buyers remain after the breakout audience has already arrived.
The daily MACD tracks medium-term momentum; the MA Ribbon acts as a moving cost-band made from multiple averages. Retail often treats a moving-average cross as a button. Institutions treat the ribbon as inventory geography: price above a rising ribbon improves the average cost profile, while a decisive loss of the ribbon can turn previous buyers into forced sellers.
Daily answer: capital needs to reclaim $83,980 before the rebound can earn a higher target; retail mistakes a Fibonacci line for an automatic floor; institutions can use the first breakout and retest to separate genuine demand from FOMO. Bullish confirmation is a daily close and hold above $83,980. Bearish invalidation is a loss of $70,925. Inside the band, the correct label is neutral.
📉 Monthly: Momentum Is Recovering, Structure Is Still on Bail
Bollinger Bands combine a moving average with standard-deviation bands to measure relative price location and volatility expansion or contraction. The monthly chart shows a substantial rebound from a deep pullback, with price still below the upper distribution area. The upper band sits broadly near the higher $120,000 region and the middle band around the high-$80,000 to low-$90,000 area, but exact band values are not fully confirmed from the screenshot and should not be treated as hard levels.
Monthly Timeframe for BTC (Bitcoin)
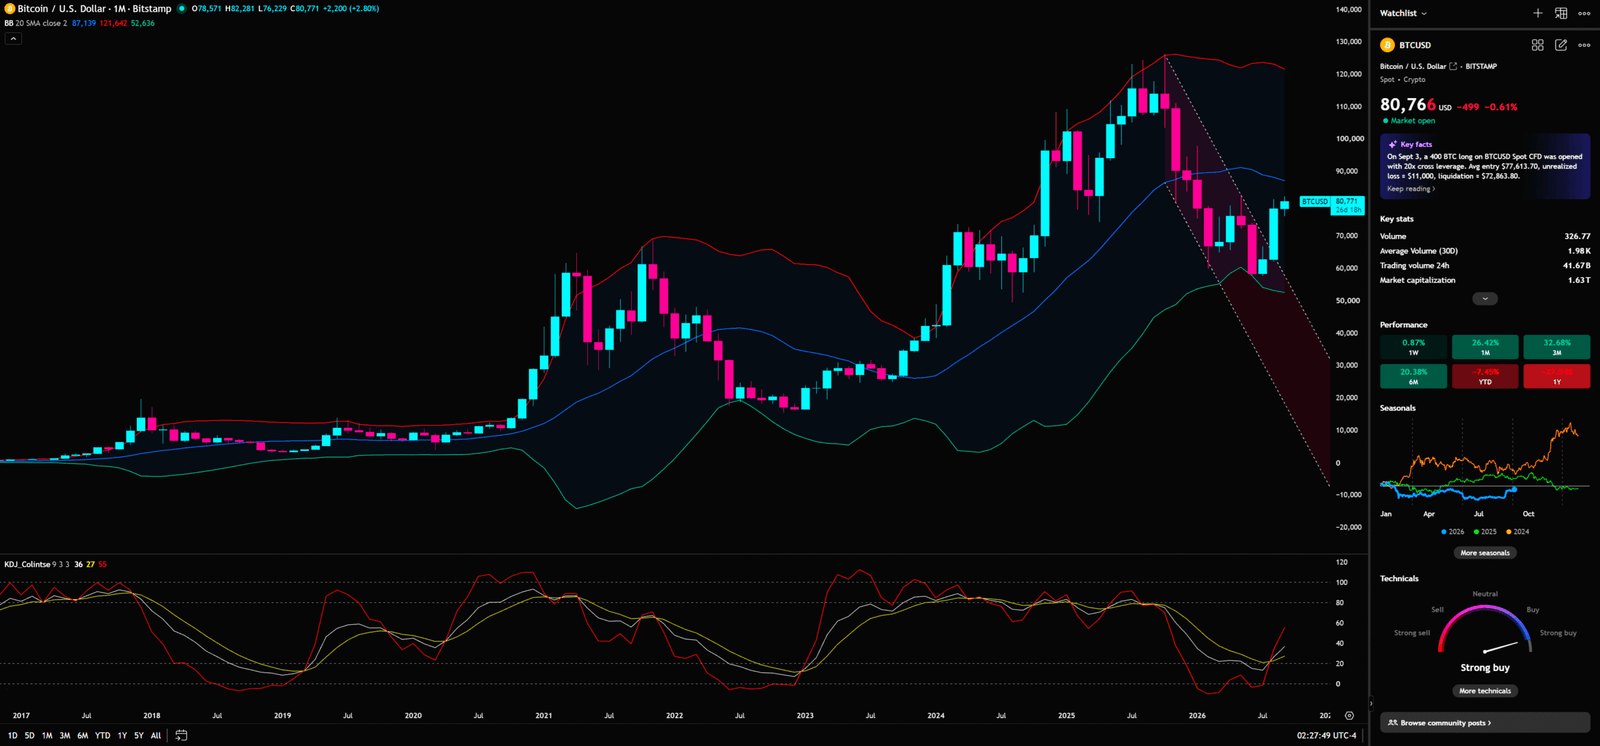
KDJ compares the close with a recent high-low range through K, D, and J lines. Its recovery from a depressed area suggests that long-cycle selling pressure may be easing. It does not guarantee a secular reversal. Long-duration allocators may rebuild exposure gradually, while distribution desks can use improving momentum to attract late buyers into upper-band supply.
The monthly constraint is simple: the long-term chart must support the weekly repair. A monthly rebound below major resistance is still a repair attempt. A bullish monthly scenario requires consecutive closes that reclaim the middle-band path and begin to sustain acceptance. A bearish scenario is a failed rebound followed by renewed volatility expansion. Neutrality is momentum recovery without structural acceptance.
Monthly answer: allocation capital is testing repricing, not declaring a completed cycle; retail treats low-level momentum as a guaranteed discount; institutions use volatility to match buyers and sellers. The monthly chart cannot overrule the weekly lower-high sequence.
📐 4-Hour: $81,979 Is the Execution Gate
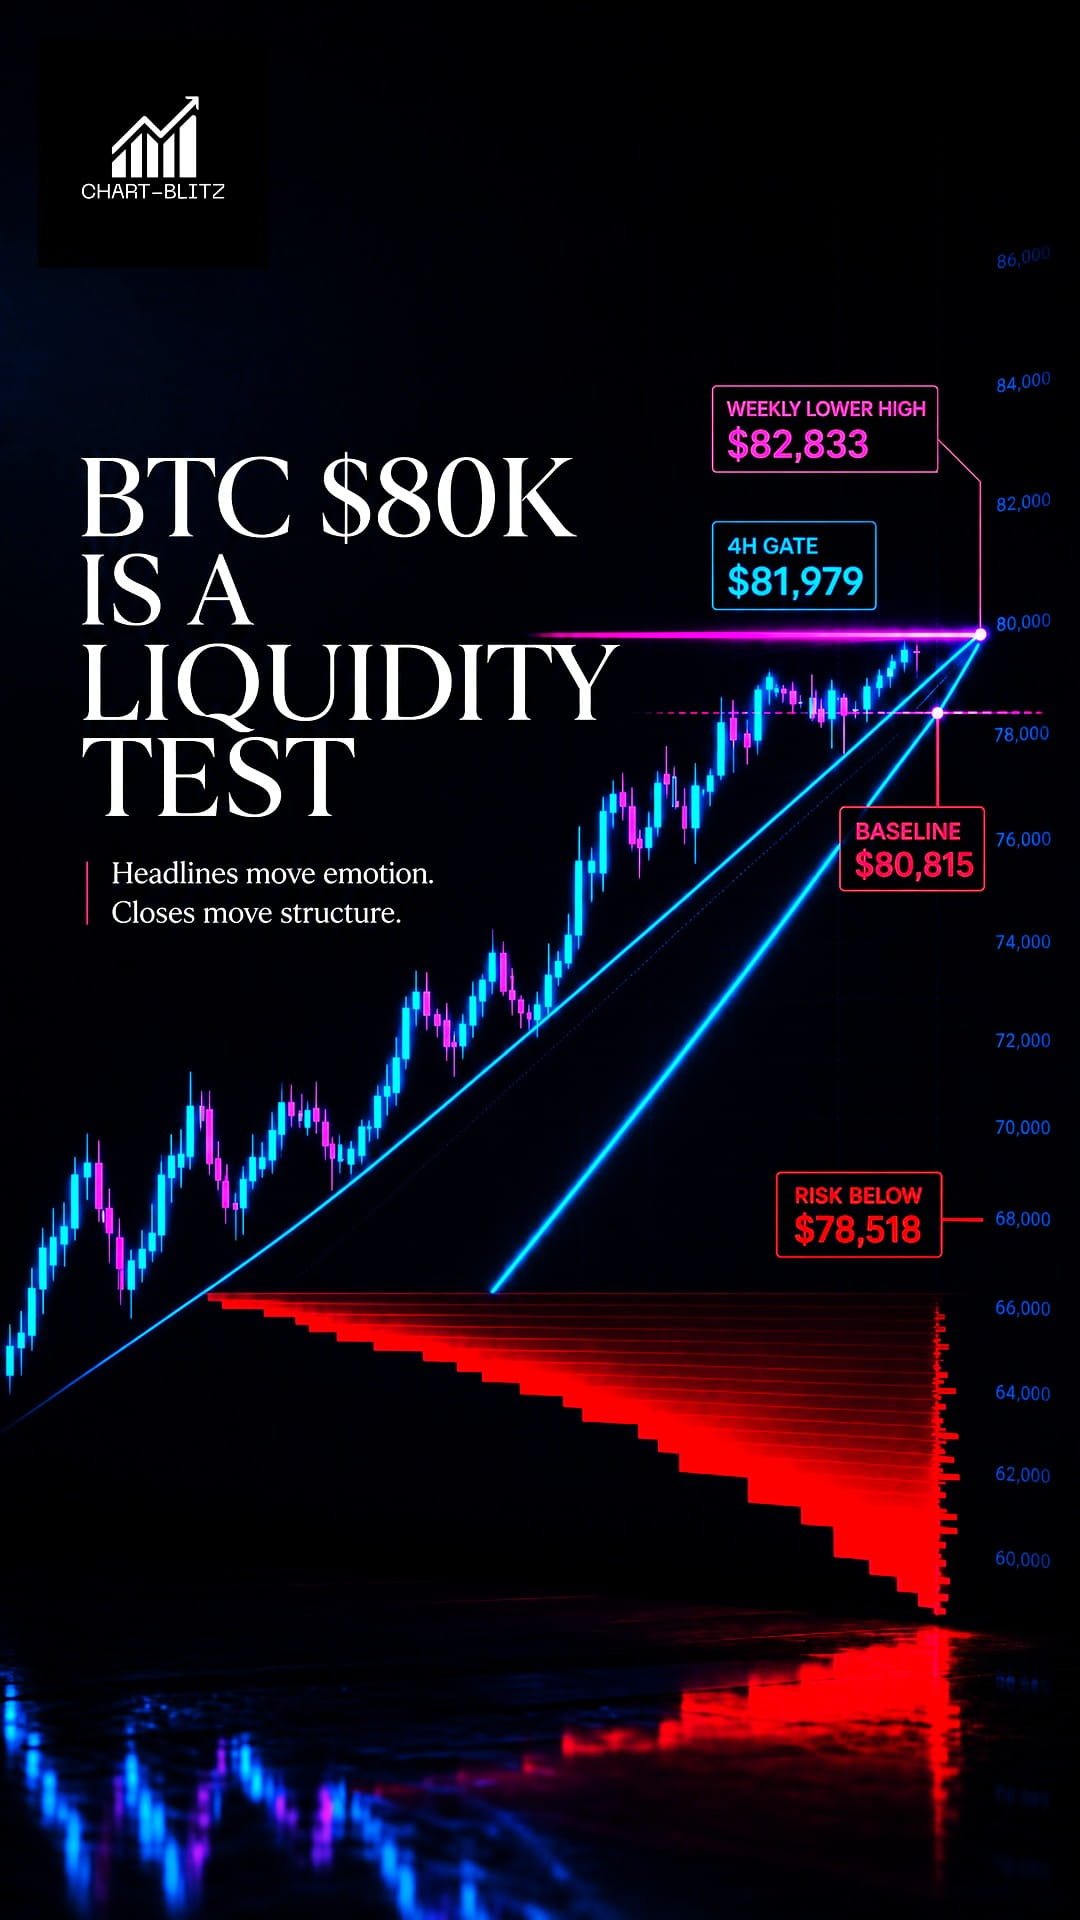
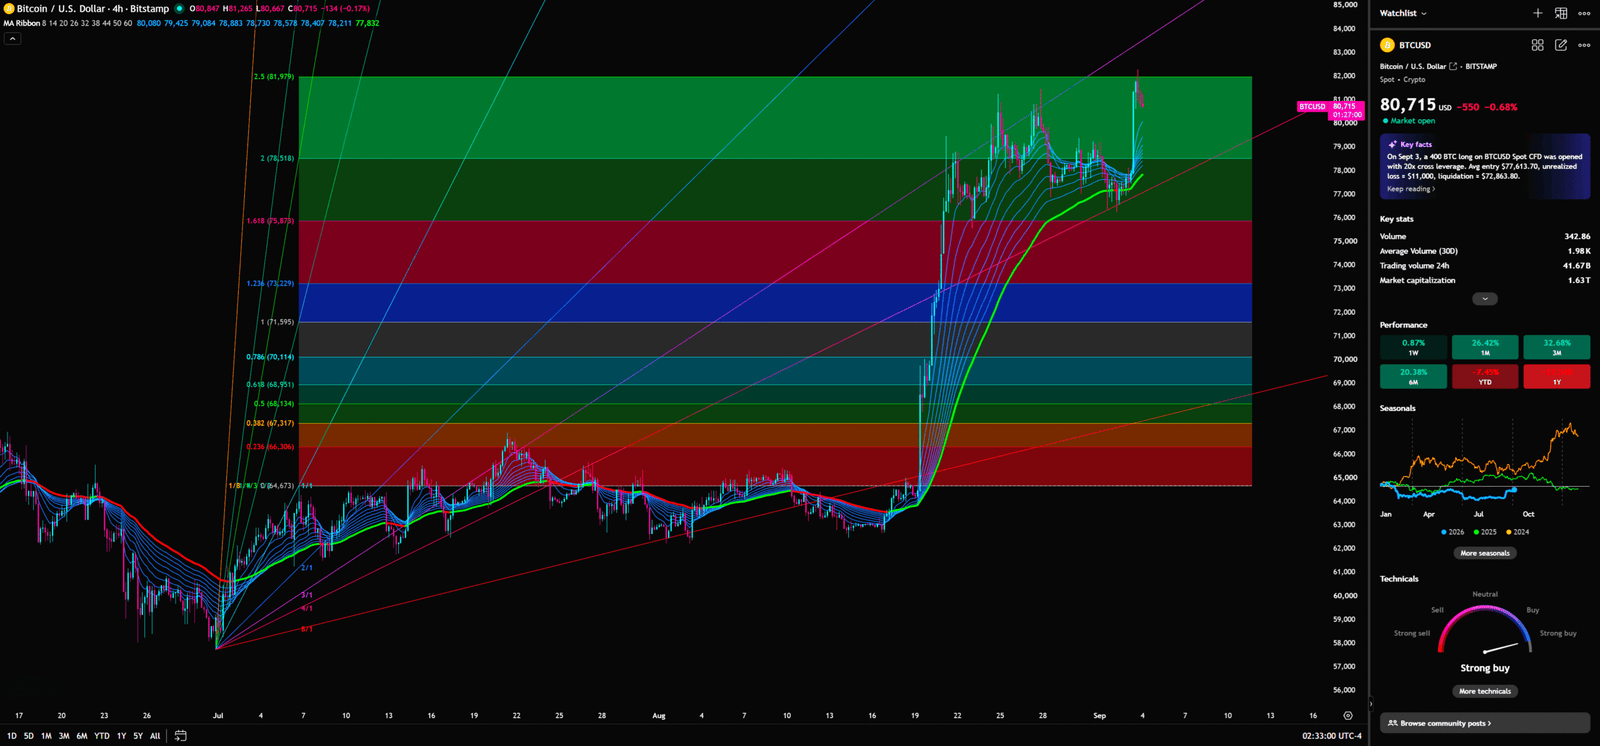
The 4-hour chart contains a moving-average ribbon, Fibonacci zones, diagonal trend guides, and Gann-style geometric lines. The visible levels include $81,979, $78,518, $75,875, $73,229, $71,595, $70,114, $68,951, $68,134, $67,317, $66,308, and $64,573. With BTC around $80,815, $81,979 is close enough to trigger aggressive breakout orders and close enough to fail into a trap.
4-Hour Timeframe for BTC (Bitcoin)
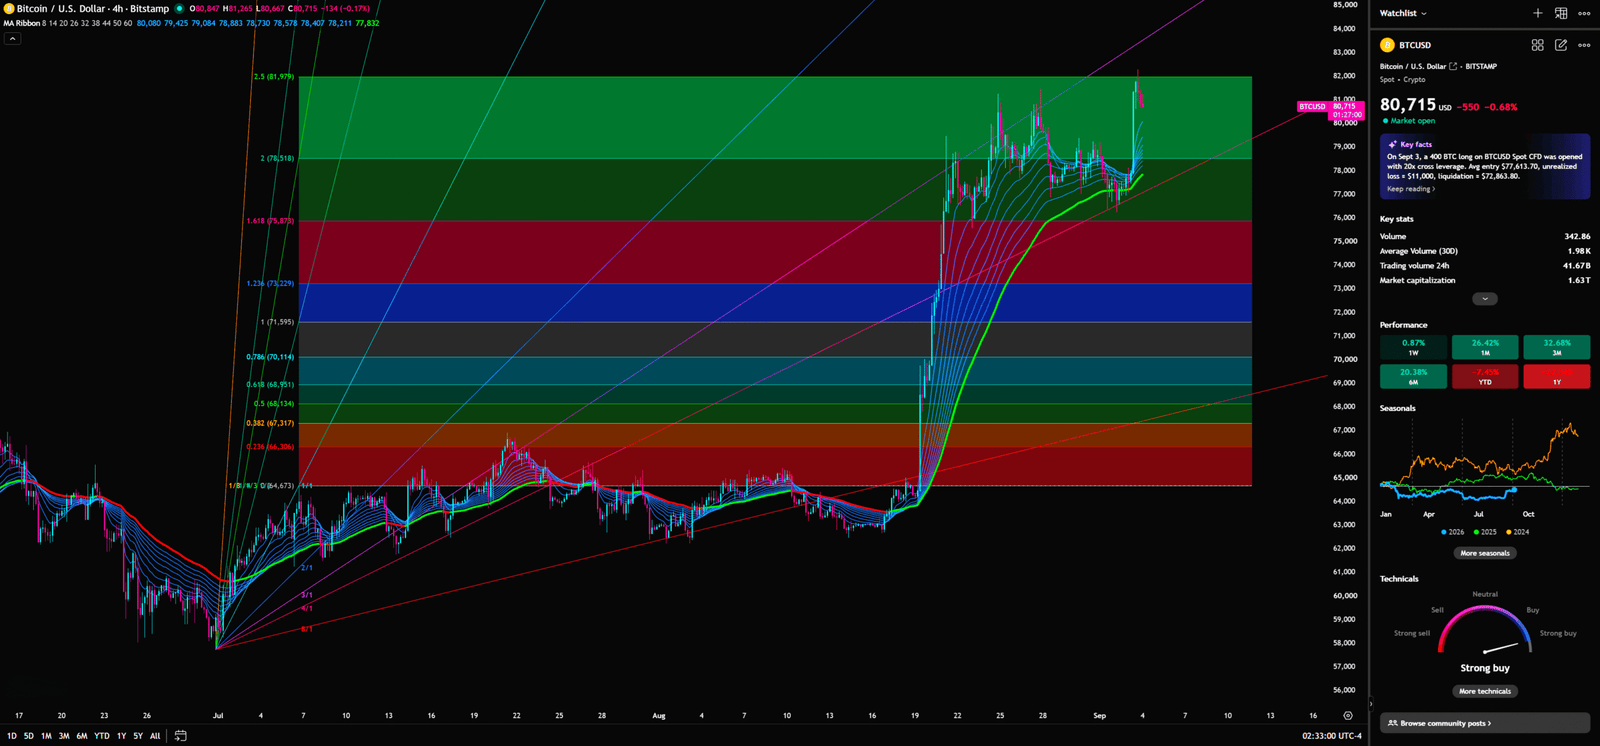
A 4-hour close above $81,979 followed by acceptance and a retest creates a tactical route toward $83,980 and then the higher weekly levels. A spike above $81,979 that quickly returns below the zone, followed by a loss of $78,518, is a failed-breakout signal. The next levels are $75,875 and $73,229, with the daily $70,925 area becoming relevant if selling broadens.
The MA Ribbon is a short-term cost band; its slope and price relationship show whether fast capital controls speed. Gann-style geometry frames price-time angles and projected guides; it is not a magical prediction line. Retail treats the line as certainty. A professional asks what orders are clustered around the line and what happens when it fails.
4-hour answer: money is forcing a binary decision at $81,979; retail chases before confirmation or panics after a false break; institutions use the breakout trigger and stop clusters as execution fuel. Bullish activation is acceptance above $81,979. Bearish invalidation is a loss of $78,518, exposing $75,875 and $73,229.
Retail Versus Institutions
Retail sees ETF inflows, a round-number reclaim, and a green 4-hour candle. Institutions see a stack of conditions: $81,979 as the intraday gate, $83,980 as the daily reclaim, $82,833 as a weekly lower-high reference, and $93,849 as a higher-confidence confirmation point. Retail buys the story. Institutions buy the condition. Retail asks whether BTC will reach the moon. A dealing room asks which price proves the thesis wrong.
A bank trader receiving a favourable central-bank headline does not ignore duration risk because the headline sounds bullish. The trader calculates yield, liquidity, and exit. BTC demands the same discipline. News can change sentiment; it cannot automatically rewrite structure. The professional edge is not predicting every candle. It is deciding in advance what must happen before capital is committed.
🎯 Scenario Planning and Trading Plan
Bullish scenario: 4-hour acceptance above $81,979, followed by daily acceptance above $83,980. Initial target: $93,849. Extension target: $100,131 if the reclaim becomes support. Failure: price returns below the reclaim zone or cannot hold $83,980.
Bearish scenario: rejection at $81,979–$83,980, followed by a 4-hour loss of $78,518. Initial downside references: $75,875 and $73,229, followed by daily $70,925. The marked $78,440 stop-loss reference remains a major risk boundary. Failure: price reclaims and holds the resistance zone.
Neutral scenario: price remains between $78,518 and $83,980 while weekly structure stays unresolved. Neutral does not mean safe. It means the market is charging a premium for noise while waiting for the next liquidity event.
| Setup | Entry condition | Risk boundary | Targets | Invalidation |
| Confirmed long | 4H acceptance above $81,979 and daily hold above $83,980 | Retest failure; marked stop reference $78,440 | $93,849, then $100,131 | Close back below reclaim zone |
| Defensive short / exit | Rejection at $81,979–$83,980 and loss of $78,518 | Above failed-breakout zone | $75,875, $73,229, $70,925 | Reclaim and hold resistance |
| Wait | Price remains inside unresolved band | Preserve capital | None until confirmation | Defined close creates asymmetry |
Do not treat $82,046 as an unconditional buy button. It is a tentative reference. $93,849 is closer to a confirmation zone than a cheap entry. Use closes, modest leverage, staged execution, and predefined exits. FOMO is the market’s most expensive commission.
I will continue to closely monitor the price action of this Crypto. As soon as a critical reversal signal appears on the charts, I will update my analysis and insights right here immediately. Remember to Bookmark this page and come back often to check for the latest updates!
Want to see our full, interactive chart breakdown? If you want to learn how to draw weekly VPFR, Fibonacci, EMA Ribbon, MACD, Supertrend, and S/R Flip frameworks designed for real trading decisions. Please browse the following『Further Reading』links. Fundamental news tells you what happened. Technical analysis predicts what will happen. To master the professional framework that separates market signal from noise, explore our exclusive models at https://www.chart-blitz.com/fxcx-app/omni-chart.html?symbol=BTC.
📚Further Reading:
To help everyone gain a deeper understanding of the various technical indicators mentioned in this article, we have specially prepared the following further reading materials. These cover key analytical tools found across the weekly, daily, monthly, and 4-hour charts.
- Decoding Fibonacci Retracement: The Perfect Blend of Natural Law and Market Psychology — Fibonacci Retracement is not just a set of magical numbers; it is a manifestation of market psychology. Learning how to correctly draw and interpret Fibonacci levels is a required course for every serious trader.
- Is a Major Move Hiding in Plain Sight? Dow Theory May Already Know the Answer — As retail traders continue to chase short-term signals, experienced market readers are looking deeper — into trend structure, volume behavior, and market phases that may expose the early clues of a coming breakout.
- Understanding VPFR: Finding the Hidden Footprints of Market Makers — The Volume Profile Fixed Range (VPFR) is a powerful tool that tells us where the most trading occurred within a specific price range. This helps us identify true support and resistance levels, as well as potential ‘Vacuum Zones’.
- S/R Flip Support and Resistance Swap Strategy — S/R Flip is one of the most powerful concepts in technical analysis. This article uses real cases to teach you how to use S/R Flip to capture the highest win-rate trading opportunities.
- MACD Momentum Indicator Momentum First — What Does the MACD Line Crossing Above Zero Mean? Golden Cross & Divergence Signals!
- Gann Fan Masterclass — Deep dive into W.D. Gann’s angle theory to identify the geometric relationship between time and price in the market.
- Strategies for EMA Ribbon Bearish Alignment: Dead Cat Bounce or Real Reversal — Deep dive into the EMA Ribbon to understand the battle between short-term and long-term capital.
- Bollinger Band: Long-Term Repricing Zone — The Ultimate Tool to Capture Massive Market Moves Tired of getting shaken out of winning trades too early? Or buying right before a trend reverses? An ex-banker reveals how to use the Bollinger Band to filter out market noise and ride the big waves.
- KDJ Stochastic Indicator Bottom Confirmation — What is the implication of a downward-curving KDJ? Understand in one article how to use dynamic indicators to catch market turning points.
【Disclaimer】 The content herein is for educational purposes and reflects the author’s personal opinion only; it is not investment advice. All financial investments, including cryptocurrencies, carry significant risk, and you could lose your entire capital. To support this site, this article may contain affiliate links. While we strive for accuracy, we cannot guarantee all information is complete or error-free. Please conduct your own research and be fully responsible for your own investment decisions.