It was never my thinking that made the big money for me. It was always my sitting.
Jesse Livermore – 1923
While the market’s gaze is fixed on the macro movements of Bitcoin and Ethereum, a potential storm is quietly brewing in the altcoin sector, far from the mainstream spotlight. Data reveals that not all altcoins are merely drifting with the tide. Notably, the chart for Ripple (XRP) is showing strong technical bullish patterns, while Cardano (ADA) is caught in a prolonged sideways consolidation. These two divergent price actions unveil a deeper conflict between “imminent momentum” and “potential energy.”
Top Stories at a Glance
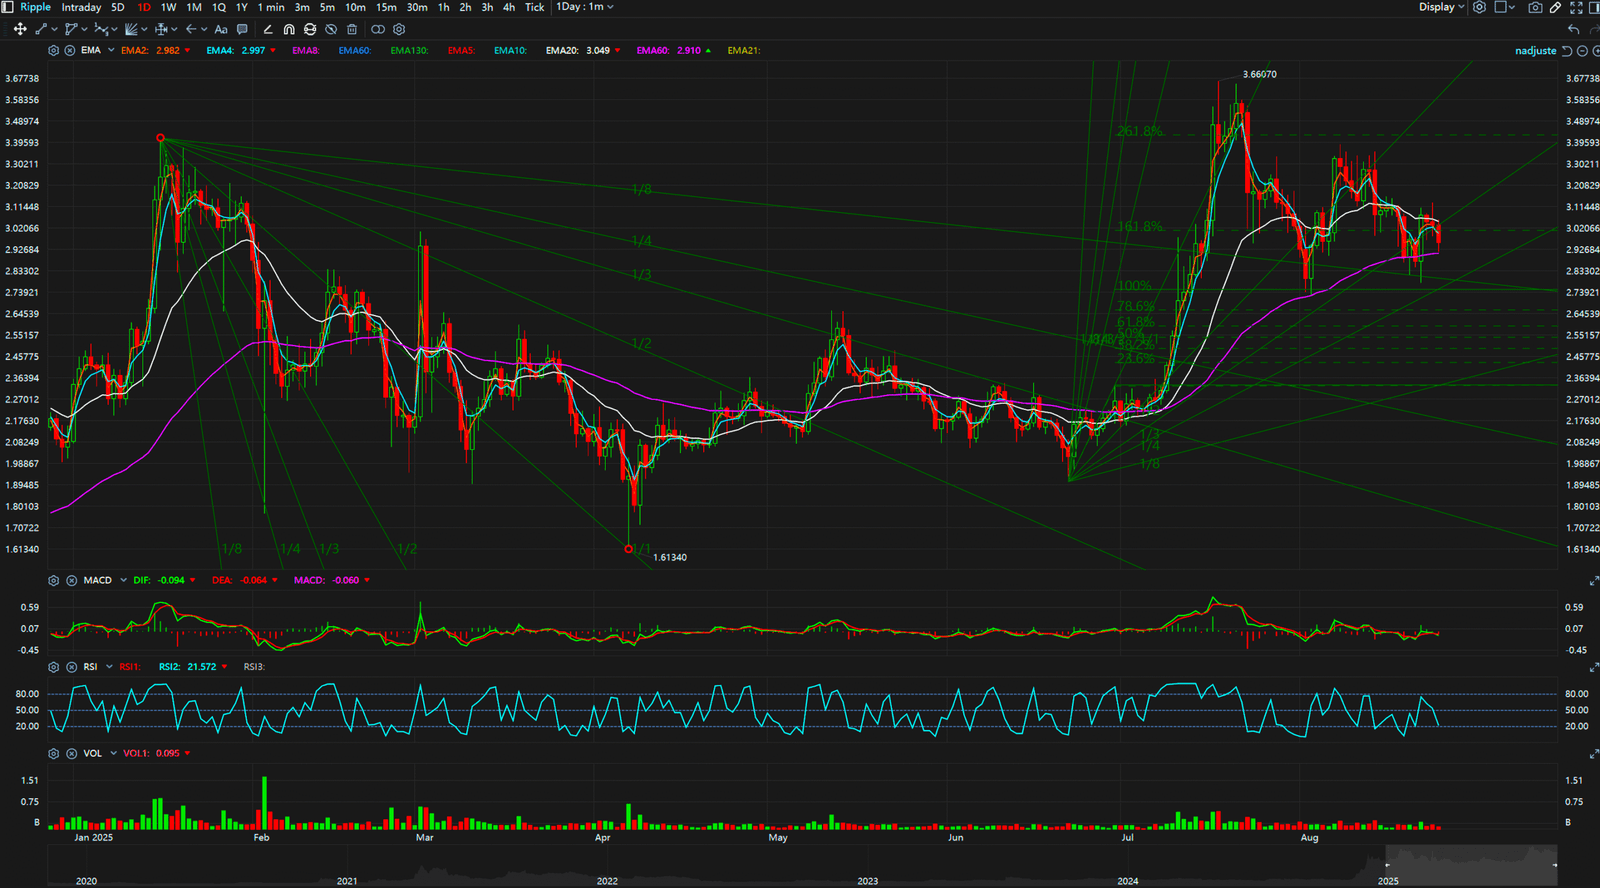
The Bull Case Unveiled by the Charts: Ripple (XRP) One of the most compelling signals in recent price action comes from XRP. Chart analysis shows that XRP is forming a textbook “Harmonic Pattern.” This complex formation, based on Fibonacci retracement and extension levels, is often considered a strong indicator of a potential trend reversal. Although XRP’s price has declined by about 13% over the past month, its macro structure over the last six months shows a recovery of nearly 20%. This bullish harmonic pattern suggests that selling pressure may be waning, laying the groundwork for the next leg up.
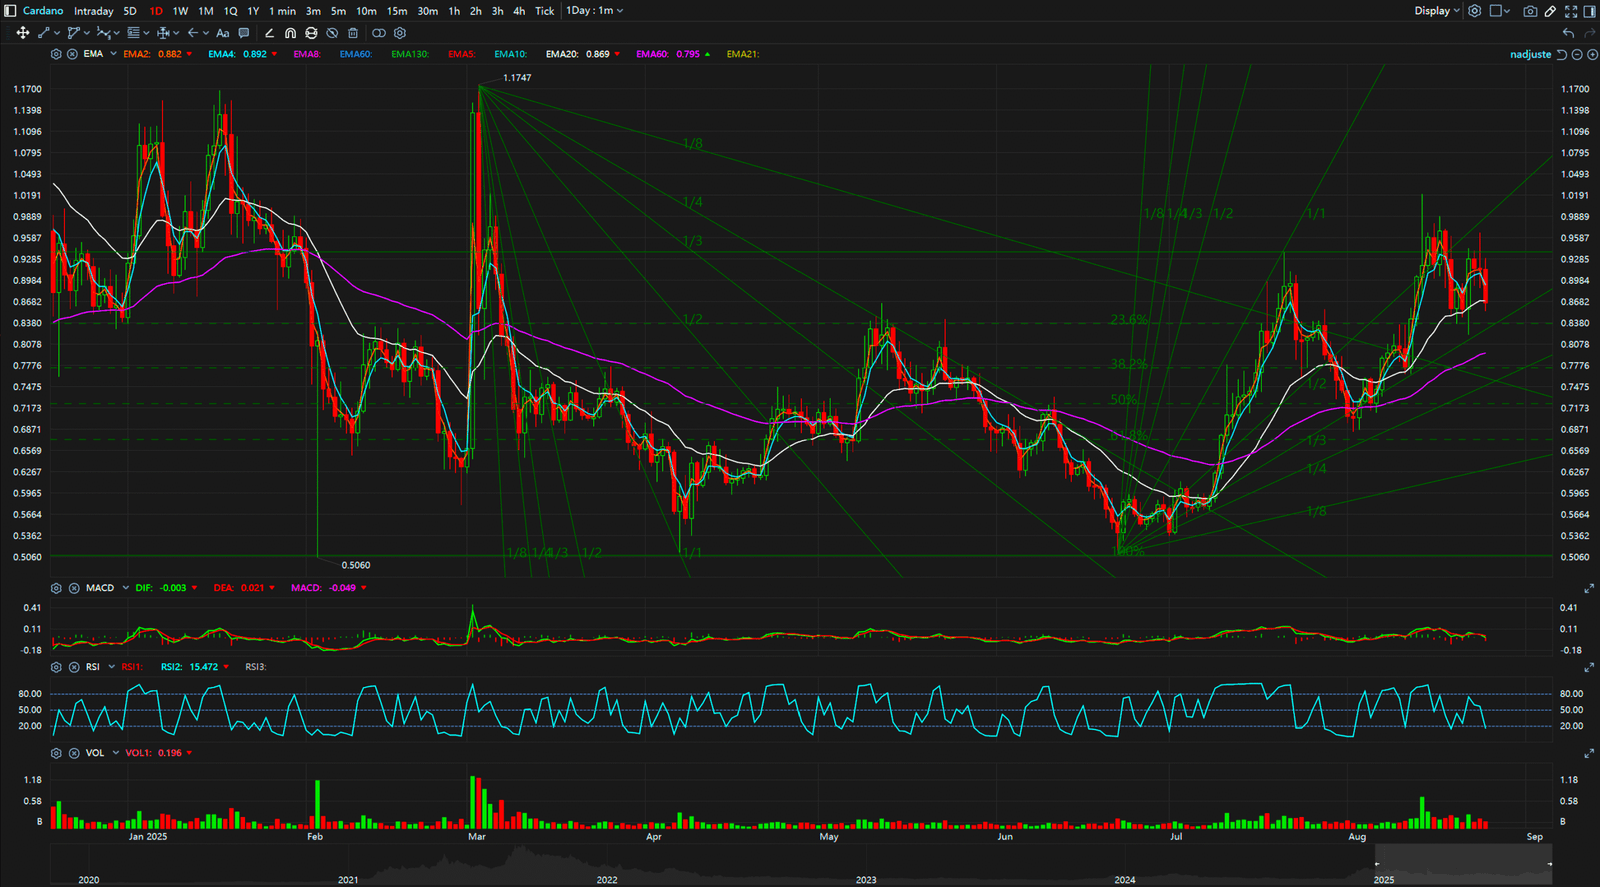
The Tension of Consolidation: Cardano (ADA) In contrast to XRP’s clear technical signal, Cardano (ADA) presents a different market narrative: consolidation. For several weeks, ADA’s price has been tightly locked between the $0.54 support and the $0.94 resistance levels. Such extended periods of range-bound trading often signify that the market is accumulating energy for its next major trend. This could be an “accumulation zone,” where smart money is quietly buying, or a “distribution zone.” The critical tipping point is the strong resistance at $1.14. A decisive break above this level could mean the stored energy will be unleashed to the upside.
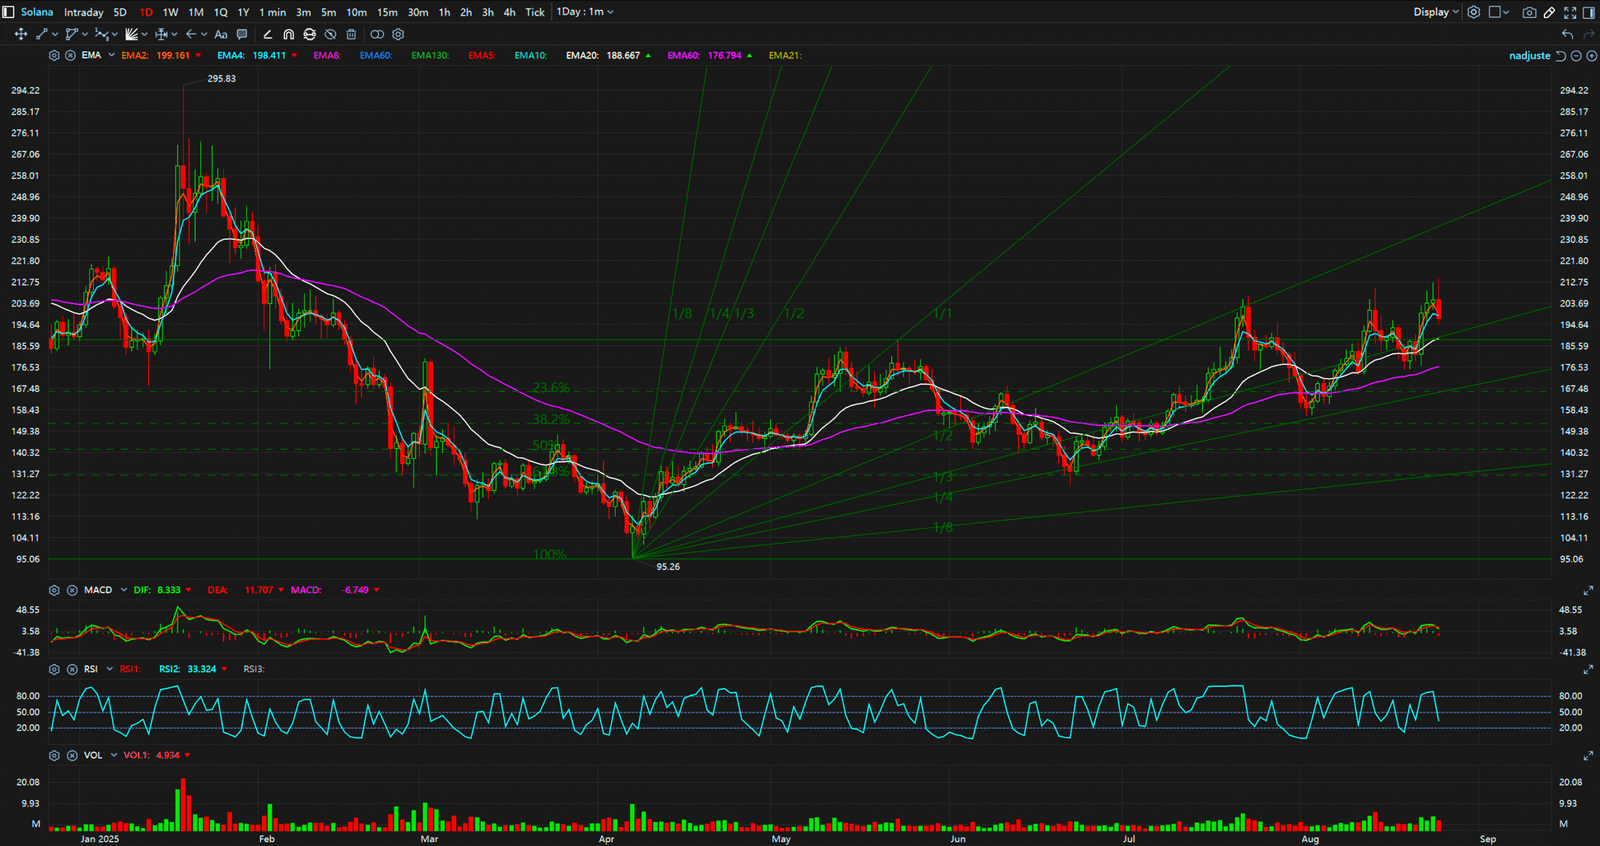
Market Barometer: The Role of Solana (SOL) Against this backdrop, the performance of Solana (SOL) offers a broader perspective on the market. As a leading high-performance blockchain, SOL’s price action often reflects the market’s overall appetite for high-risk, high-growth potential assets. Observing whether SOL picks a direction before XRP or ADA will be a key indicator for gauging sentiment across the entire altcoin sector.
Key Takeaways
Currently, the altcoin market presents an interesting dilemma: XRP’s harmonic pattern signals impending bullish momentum, while ADA’s sideways state is like a spring compressed to its limit, waiting to be released. Traders should closely watch for confirmation of XRP’s harmonic pattern and whether ADA can breach its critical $1.14 resistance. The movements of these two coins will likely define the dominant theme for the altcoin market in the next phase.
Want more in-depth chart analysis on altcoins? Visit www.chart-blitz.com now.
True trading advantage comes from interpreting these conflicting signals. To learn how to apply a professional-grade analytical framework to decode the market’s real intentions, visit www.chart-blitz.com to explore our exclusive chart breakdowns and models.
Sources:
- CryptoDaily UK: “XRP and Chainlink (LINK) Set to Soar: Harmonic Patterns…” (https://cryptodaily.co.uk/news-in-crypto/bitzo:xrp-and-chainlink-link-set-to-soar-harmonic-patterns-confirm-bullish-momentum-building)
- Cointelegraph: “Price predictions 8/11: SPX, DXY, BTC, ETH, XRP, BNB, SOL, DOGE, ADA, HYPE” (https://cointelegraph.com/news/price-predictions-811-spx-dxy-btc-eth-xrp-bnb-sol-doge-ada-hype)
- CryptoDaily UK: “Ethereum Makes Moves, Then it Turns To Mid-Cap…” (https://cryptodaily.co.uk/news-in-crypto/bitzo:ethereum-makes-moves-then-it-turns-to-mid-cap-to-explode-best-cryptos-to-buy-when-eth-makes-rise)
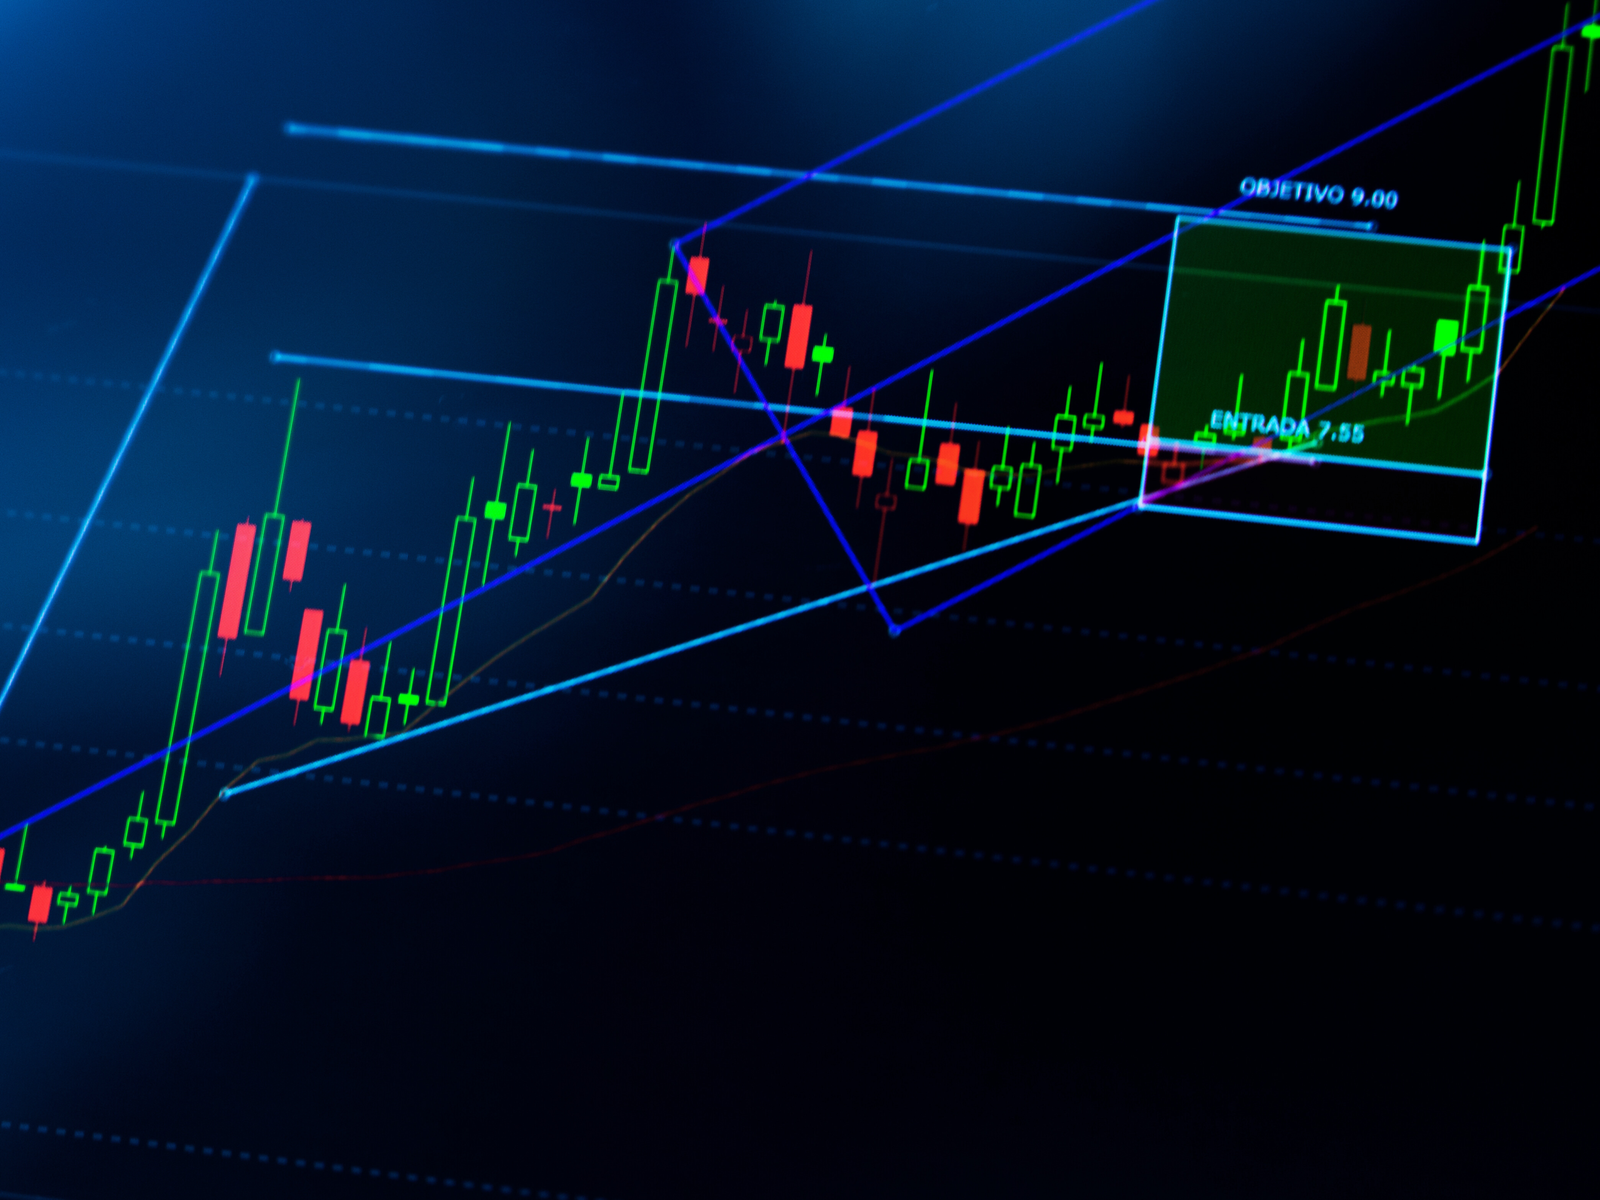
Unlocking Technical Analysis: Power Moves with Diagrams
Daily Timeframe for XRP
Daily Timeframe for ADA
Daily Timeframe for SOL