The speculator’s chief enemies are always boring from within. It is inseparable from human nature to hope and to fear
William Delbert Gann – 1949
While Bitcoin appears robust, holding steady above the critical $110,000 mark, a significant divergence in Ethereum’s price action suggests the market’s current stability may be deceptive. This growing gap between the two crypto giants is flashing a warning sign that astute traders cannot ignore.
Top Stories at a Glance
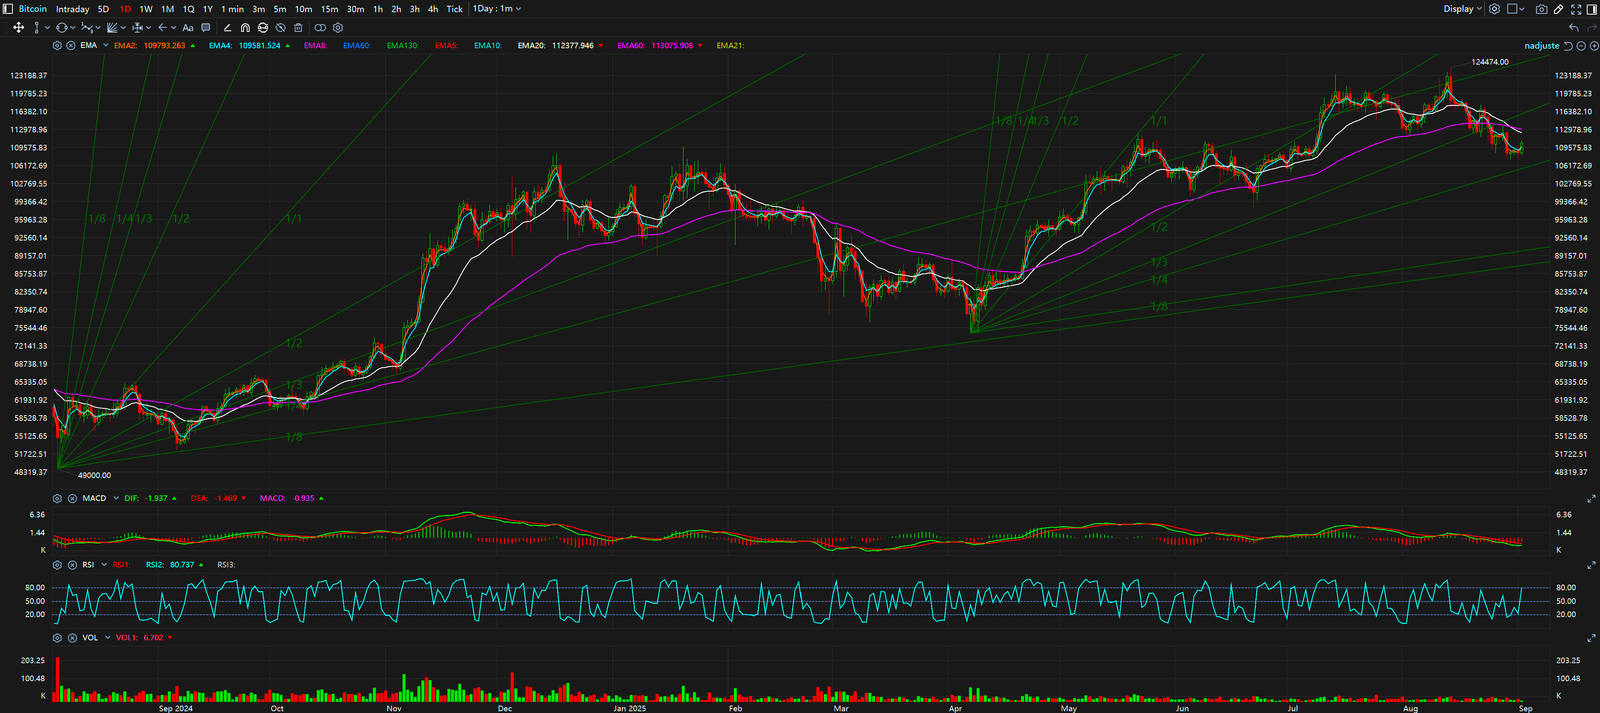
The Bull Case / The Obvious Story: On the surface, the market leader provides a reason for optimism. Bitcoin is maintaining a resilient market structure, consolidating its position above the key psychological support level of $110,000. This price action suggests a degree of stability and buyer interest, leading many to believe the market is simply pausing before its next leg up.
The Bear Case / The Hidden Signal: However, a deeper look at Ethereum’s 4-hour chart reveals a counter-narrative. ETH has not only underperformed BTC significantly over the last 24 hours but is also showing signs of classic momentum decay. This type of price action is often accompanied by a MACD Bearish Divergence, where the price prints a high or a higher high, while the momentum indicator forms a lower high. This is a textbook signal that the underlying buying pressure is weakening, and the asset is vulnerable to a sharp reversal.
Synthesis & Implication: This conflict—Bitcoin’s perceived strength versus Ethereum’s technical weakness—implies that the current market rally is not broad-based. It is a fragile strength, heavily reliant on the market leader. When the number two asset shows such clear signs of exhaustion, it often foreshadows a wider market correction, as the weakness can eventually cascade and pull the leader down with it.


Key Takeaways
In summary, the divergence between BTC and ETH presents a complex but clear picture. While Bitcoin holds its ground, the warning signs from Ethereum should not be underestimated. Traders should closely monitor the following key levels: For Bitcoin, the immediate support is at $110,000, with resistance at $115,000. For Ethereum, a break below the $4,200 support level could signal further decline, while reclaiming $4,500 as support is crucial for any bullish continuation.
For continuous, real-time analysis of these developing market structures, visit www.chart-blitz.com.
True trading advantage comes from decoding these conflicting signals. To learn the professional-grade framework for seeing the market’s real intentions, explore our exclusive models on www.chart-blitz.com.
Sources:
Unlocking Technical Analysis: Power Moves with Diagrams
Daily Timeframe for Bitcoin
4-Hour Timeframe for Ethereum