When you make a trade, you should have a clear target of where you expect to get out
William Delbert Gann – 1949
🌍 Catalyst Breakdown: The Smokescreen of Geopolitics and Inflation Data
Over the past 24 to 72 hours, the cryptocurrency market has experienced a dramatic emotional rollercoaster. First, the U.S. released its latest Consumer Price Index (CPI) data for March. Headline CPI rose 0.9% month-over-month and 3.3% year-over-year, primarily driven by surging energy prices. However, what truly caught the market’s attention was the core CPI (excluding food and energy), which rose only 2.6% year-over-year and 0.2% month-over-month, both coming in below market expectations of 3.0% and 0.3% respectively. This “cooling inflation” signal instantly ignited market hopes for Federal Reserve monetary policy easing, triggering a short-term spike in BTC from around $71,000 to above $73,000.
But what truly set the market boiling was a geopolitical bombshell from the Middle East. Reports emerged that Iran is demanding all ships transiting the Strait of Hormuz pay a “toll” of up to $2 million in Bitcoin (BTC). The Strait of Hormuz is one of the world’s most critical oil shipping lanes, with over 20% of global oil supply passing through it daily. Iran’s move is essentially a declaration to the world: Bitcoin is a “borderless currency” that transcends national sanctions and cannot be frozen. As soon as this news broke, the narrative of BTC as a “safe-haven asset” and “decentralized currency” was amplified infinitely. Coupled with a robust single-day net inflow of $443 million into Bitcoin and Ether ETFs, market sentiment seemed overwhelmingly positive.
However, having spent 20 years in the bank’s trading room and witnessed countless “news-driven” false breakouts, we must remain calm. News is often just a smokescreen released by market makers to align with chart movements. The true market direction was already written clearly on the technical charts long before the news broke.
【📊Analysis Baseline Statement】
All technical analysis below is based on a price snapshot locked at 2026-04-11 17:32 ET: BTC = $72,800 USD (Sources: CoinMarketCap $72,768 / Yahoo Finance $72,974, cross-referenced average). Please treat this report as an “analytical map” rather than real-time quotes.

📈 Weekly Chart Deep Dive (Highest Priority): The Life-or-Death Struggle Between Symmetrical Triangle and Elliott Wave
Opening the BTC weekly chart, we can clearly see a shocking truth: long before the Iran news broke, the patterns on the chart had already laid the groundwork for this movement.
Weekly Timeframe for BTC (Bitcoin)
Morphological Analysis: The Eve of the Symmetrical Triangle Breakout
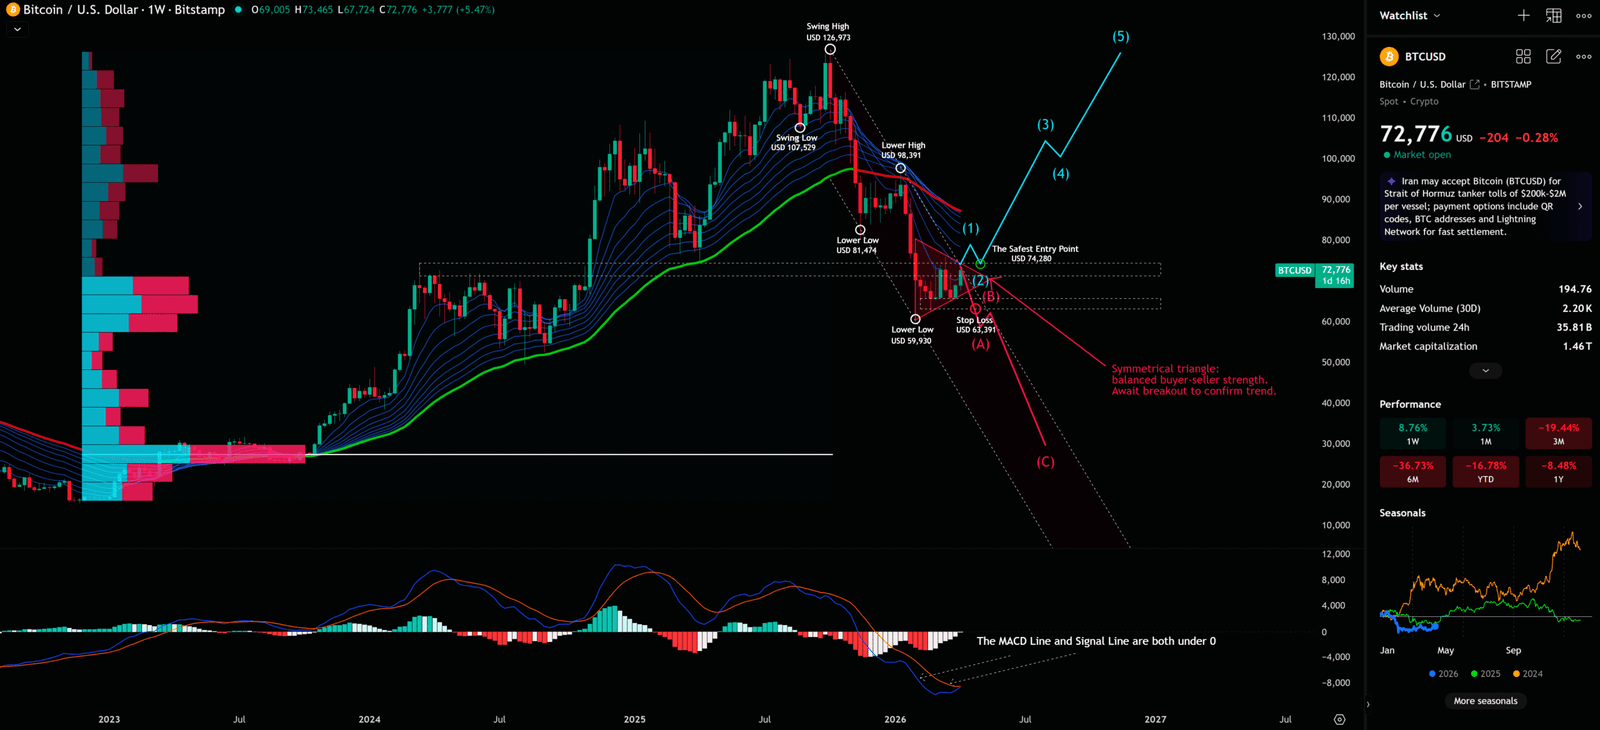
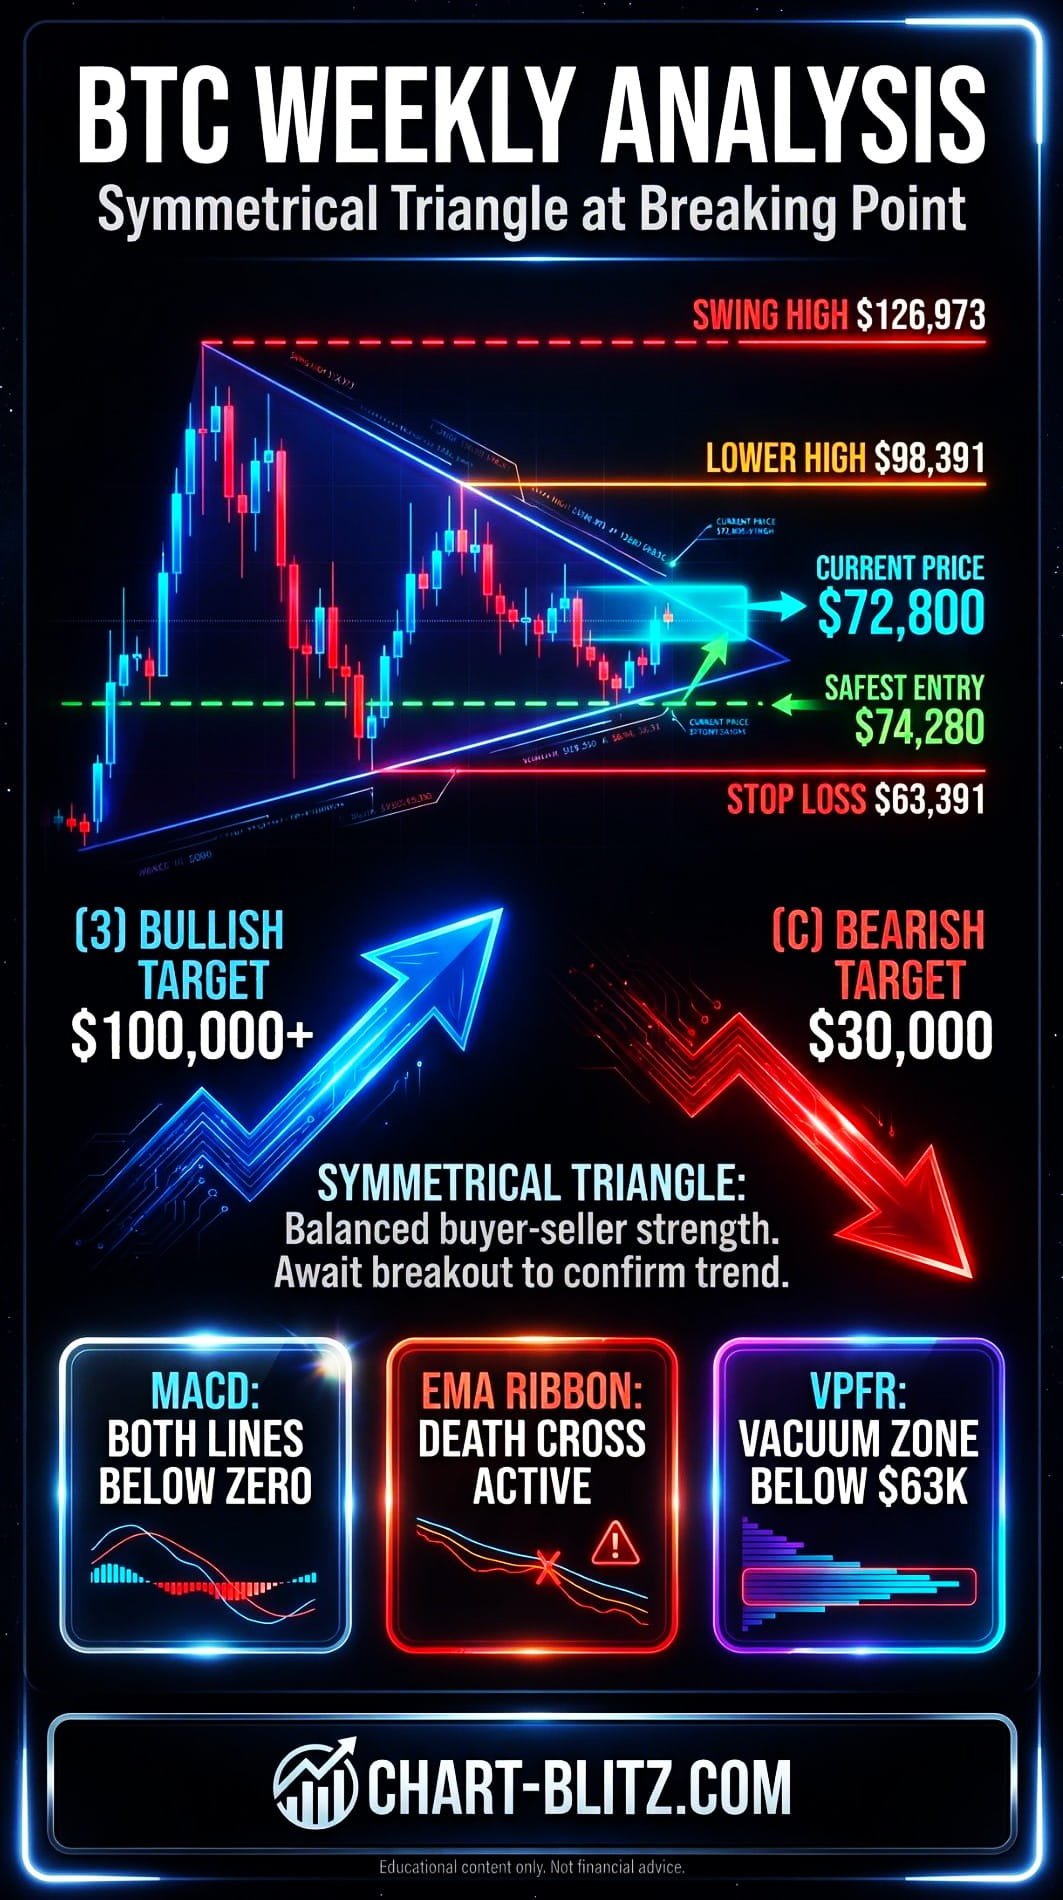
Currently, BTC is inside a massive “Symmetrical Triangle.” This pattern is formed by a series of “lower highs and higher lows” candlesticks, reflecting an extreme balance of power between buyers and sellers. The upper resistance line connects the historical high (Swing High) of $126,973 to the lower high of $98,391; the lower support line connects the lower low of $59,930 to the stop loss of $63,391.
The current price of $72,800 sits right at the apex of the triangle, facing an imminent breakout. In the bank’s trading room, we call this the “calm before the storm.” A Symmetrical Triangle itself does not indicate direction; it simply tells you that the market is accumulating energy, and once it breaks out, it is often accompanied by massive volume and a strong trend extension.
Elliott Wave Theory: Precise Projection of the Bull/Bear Dividing Line
According to Elliott Wave Theory, we can clearly identify two starkly different scenarios on the weekly chart:
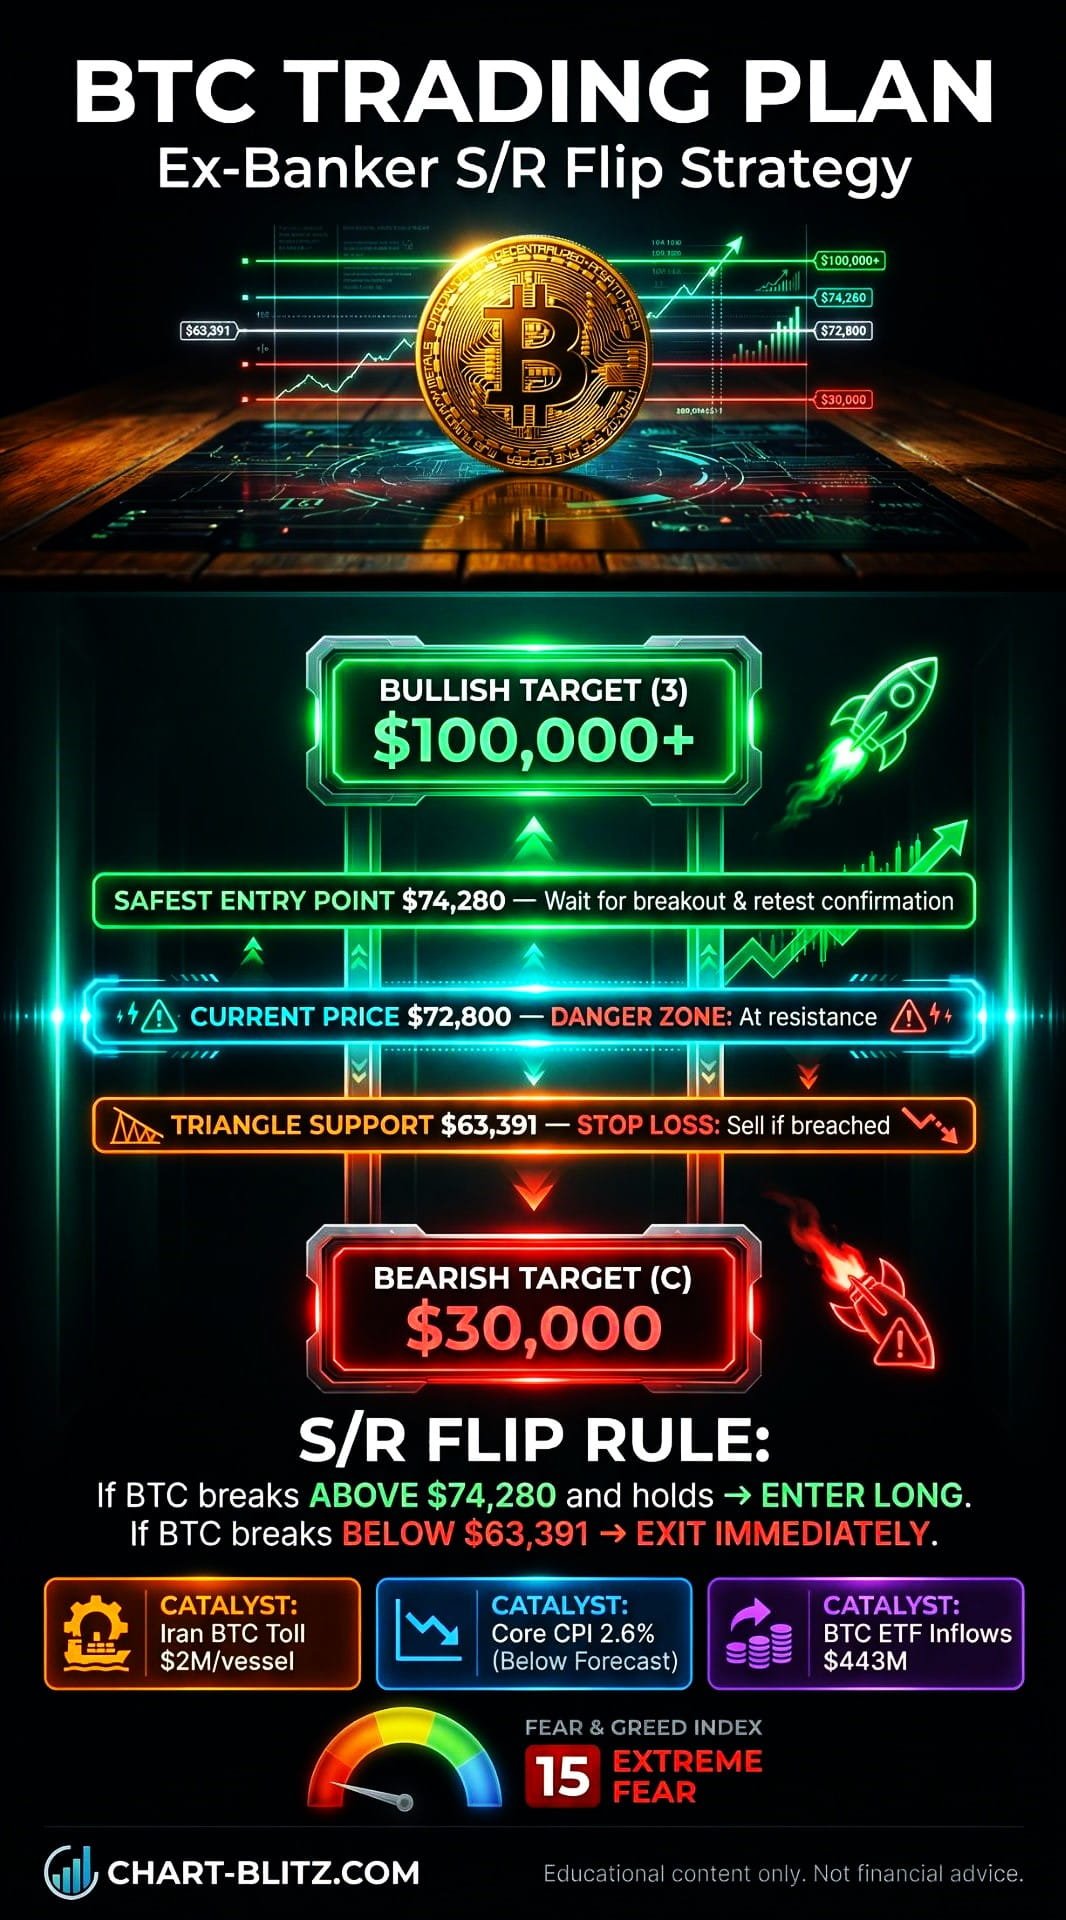
Bullish Scenario (Blue Path): Starting from the $126,973 top, the market has completed the Wave (1) decline (to around $59,930) and is currently undergoing the Wave (2) corrective bounce. If BTC can strongly break above the upper boundary of the triangle and stabilize above $74,280 (The Safest Entry Point, as marked on the user’s chart), it confirms that the Wave (2) correction is complete, and the main upward impulse of Wave (3) is about to begin. The target points straight to the top of Wave (5) at $100,000 or even higher.
Bearish Scenario (Red Path): Conversely, if this bounce is merely a “dead cat bounce” of Wave (B), once it breaks below the triangle’s lower boundary of $63,391, it will trigger a severe Wave (C) decline, with targets potentially as low as $20,000 to $30,000.
⚠️ Elliott Wave Iron Rule Warning: When projecting wave counts, one must remember: the bottom of Wave 4 must absolutely not overlap with the top of Wave 1. If BTC breaks this critical defense line, the entire assumption of a 1-2-3-4-5 upward impulse wave will be completely shattered, proving that this is currently only part of a larger degree corrective wave (A-B-C), and the market will face even deeper declines ahead.
VPFR Vacuum Zone and Institutional Positioning: The Most Dangerous Trap
Pay attention to the VPFR (Volume Profile Fixed Range) indicator on the left side of the chart. This indicator is one of the most commonly used tools by institutional traders to identify “volume concentration zones” and “vacuum zones.” The design principle of VPFR is: in price ranges with sparse trading volume, the market lacks sufficient “order walls” to support or block prices. Therefore, once breached, prices tend to rapidly traverse this “Vacuum Zone” until they encounter the next high-volume concentration area.
Below $60,000, there is a clear volume “Vacuum Zone.” If the stop loss of $63,391 is breached, the price could easily free-fall rapidly to the high-volume dense area (POC, Point of Control) around $30,000.
Meanwhile, the weekly EMA Ribbon still exerts downward pressure on the price. Both the MACD Line and Signal Line are below the zero axis, indicating that long-term bearish forces still dominate.
📊 Daily Chart Validation: The Death Cross of Fibonacci and Moving Averages
Daily Timeframe for BTC (Bitcoin)
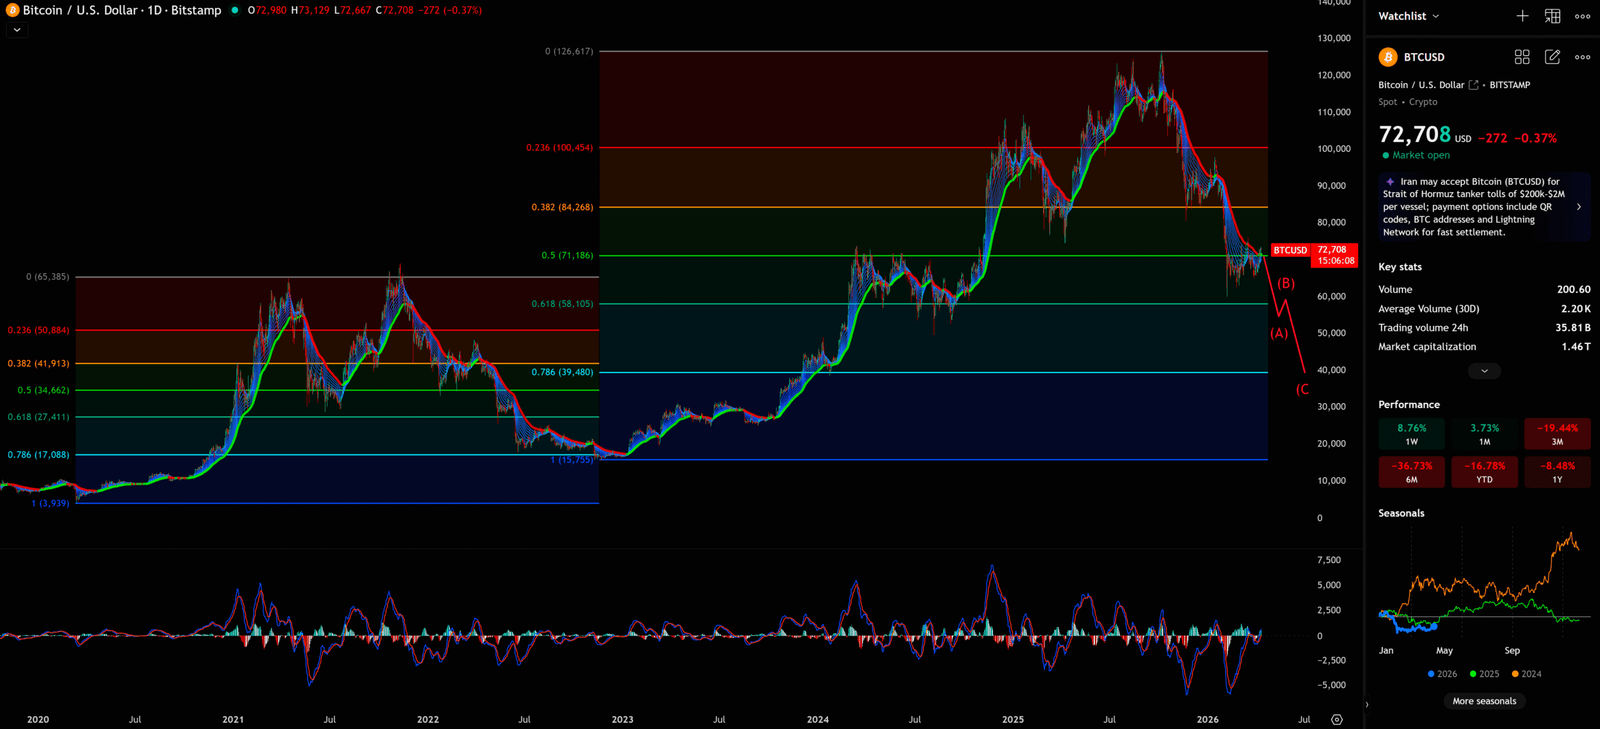
Zooming into the daily chart, the situation is even less optimistic.
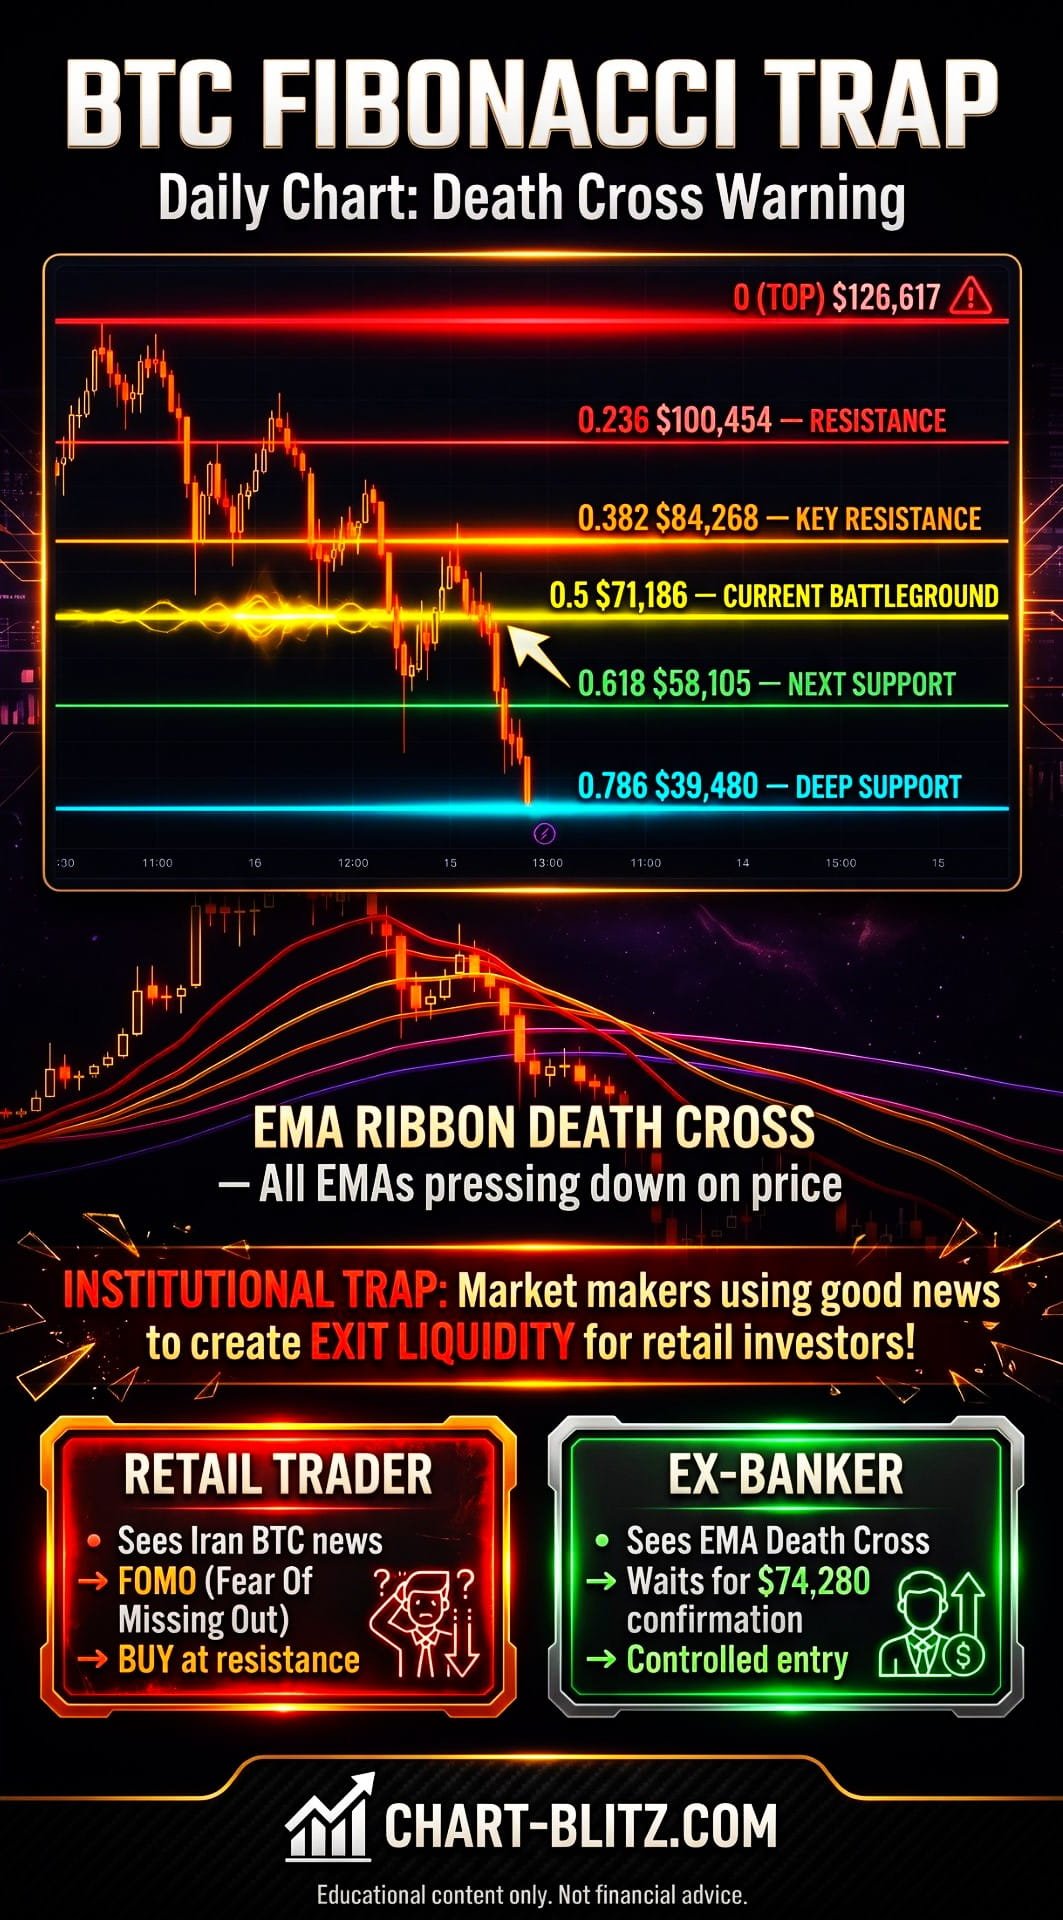
The large Fibonacci Retracement drawn from the $3,939 bottom to the $126,617 top shows that the current price of $72,800 is precisely constrained by the resistance near the 0.5 Fibonacci retracement level ($71,186). Fibonacci Retracement is a technical analysis tool based on the “Golden Ratio,” and its core principle is: after completing a trend, the market often retraces a certain proportion of the gain or loss, and key levels such as 0.5 (50%) and 0.618 (61.8%) are often where market participants most intensely contest.
Currently, BTC is struggling around the 0.5 Fib, indicating fierce competition between bulls and bears at this critical level. If it fails to effectively break through, the next support level is 0.618 Fib ($58,105); if it manages to break through and hold, it will need to further challenge the 0.382 Fib ($84,268) resistance.
Even more fatal is that the daily EMA Ribbon has formed a perfect “Death Cross,” with multiple moving averages (8, 14, 20, 26, 32, 38, 44, 50, 60-day MAs) looming over the price like a heavy mountain, forming strong systematic resistance.
This phenomenon tells us that despite the short-term news stimulus, the medium-term trend remains extremely weak. Market makers are highly likely using this positive news to create an “Exit Liquidity” trap, luring retail investors to catch the falling knife at resistance levels
📅 Monthly Chart Long-Term Perspective: Supertrend and KDJ Overbought Warning
Monthly Timeframe for BTC (Bitcoin)
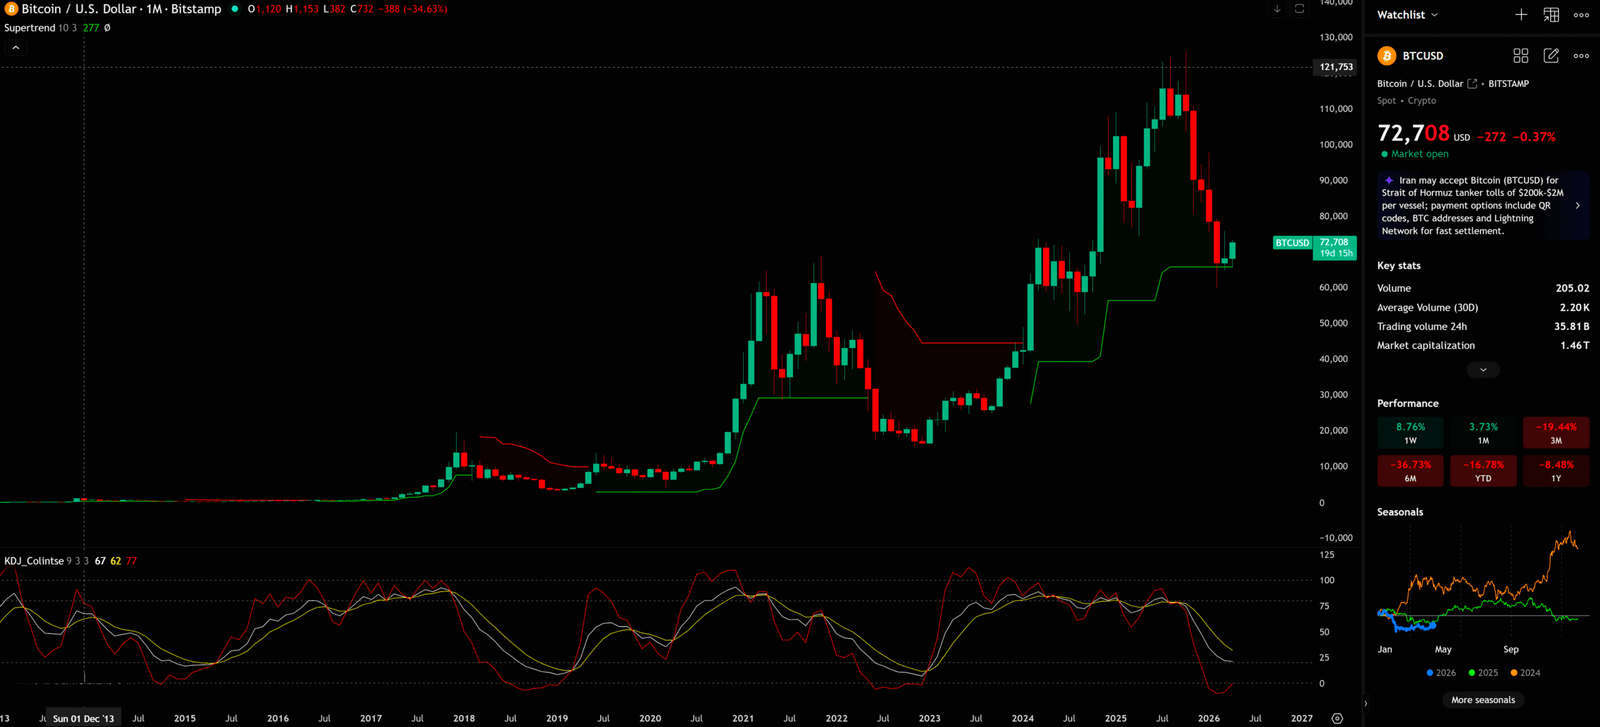
Let’s look at the monthly chart to examine BTC’s long-term trend from a more macro perspective.
The Supertrend indicator on the monthly chart currently shows red, issuing a clear long-term sell signal. Supertrend is a trend-following indicator based on ATR (Average True Range), and its design principle is: when the price falls below the Supertrend line, it indicates a trend change from bullish to bearish; conversely, it indicates a change from bearish to bullish. The current Supertrend line is around $80,000-$85,000, meaning BTC needs to rally more than 10% significantly before there is any chance of turning the long-term trend from bearish to bullish.
The KDJ indicator below (K=67, D=62, J=77), although still above 50, has started to show signs of curving downwards, indicating that the previous extreme overbought condition is undergoing mean reversion. KDJ is a composite indicator combining momentum, relative strength index, and moving averages, and its J line is most sensitive to market turning points. When the J line curves downward from a high position, it is often an early warning signal of a short-term top.
The large bearish candlestick (-34.63%) on the monthly timeframe also reminds us that the overhead trapped supply is extremely heavy, and it will take a considerable amount of time to fully digest.
⏱️ 4-Hour Chart Short-Term Battle: The Attempted Breakout of the Descending Channel
4-Hour Timeframe for BTC (Bitcoin)
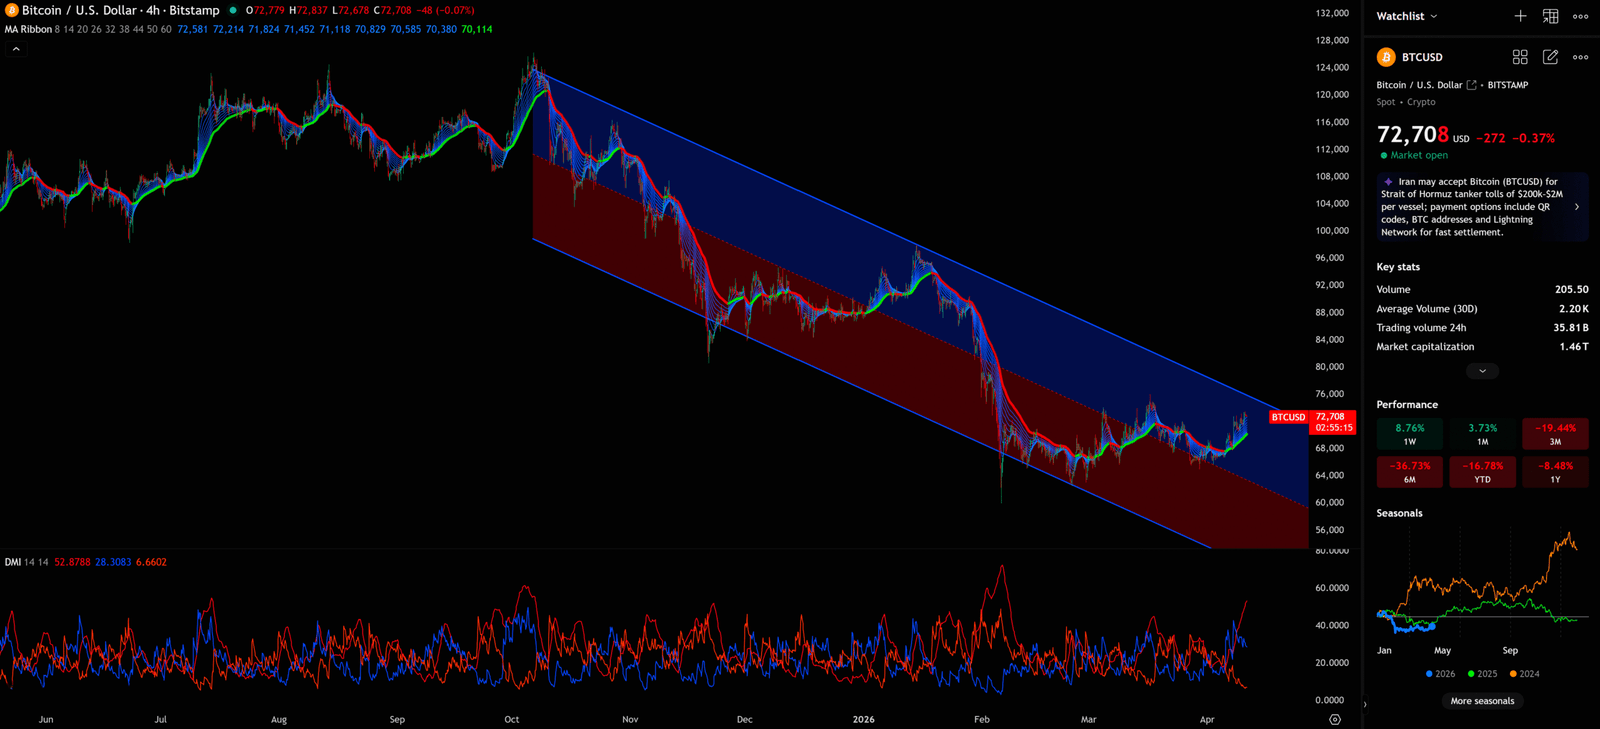
Finally, let’s examine the 4-hour chart to understand the immediate short-term dynamics.
BTC is currently within a clear descending Parallel Channel. This channel starts from the $126,973 top, with the upper boundary (resistance line) and lower boundary (support line) extending downward in parallel, forming a complete bearish channel structure.
Boosted by inflation data and the Iran news, the price has just broken above the short-term MA Ribbon (8, 14, 20, 26, 32, 38, 44, 50, 60 moving averages) and is testing the upper boundary of the channel (around $75,000-$76,000). The MA Ribbon breakout is a short-term bullish signal, indicating an increase in short-term buying pressure.
However, the DMI (Directional Movement Index) indicator below shows that the ADX value is extremely low (6.66), meaning that the current upward trend severely lacks momentum. ADX measures trend strength; the higher the value, the stronger the trend. An ADX below 20 is generally considered “no trend” or “weak trend,” and breakouts under these conditions are often false breakouts (Fakeouts).
💡 Comprehensive Conclusion and the Ex-Banker’s Trading Plan
Synthesizing the analysis across multiple timeframes, we can draw a clear conclusion:
| Timeframe | Key Indicators | Signal | Conclusion |
| Weekly | Symmetrical Triangle + MACD + EMA Ribbon | Bears dominant, awaiting breakout direction | High Alert |
| Daily | Fibonacci 0.5 Resistance + EMA Death Cross | Medium-term bearish, strong resistance | Cautious Long |
| Monthly | Supertrend Red + KDJ Curving Down | Long-term bearish signal | Long-term Caution |
| 4-Hour | MA Ribbon Breakout + Low DMI ADX | Short-term slightly bullish, but lacking momentum | Short-term Opportunity |
The current rise is highly likely a “dead cat bounce” used by market makers to distribute on the back of news. Retail FOMOs on news; bankers look for “Exit Liquidity” on charts. The information asymmetry between these two groups is the fundamental reason why retail investors consistently lose money.
S/R Flip (Support/Resistance Interchange) Rule Application: Theoretically, the BTC downtrend should not be over yet, but if the BTC price does not continue to fall but instead turns upwards and explodes, it needs to be seen whether it can rise to the resistance zone ($74,280 – $78,000). If it breaks above and holds, then enter the market; otherwise, it will reach the stop loss ($63,391) and sell off.
Complete Trading Plan:
The Safest Entry Point: Patiently wait for the price to strongly break above $74,280 and stabilize upon retesting. This position confirms the upward breakout of the Symmetrical Triangle and also confirms the start of Wave (3) in Elliott Wave Theory. Never blindly chase the price in the “danger zone” of $72,800-$74,280, as this range is a resistance concentration area.
Strict Stop Loss: $63,391. Once this level is breached, it means a downward breakout of the triangle, and the VPFR Vacuum Zone will trigger a washout plunge. You must immediately stop loss and exit to preserve capital for the next opportunity.
Re-entry Strategy After Stop Loss: If the stop loss is triggered, wait for BTC to fall to the 0.618 Fib support zone around $58,000-$60,000 and observe for bounce signals (such as long lower wicks, increased volume). If a bounce occurs, wait for the bounce to reach the former resistance zone of $65,000-$68,000; if it breaks through and holds, re-enter the market.
Bullish Target: Wave (3) target $95,000-$100,000, Wave (5) target $130,000+.
Bearish Target: Wave (C) target $20,000-$30,000
I will continue to closely monitor the price action of this Crypto. As soon as a critical reversal signal appears on the charts, I will update my analysis and insights right here immediately. Remember to Bookmark this page and come back often to check for the latest updates!
Want to see our full, interactive chart breakdown? If you want to learn how to draw Fibonacci Retracement Ratio yourself, identify S/R Flips, and stop trading blind. Please browse the following『Further Reading』links. Fundamental news tells you what happened. Technical analysis predicts what will happen. To master the professional framework that separates market signal from noise, explore our exclusive models at www.chart-blitz.com.
📚Further Reading:
- Advanced Fibonacci Retracement Usage — Finding Golden Support and Resistance Stop drawing Fibonacci lines randomly! An ex-banker teaches you how to combine market psychology to accurately pinpoint key turning points at 0.5 and 0.618.
- Elliott Wave Principles and Iron Rules — How to Accurately Catch the Main Impulse Wave? Why can’t the bottom of Wave 4 overlap with the top of Wave 1? A comprehensive guide on how to use Elliott Wave Theory to map out your trading path.
- Volume Profile (VPFR) Tutorial — The Magic Mirror for Institutional Accumulation and Distribution Want to know why below $60,000 is a “Vacuum Zone”? Learn how to use VPFR to find the market’s true high-volume nodes (POC) and see through institutional positioning.
- S/R Flip Support and Resistance Swap Strategy — S/R Flip is one of the most powerful concepts in technical analysis. This article uses real cases to teach you how to use S/R Flip to capture the highest win-rate trading opportunities.
- MACD Momentum Indicator Momentum First — What Does the MACD Line Crossing Above Zero Mean?
- KDJ Stochastic Indicator Bottom Confirmation — What is the implication of a downward-curving KDJ? Understand in one article how to use dynamic indicators to catch market turning points.
- Parallel Channel Short-Term Game — How to Use Parallel Channels to Find Precise Entry/Exit Points for BTC short-term opportunities.
- Supertrend Indicator — The Ultimate Tool to Capture Massive Market Moves Tired of getting shaken out of winning trades too early? Or buying right before a trend reverses? An ex-banker reveals how to use the Supertrend indicator to filter out market noise and ride the big waves.
【Disclaimer】 The content herein is for educational purposes and reflects the author’s personal opinion only; it is not investment advice. All financial investments, including cryptocurrencies, carry significant risk, and you could lose your entire capital. To support this site, this article may contain affiliate links. While we strive for accuracy, we cannot guarantee all information is complete or error-free. Please conduct your own research and be fully responsible for your own investment decisions.