When you make a trade, you should have a clear target of where you expect to get out
William Delbert Gann – 1949
📰 News First: Market Sentiment & Fundamental Catalysts
Over the past 24 hours, news about TRON (TRX) has been overwhelming. The most striking is MetaMask’s announcement of native support for the TRON blockchain, a move that undoubtedly significantly lowers the barrier for Ethereum ecosystem users to enter TRON. Concurrently, TRON DAO, in collaboration with Securitize, hosted a grand “TRON Whale Night” at the Bitcoin 2026 conference, showcasing institutional-grade positioning. Even more astonishingly, data shows a 500% surge in TRON network Crypto Card stablecoin spending, reaching $600 million monthly, with TRON capturing a 35% share of this.
When retail investors see this news, their first reaction is surely: “Wow! All the good news is out, shouldn’t I go all-in and chase it?” FOMO (Fear Of Missing Out) sentiment is instantly ignited. However, as an ex-bank trader who has spent 20 years in the trading room, I must pour cold water on you: News is often just a smokescreen released by whales in tandem with chart movements, aimed at creating “Exit Liquidity.” The real answers are already written on the technical charts.
【📊Analysis Baseline Statement】
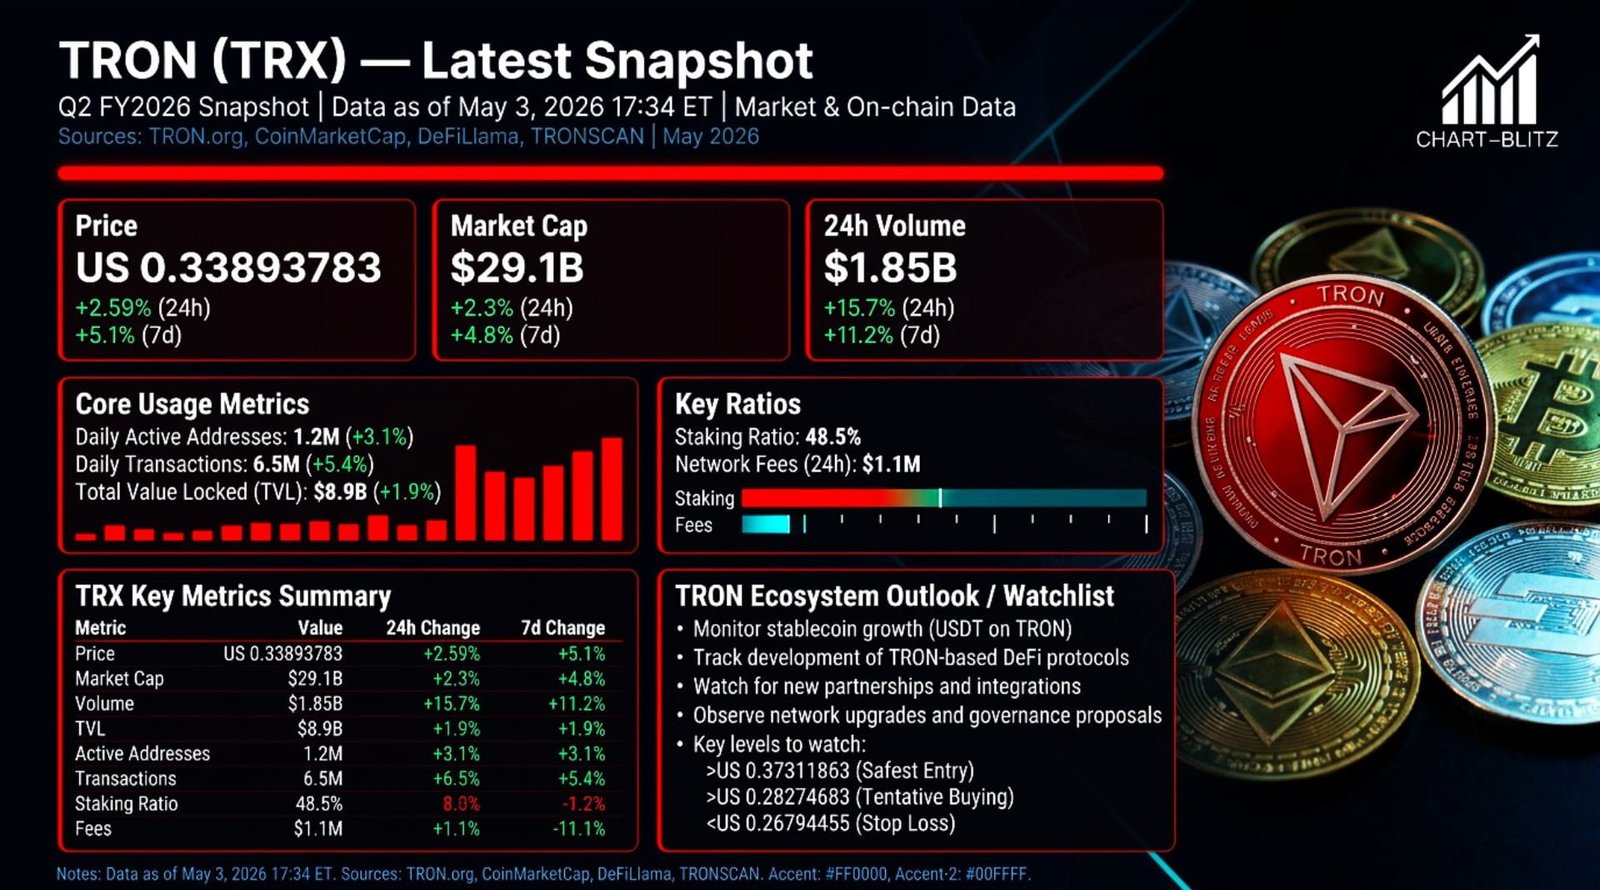
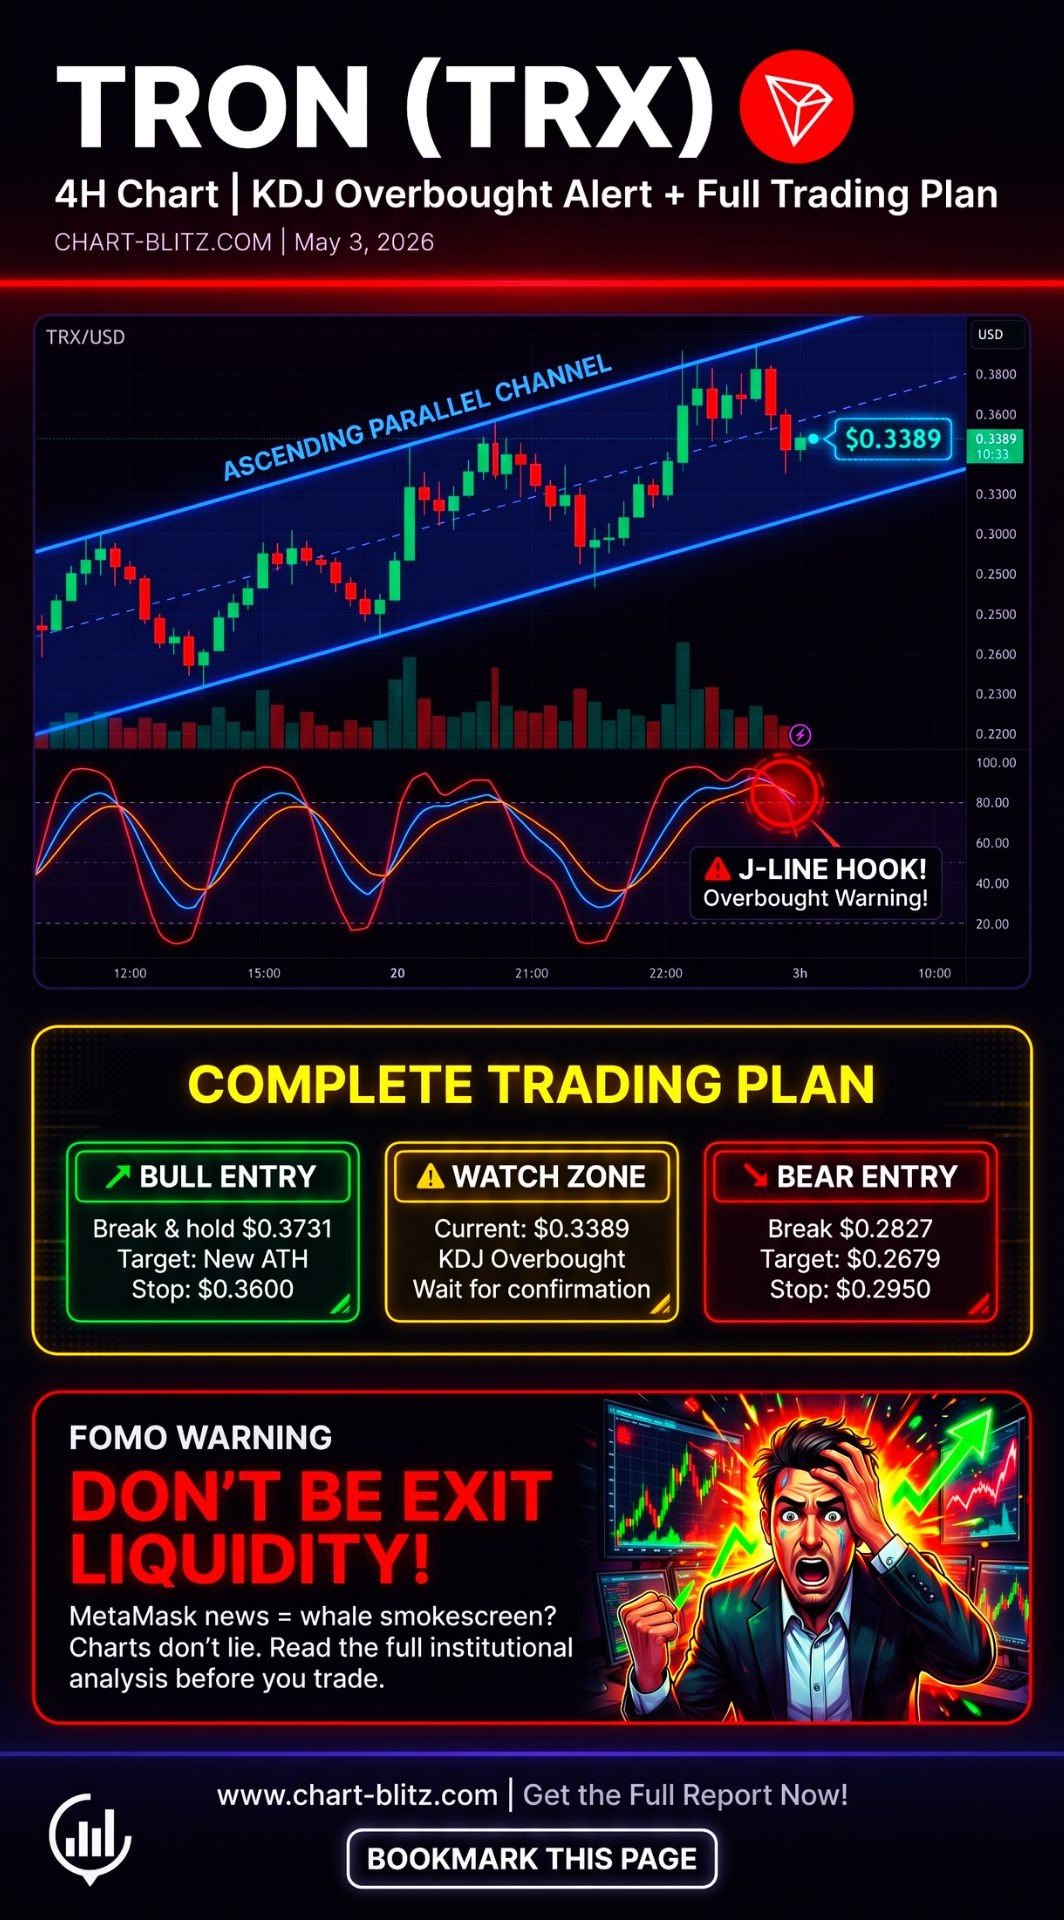
All technical analysis below is based on the price snapshot locked at May 3, 2026 17:34 ET: TRX = 0.3389 USD. Please treat this report as an “analysis map” rather than real-time quotes.
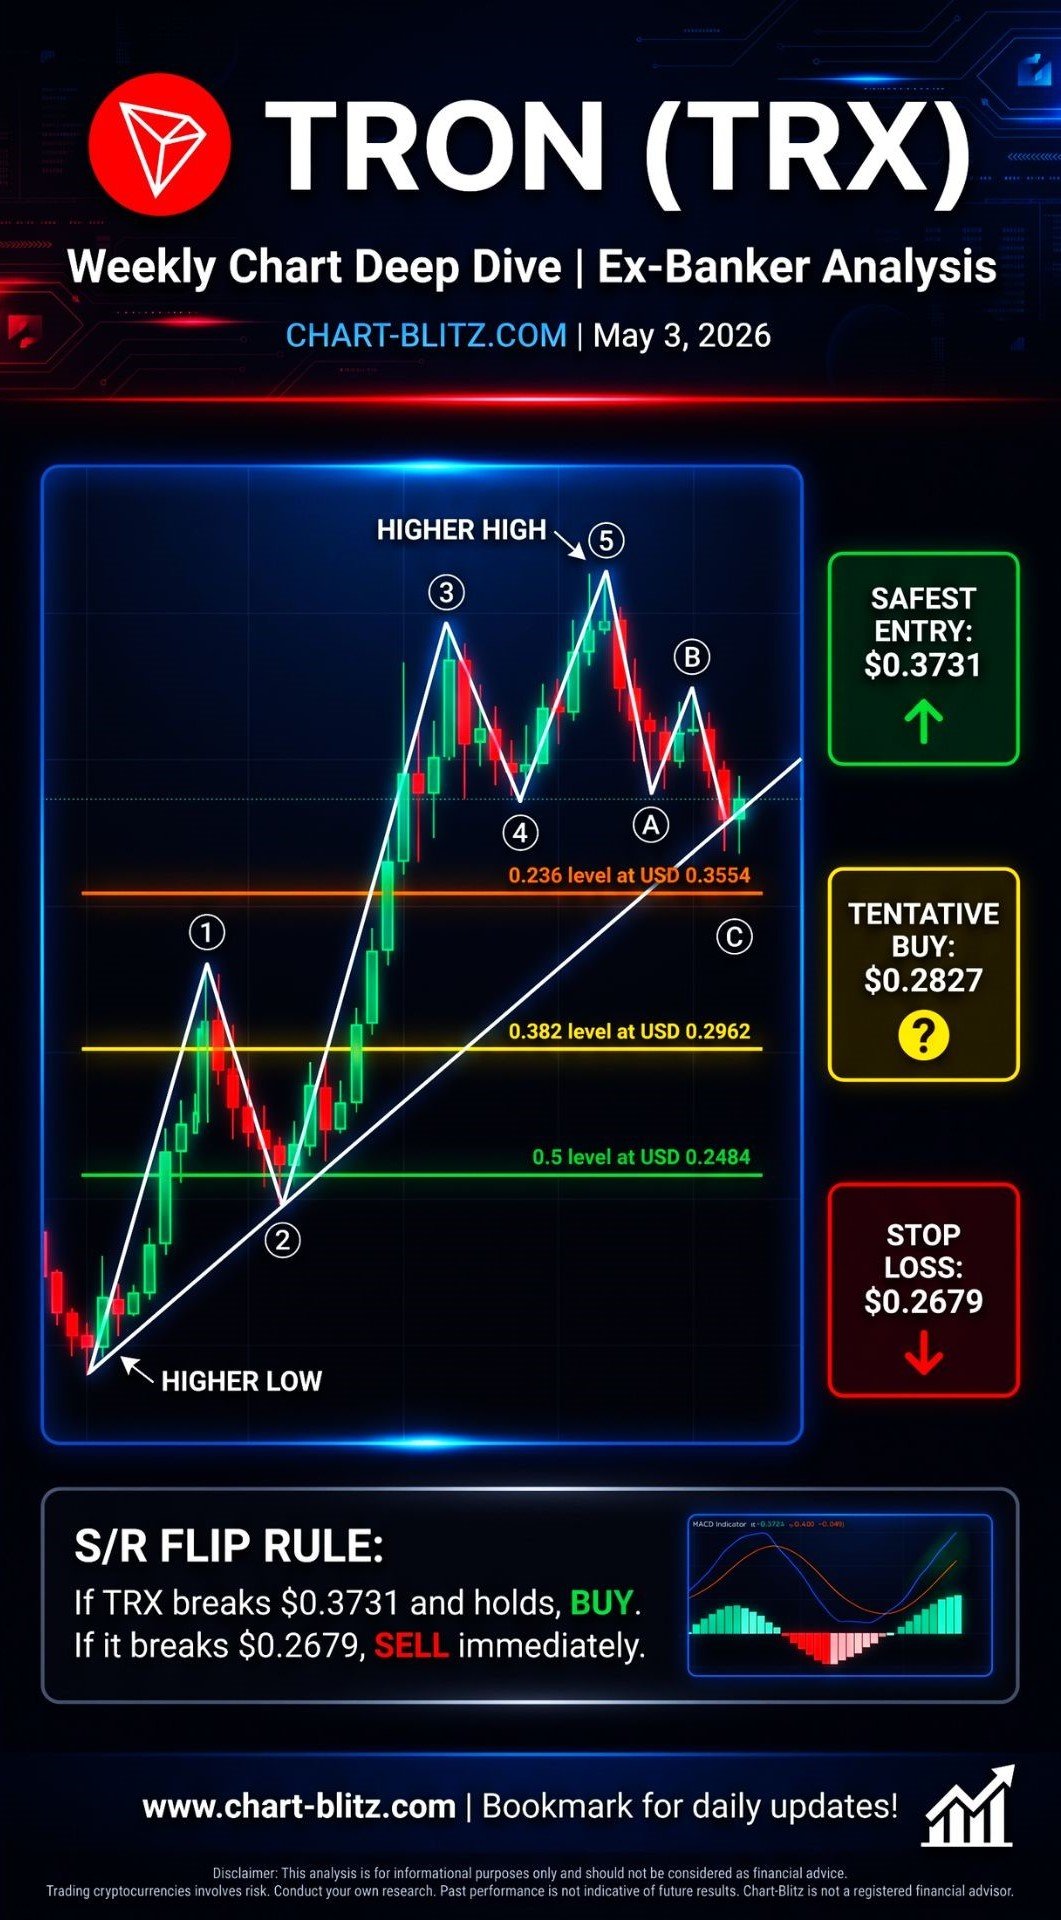
📈Weekly Chart: The Perfect Rendition of Elliott Wave & S/R Flips
Let’s start with the macro Weekly Chart. Here lies the true code of TRON’s long-term trajectory.
Weekly Timeframe for TRX (TRON)
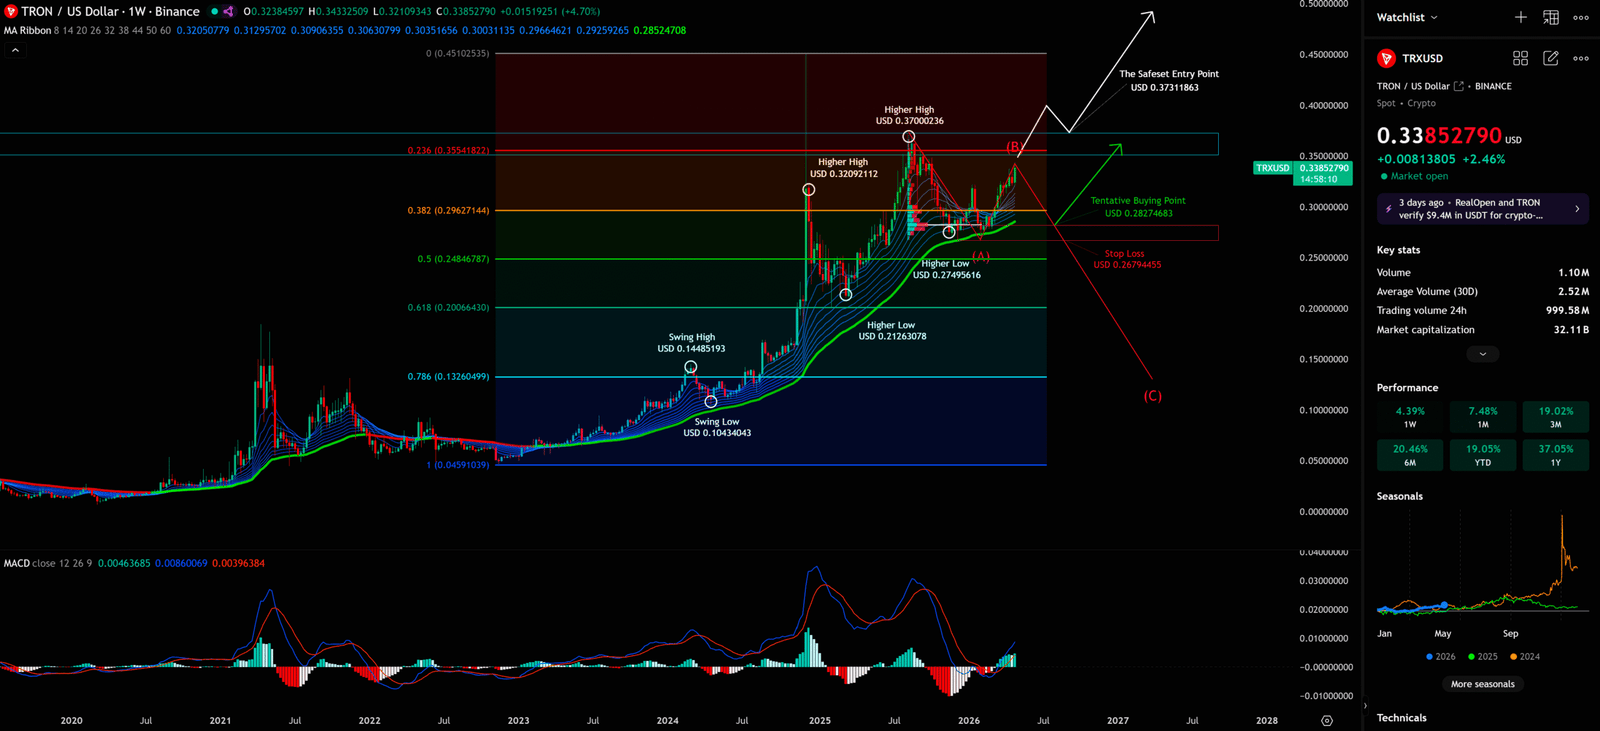
First, looking back at previous movements, from the Swing Low (USD 0.1043) rising to the Swing High (USD 0.1448), then pulling back, and subsequently launching a fierce impulse wave, creating a Higher High (USD 0.3209) and another Higher High (USD 0.3700). This is clearly an impulse wave structure, consistent with Dow Theory’s definition of “Higher Highs & Higher Lows.”
Note the (A), (B), (C) corrective wave projections marked on the chart. The current price is hovering around USD 0.3385, situated exactly within the 0.236 (USD 0.3554) and 0.382 (USD 0.2962) Fibonacci retracement zone. More importantly, there is a very obvious ascending Trendline supporting it from below.
Elliott Wave Iron Rule Warning: If this is a complete 1-2-3-4-5 upward impulse wave, then the current pullback might be wave 4. But remember, the bottom of wave 4 must absolutely not overlap with the price territory of the top of wave 1. If the price breaks below the key defense line, the entire impulse wave hypothesis will be completely shattered, and it might just be part of a larger degree corrective wave (A-B-C).
Three key price levels are marked on the chart:
| Key Level | Price | Significance |
| Safest Entry Point | USD 0.3731 | Breaking previous high, confirming trend continuation |
| Tentative Buying Point | USD 0.2827 | Tentative buy near trendline and 0.382 Fibo level |
| Stop Loss | USD 0.2679 | Breaking below indicates extremely high trend reversal risk |
Here, we must apply the logic of S/R Flip (Support and Resistance Flip): Theoretically, the downtrend (or pullback) of TRX should not be over yet, but if the TRX price action not only fails to continue falling but instead turns upwards and surges massively, we need to see if it can break the upward resistance zone (USD 0.3731). If it breaks up and stabilizes, then enter the market; conversely, if it hits the stop loss (USD 0.2679), sell and exit immediately.
Additionally, although the MACD indicator is currently still above the zero line, the Histogram shows weakening momentum, implying that there might still be oscillation or downward pressure in the short term. The EMA Ribbon on the weekly chart still maintains a bullish alignment, which is an important indicator of long-term trend health
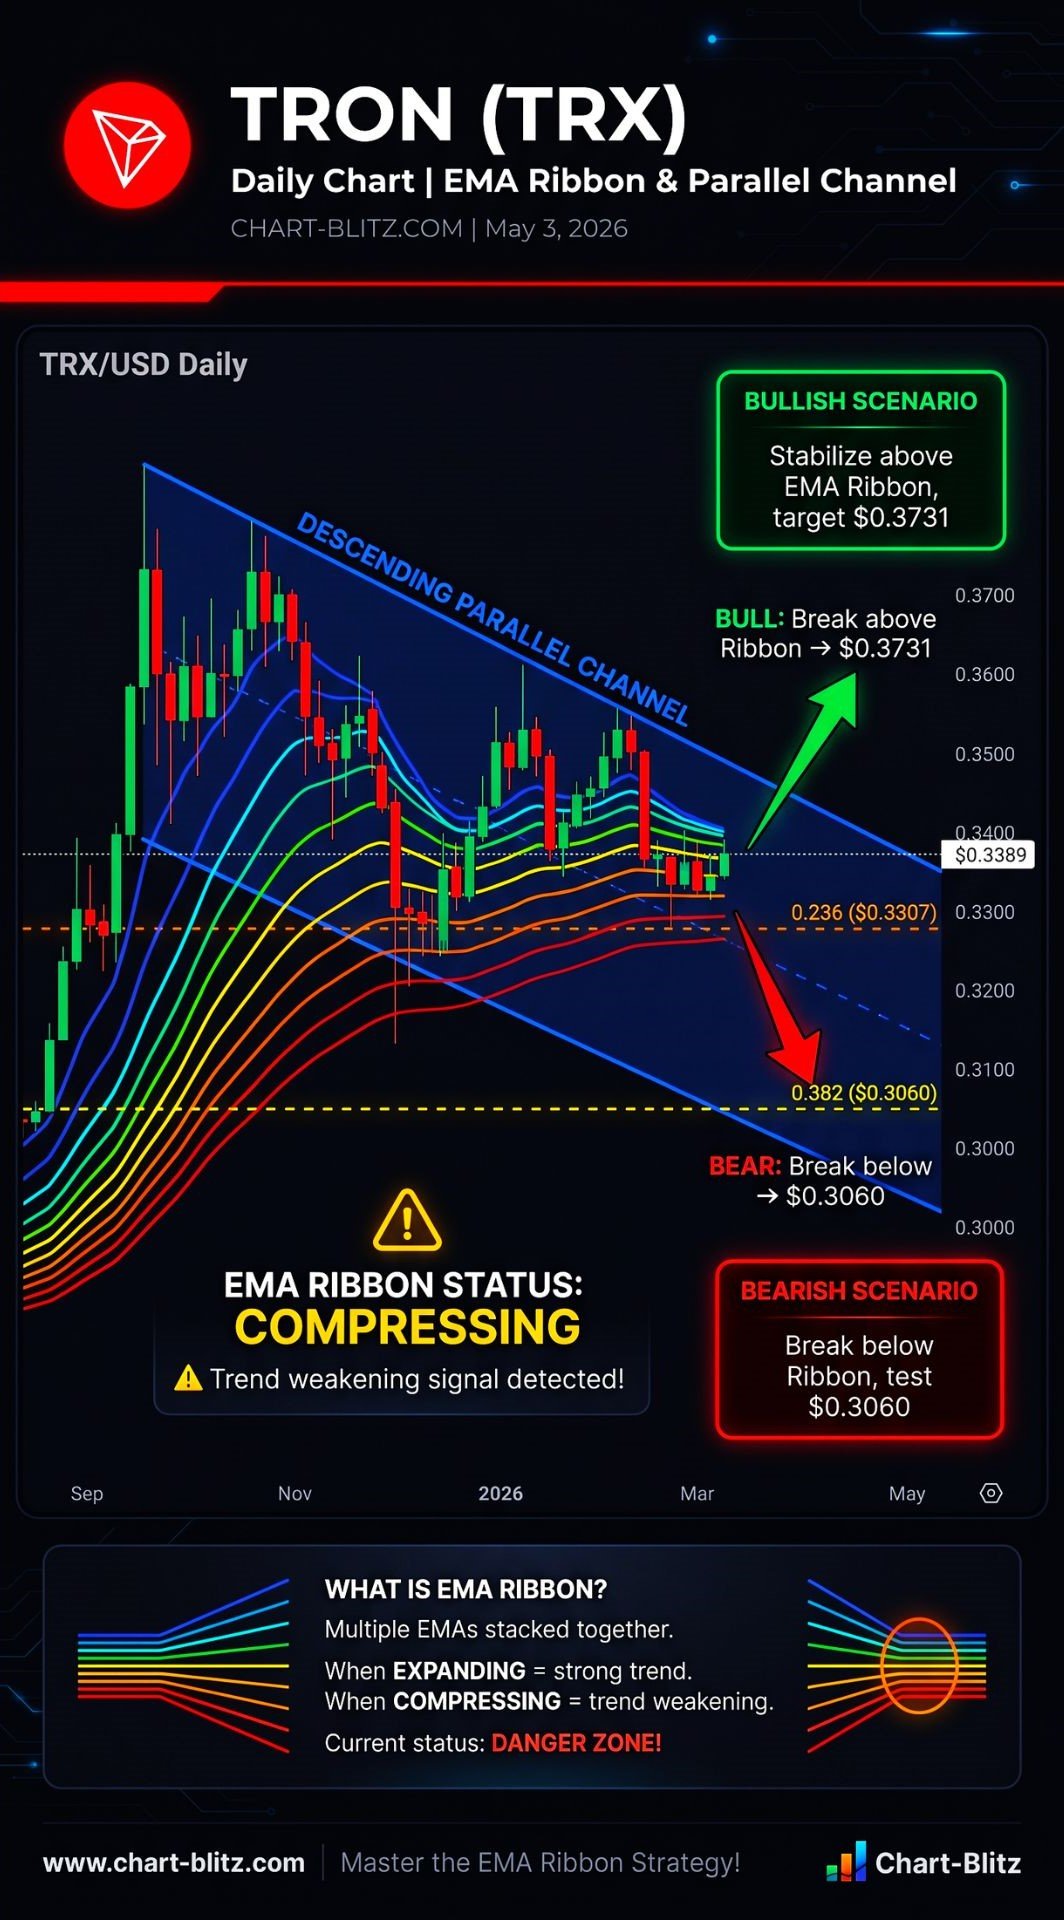
📊Daily Chart: The Game of EMA Ribbon & Parallel Channels
Zooming into the Daily Chart, the situation becomes clearer.
Daily Timeframe for TRX (TRON)
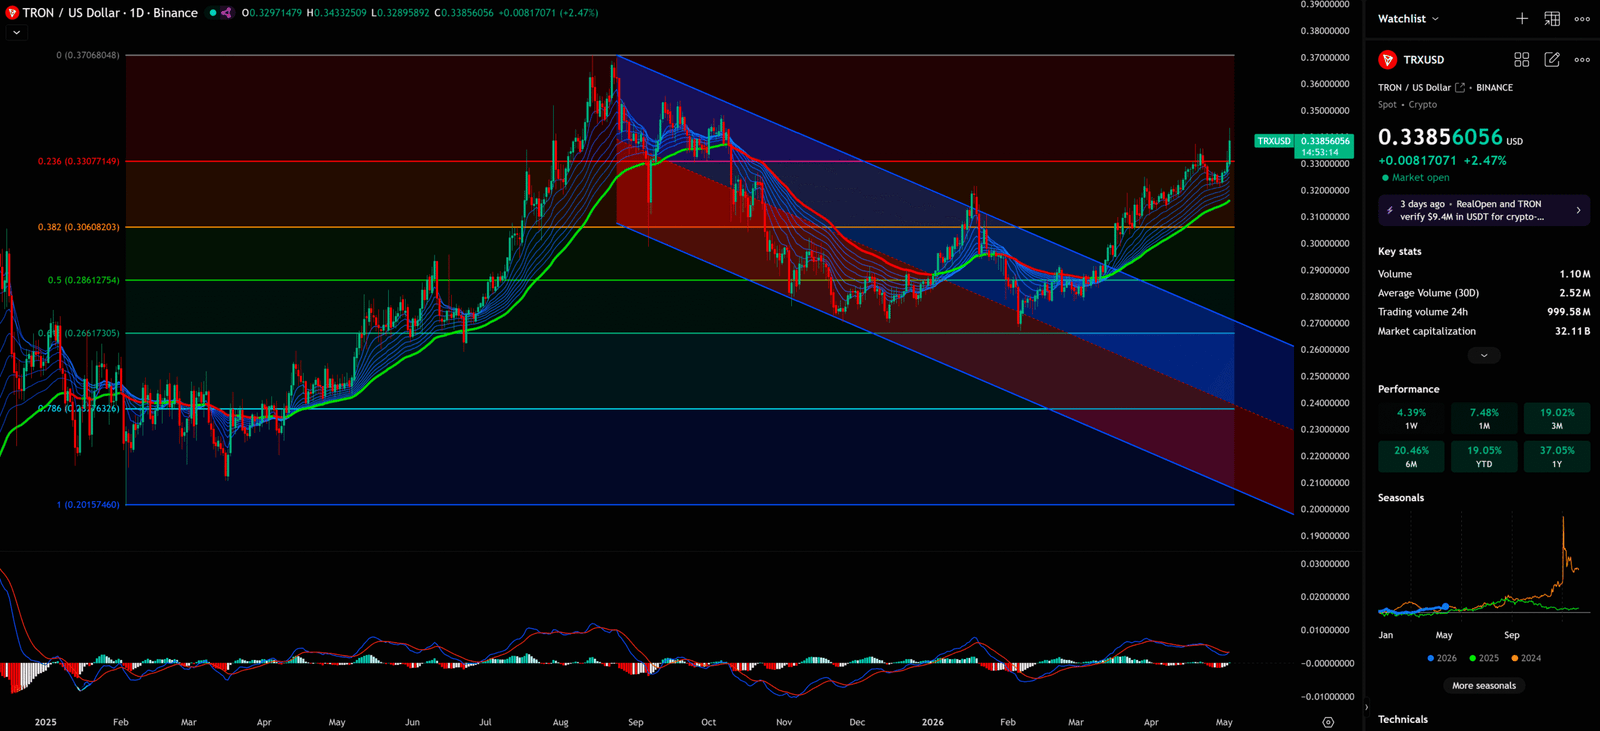
The most eye-catching is that massive Descending Parallel Channel. The price previously hit the top of the channel (around USD 0.37) and met resistance, falling back, and is currently near the midline of the channel. The existence of this channel is a true reflection of short-term market sentiment and an important clue to whale control.
Simultaneously, observe the state of the EMA Ribbon. The Ribbon previously showed a perfect bullish alignment (fanning upwards), but recently the price broke below some short-term EMAs, causing the Ribbon to start compressing and even showing signs of tangling. As mentioned in the EMA Ribbon tutorial, Ribbon compression represents weakening trend, bulls and bears wrestling, market indecision. This is a very important warning signal that cannot be ignored.
If the price can stabilize above the 0.236 Fibo (USD 0.3307) and climb back onto the EMA Ribbon, there is a chance to challenge the channel top again. Conversely, if it breaks below the Ribbon and seeks support at the channel bottom, the next key defense line will be around the 0.382 Fibo (USD 0.3060).
📅Monthly Chart: Bollinger Bands & Long-term Potential
Monthly Chart: Bollinger Bands & Long-term Potential.
Monthly Timeframe for