When you make a trade, you should have a clear target of where you expect to get out

William Delbert Gann – 1949

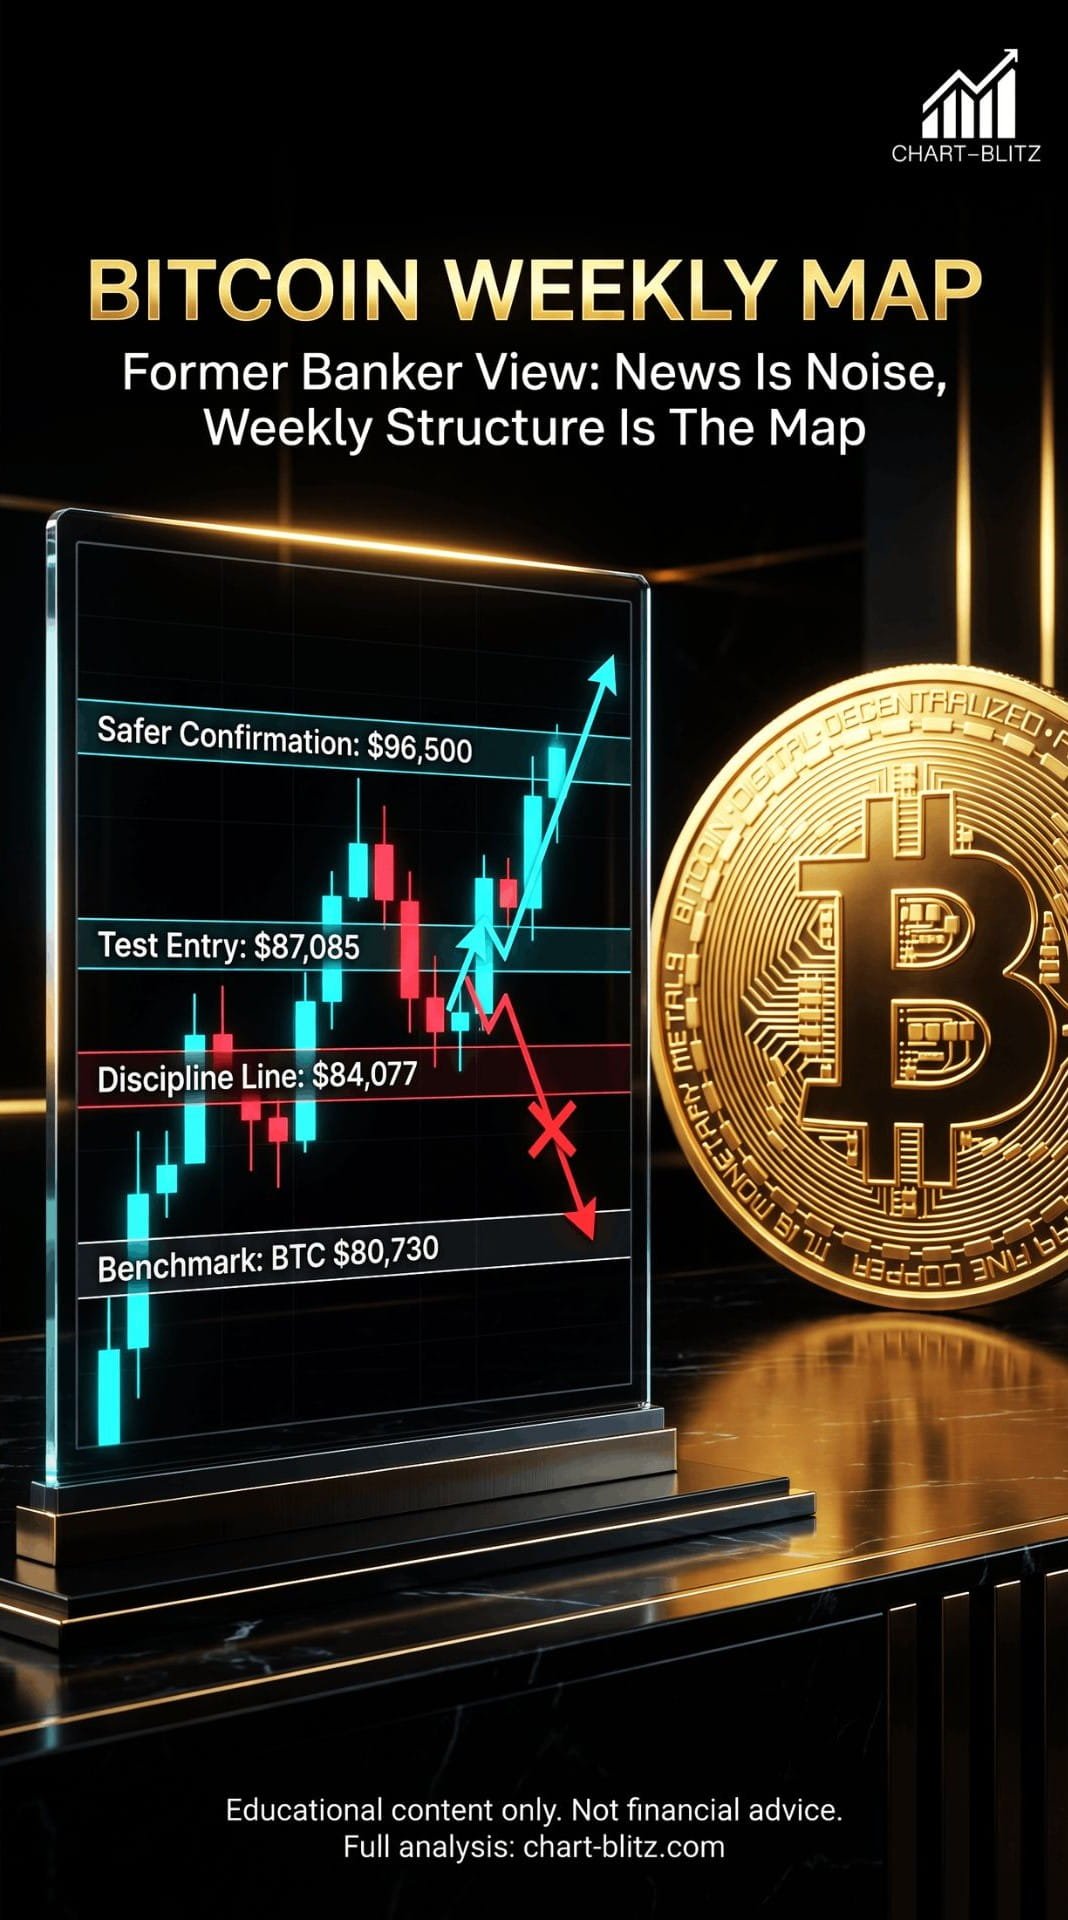
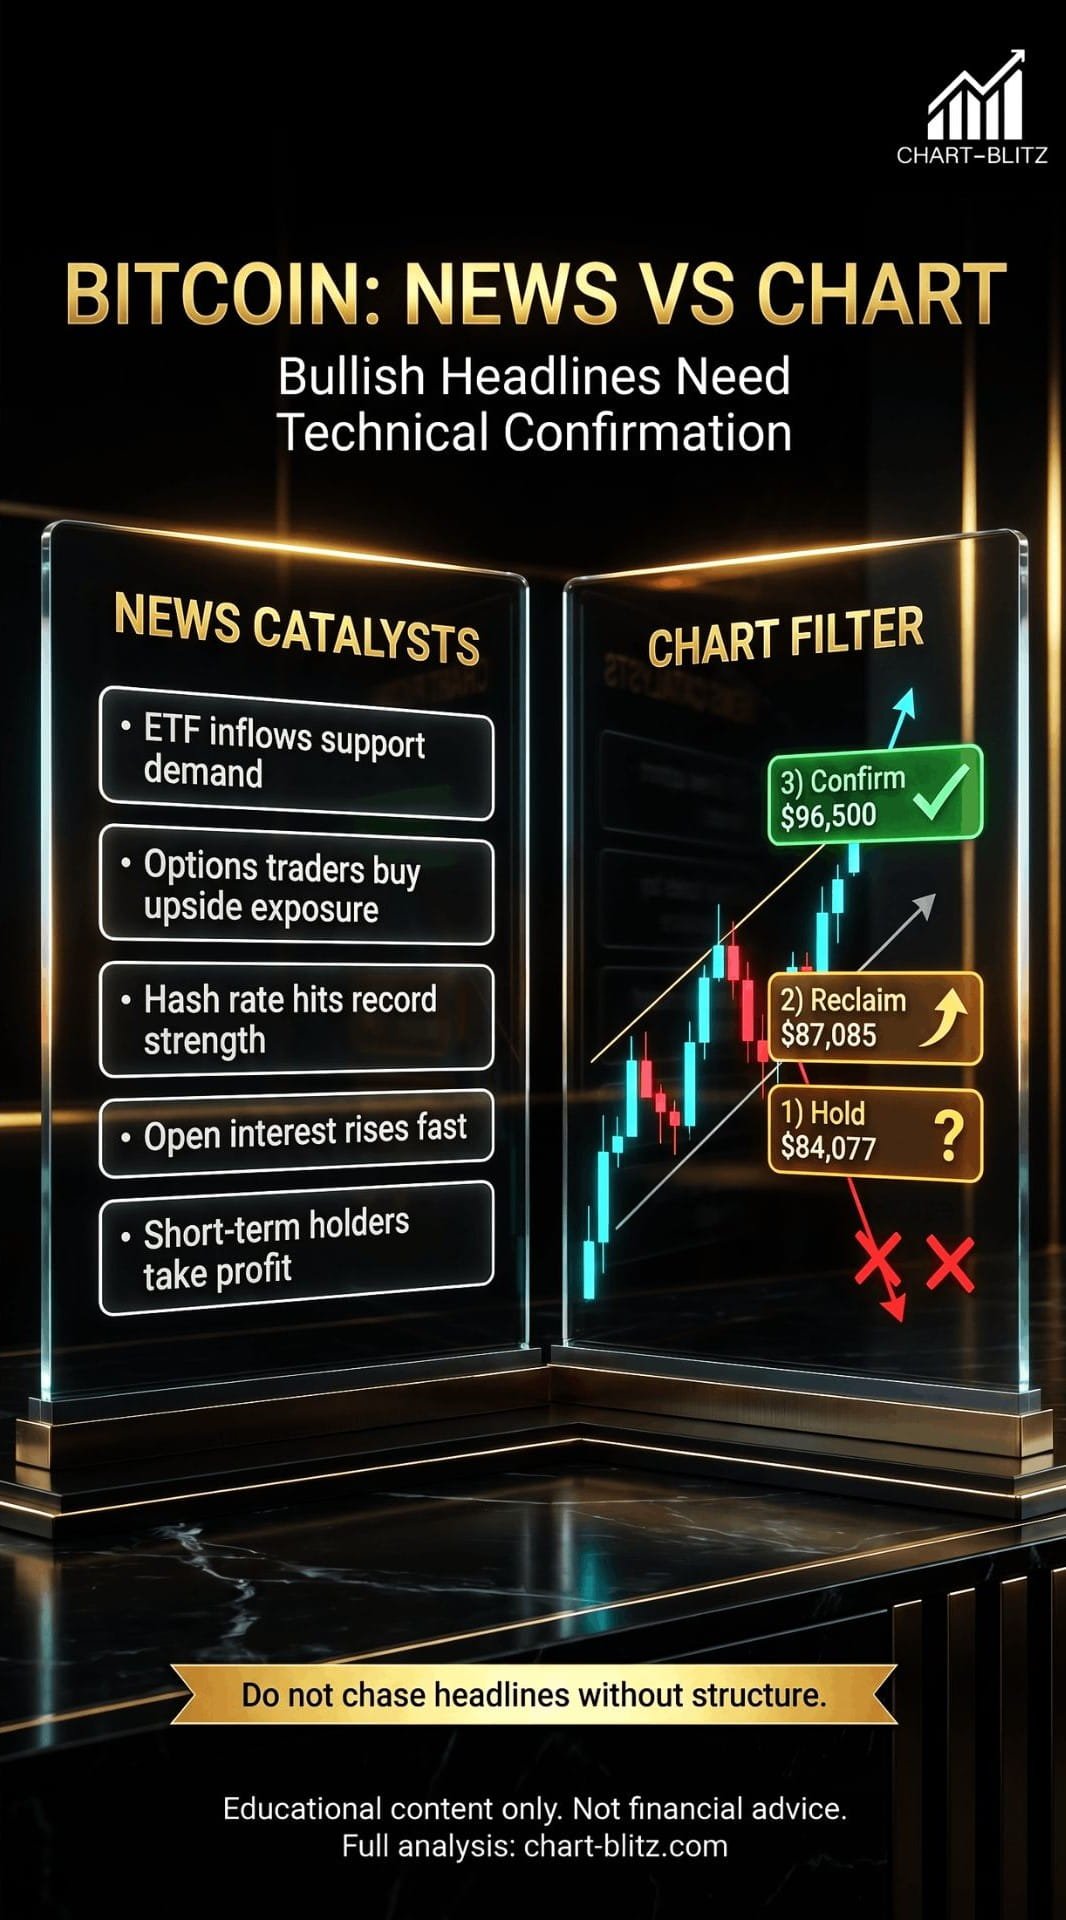
📰 The most dangerous part of the current Bitcoin market is not the drop below US$80,000 itself. The real danger is that the news flow sounds bullish enough to make retail traders forget where the weekly chart is actually located. Bitcoin has a strong headline package: ETF inflows, resilient options demand, improving institutional participation, stronger network security narratives, and derivative activity returning across major exchanges. But from a former banking-desk perspective, headlines are never the trade. Headlines only explain why the market is paying attention. The chart decides whether that attention is tradable.

CryptoSlate reported that Bitcoin briefly slipped below US$80,000, but options traders did not treat the dip as a structural breakdown. The same article cited CryptoQuant data showing that investors realized profits on 14,600 BTC on May 4, the largest one-day profit-taking event since December 2025. Short-term holder SOPR rose to 1.016 and stayed above 1 from mid-April, suggesting that recent buyers were still selling into profit rather than panic.1

At the same time, leverage has returned aggressively. BTC open interest recorded its largest increase of 2026, with Binance accounting for roughly 34% of the derivatives market and Gate.io and Bybit also showing elevated activity. When Bitcoin broke above US$78,600, approximately US$535 million in short positions were liquidated between May 4 and May 6, accelerating the move toward US$82,000–US$83,000. That matters because a short squeeze can create a sharp rally without proving that deep spot demand has returned.1

ETF flows add another layer of complexity. Yahoo Finance, citing BeInCrypto, reported that US spot Bitcoin ETFs recorded six straight weeks of net inflows through Friday, attracting a combined US$3.4 billion, the longest positive streak since July 2025. Yet buyers have recently stepped back: the funds saw back-to-back outflows of US$277.50 million on May 7 and US$145.65 million on May 8.4 In other words, institutional demand exists, but it is not blindly chasing every candle near US$80K.

This is where Chart-Blitz’s core philosophy becomes crucial: fundamental news tells the market what to analyze, but rigorous technical analysis tells traders when and how that story becomes actionable. A retail trader sees “ETF inflows” and thinks breakout. A professional trader sees the same headline and asks whether price has reclaimed resistance, whether volume supports the move, and whether the rally is powered by spot accumulation or leverage liquidation.

【📊Analysis Baseline Statement】

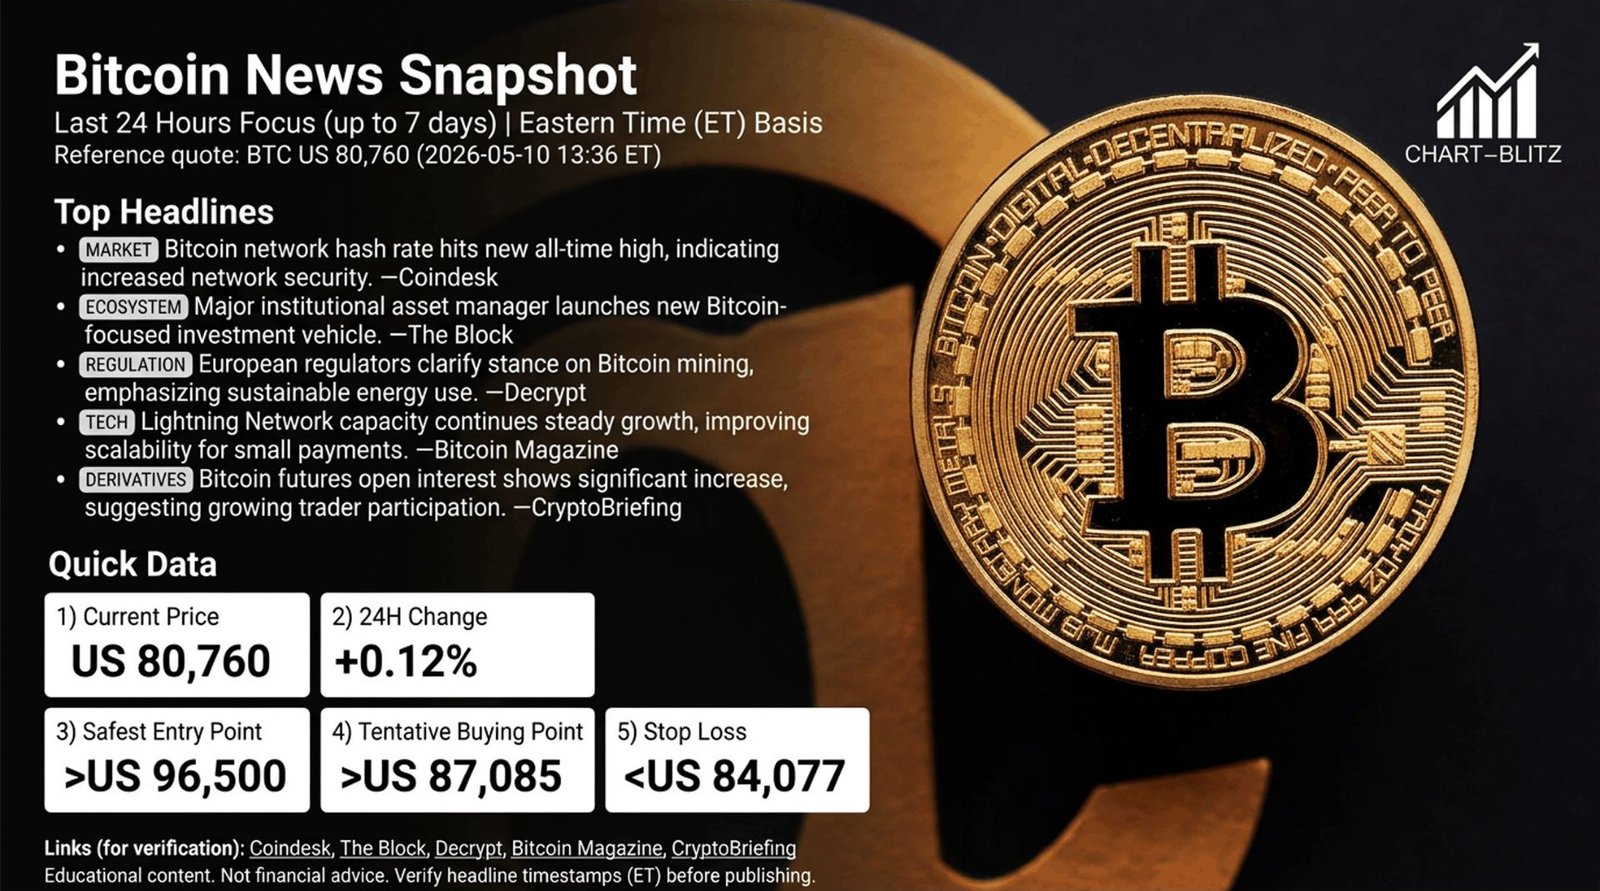
All technical analysis below is based on the locked price snapshot at 2026-05-09 13:49 ET / 2026-05-10 01:49 GMT+8: BTC = US$80,730 USD. Please treat this report as an analytical map, not a live quote. The benchmark is derived from the cross-average of CoinGecko’s US$80,730.14 and CoinMarketCap’s US$80,729.98, with CryptoSlate’s US$80,715.20 widget reading used as a third sanity check..

未命名設計 – 1

📈Weekly Chart: The Real Battlefield Is US$87,085 and US$96,500

Let’s start with the macro Weekly Chart. Here lies the true code of TRON’s long-term trajectory.

Weekly Timeframe for BTC (Bitcoin)
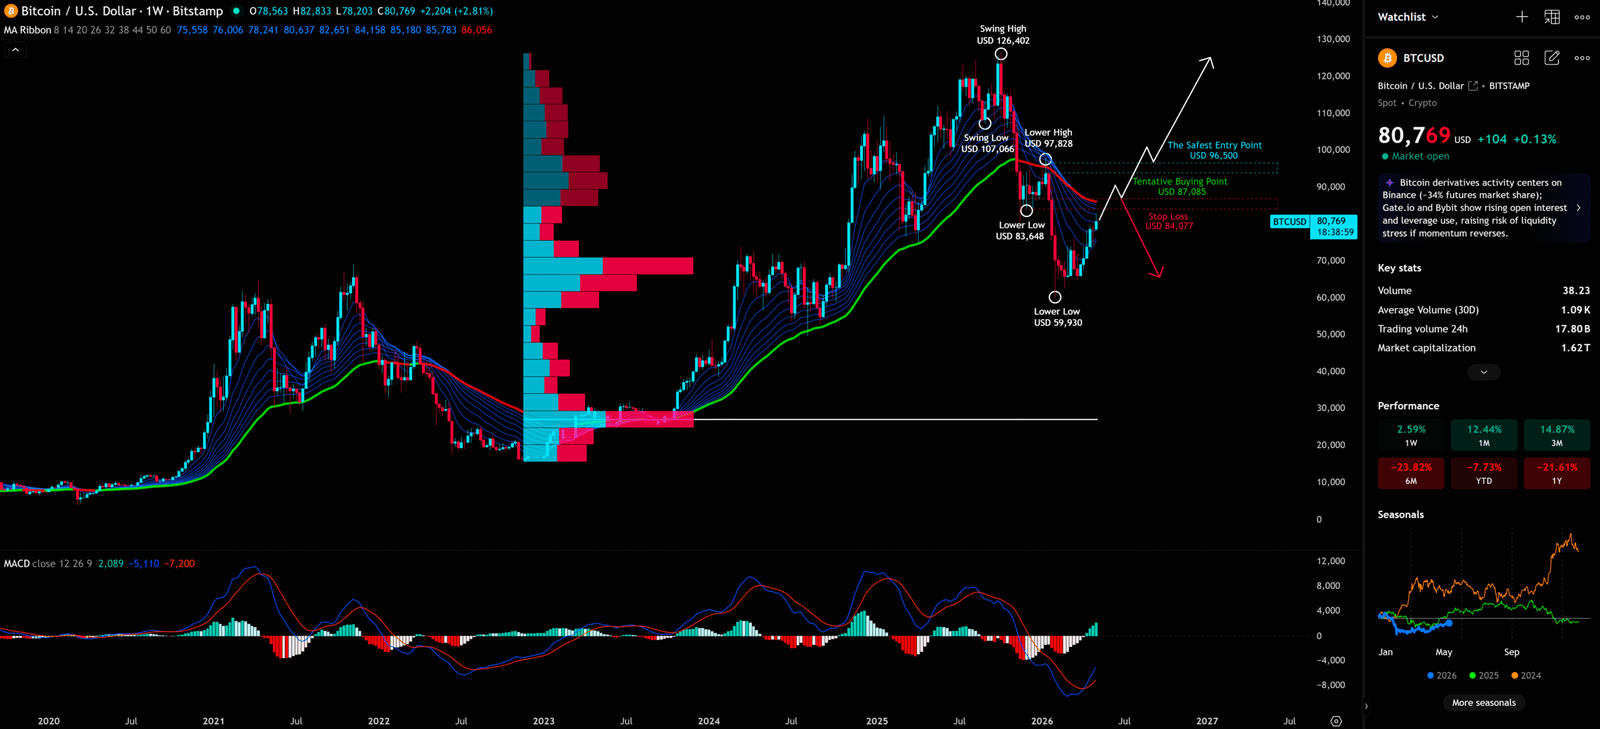
The weekly chart must remain the core framework. The user’s weekly BTCUSD Bitstamp chart shows MA Ribbon, VPFR, MACD, and several critical annotations. The swing sequence is not yet a clean bullish continuation. Bitcoin printed a Swing High at US$126,402, then a Swing Low at US$107,066, then a Lower High at US$97,828, followed by a Lower Low at US$83,648, and an even deeper marked Lower Low at US$59,930. Under Dow Theory, a sequence of lower highs and lower lows cannot be dismissed simply because price has bounced back to US$80K.
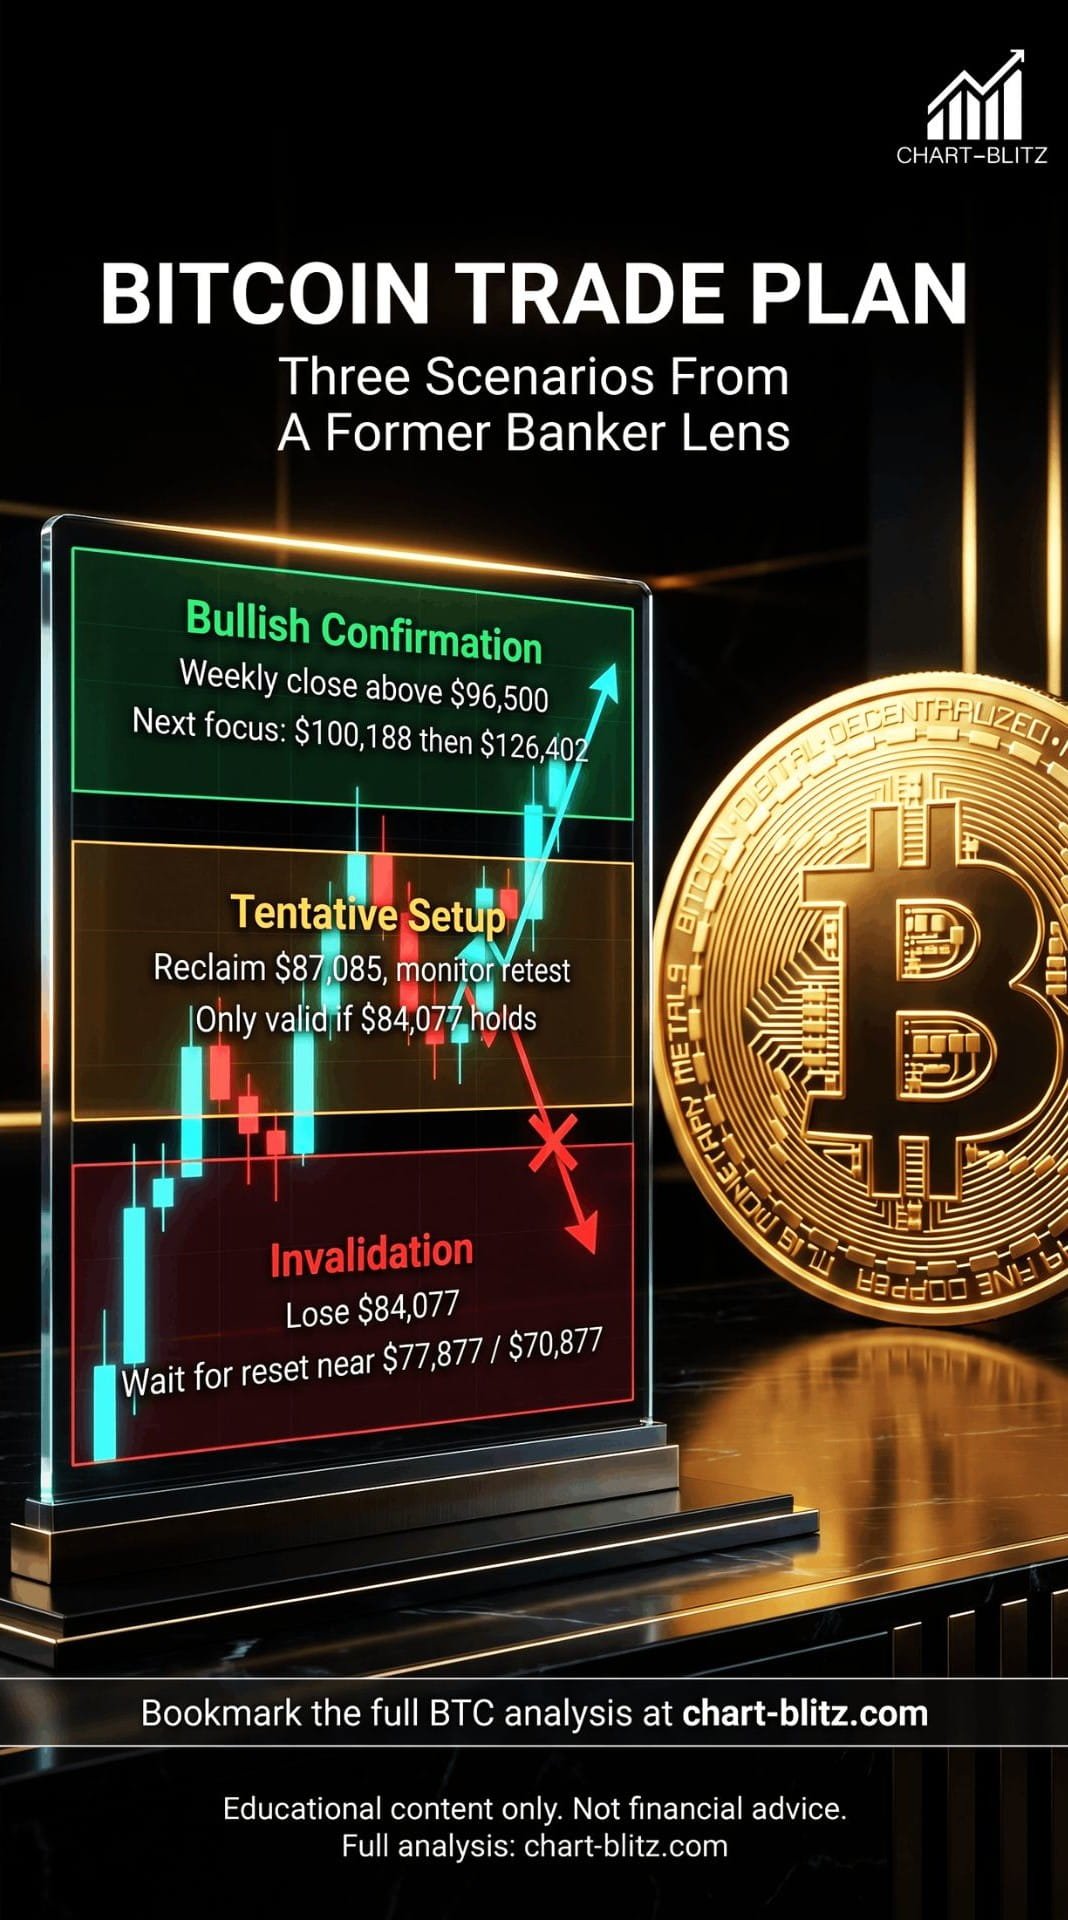
The user’s three trading levels are the heart of the strategy: Tentative Buying Point = US$87,085, The Safest Entry Point = US$96,500, and Stop Loss = US$84,077. These levels should not be treated as decorative labels. They define the risk architecture. US$87,085 is the first test of strength; US$96,500 is the more reliable confirmation zone; US$84,077 is the point where the bullish breakout assumption must be questioned.

VPFR adds an institutional dimension. Volume Profile Fixed Range helps identify where market participants have exchanged meaningful size. Areas with heavy participation become memory zones; areas with thin participation can behave like vacuum zones, where price travels quickly because there is limited historical liquidity. If bullish news pushes price into a low-volume pocket, institutions may use the resulting excitement as exit liquidity. Retail traders see momentum; professional desks see inventory transfer.

The weekly MA Ribbon is recovering, but it is not yet in a clean bullish expansion. Price has moved back toward the moving average cluster, while MACD has improved from deeply negative momentum. However, improving momentum is not the same as confirmed reversal. A proper bullish confirmation would require price to reclaim the key resistance band and for MACD to expand positively with structure, not merely rebound from oversold conditions.

The support/resistance flip rule is the central trading logic: Theoretically, BTC’s decline may not be fully over. However, if BTC refuses to continue lower and instead turns upward aggressively, the key is whether it can rise into the resistance zone, break above it, and hold. If it breaks and holds, entry can be considered; if not, the trade must be exited at the stop-loss zone. In this setup, US$87,085 is the initial resistance flip test, while US$96,500 is the safer confirmation gate.

Elliott Wave must be handled with discipline. If one wants to interpret the correction as a large Wave 4, the iron rule is non-negotiable: the bottom of Wave 4 must never overlap the top of Wave 1. If BTC breaks the critical structural defense and invalidates the five-wave impulse assumption, then the entire 1-2-3-4-5 bullish count may collapse into a larger corrective A-B-C structure. The market does not reward traders for forcing a wave count after price has invalidated it.

A former banking-desk analogy is useful here. On a professional desk, a trader does not buy because the news terminal flashes “ETF inflow.” The trader checks whether the weekly chart has reclaimed the previous lower high, whether volume confirms the move, and whether the stop level is logically placed. If price rallies into resistance but closes back below it, that is not a breakout; it is a well-lit trapdoor for impatient buyers.

📊Daily Chart: Fibonacci Shows Repair, Not Victory

Zooming into the Daily Chart, the situation becomes clearer.

Daily Timeframe for BTC (Bitcoin)

The daily chart uses a Fibonacci retracement from US$15,365 to US$126,390. The key levels are clear: 0.236 at US$100,188, 0.382 at US$83,978, 0.5 at US$70,877, 0.618 at US$57,776, and 0.786 at US$39,124. The locked benchmark around US$80,730 sits between the 0.5 and 0.382 levels. This is a repair zone, not a victory zone.

The overlap between daily Fibonacci and weekly risk control is important. The 0.382 level at US$83,978 is almost identical to the weekly stop-loss reference at US$84,077. This creates a high-value confluence band around US$83,978–US$84,077. If Bitcoin can reclaim this zone and hold above it, the road to US$87,085 becomes more credible. If price fails here, the daily chart remains in a rebound-within-resistance structure.

Daily MACD is recovering from a deeply negative position, which supports the idea that downside momentum has weakened. Yet MACD is a momentum tool, not a license to ignore resistance. A bullish MACD cross below key Fibonacci resistance can generate a tradable bounce, but it does not automatically confirm a new bull leg. The correct interpretation is that momentum has improved enough to challenge resistance, not that resistance has already been defeated.

Retail traders often confuse recovery with reversal. Institutions separate the two. A recovery can lift price from US$70K toward US$80K. A reversal requires price to reclaim lost structure. That is why the sequence matters: first US$83,978–US$84,077, then US$87,085, then US$96,500. Each level reduces uncertainty. Skipping the sequence is not confidence; it is gambling..

📅Monthly Chart: Long-Term Structure Is Alive, but Not Yet Aggressive

Monthly Chart: Bollinger Bands & Long-term Potential.

Monthly Timeframe for BTC (Bitcoin)

The monthly chart should be read slowly. Short-term derivative squeezes, ETF headlines, and option skew changes can all create noise, but the monthly chart asks a different question: has the long-term trend resumed? The chart shows Donchian Channel and MACD. It does not visibly show Bollinger Bands, Parabolic SAR, or Stochastic Oscillator, so a professional analysis should not pretend those signals are present.

Donchian Channel marks the highest high and lowest low over a chosen period. On the monthly BTC chart, the upper region remains near the prior high around US$126K, while price has rebounded to roughly US$80K after a sharp decline. This means the long-term structure is not broken beyond repair, but price is still far from reclaiming the upper channel area. The market is rebuilding confidence, not launching an unconditional continuation.

Monthly MACD remains cautious. The histogram is still negative, though the red bars have improved from the deepest phase. This is a sign of bearish momentum fading, not yet a full bullish takeover. For the monthly chart to truly support an aggressive bullish thesis, BTC would ideally need to reclaim US$96,500, push toward the US$100,188 Fibonacci level, and show MACD expansion rather than mere stabilization.

The missing indicators are also part of the professional conclusion. A future chart including Bollinger Band, Parabolic SAR, and Stochastic Oscillator would improve the long-term assessment. Bollinger Band would show whether volatility is expanding or compressing; Parabolic SAR would help track long-term trailing reversal; Stochastic would add an overbought/oversold momentum layer. For now, the evidence available supports caution: long-term BTC is alive, but not yet screaming “all-in.”.

⏱️4-Hour Chart: Tactical Rebound, Not Strategic Confirmation

Finally, let’s look at the short-term movements on the 4-Hour Chart.

4-Hour Timeframe for BTC (Bitcoin)

The 4-hour chart captures the market’s breathing pattern. It shows GMMA/EMA Ribbon and MACD. After the February decline, BTC has gradually built a sequence of higher lows into March, April, and May. This aligns with the derivatives narrative: price recovered from pressure, shorts were squeezed, and US$80K became a battleground.

GMMA/EMA Ribbon helps traders understand trend speed and cost basis. When short-term averages expand above longer-term averages, buyers dominate. When the ribbon compresses, direction is uncertain. When it flips downward, sellers regain control. BTC’s current 4-hour ribbon is improving but not explosively bullish. It shows tactical recovery, not weekly confirmation.

The 4-hour MACD is mildly positive near the zero line. That supports short-term continuation if price holds its higher-low structure. The ideal bullish short-term setup would require BTC to hold the ribbon, keep MACD from rolling over, and push into the daily confluence zone around US$83,978–US$84,077. Only then does the move toward US$87,085 become technically persuasive.

If BTC loses the 4-hour ribbon and MACD flips negative again, the market may revisit US$78K, US$75K, or even the daily 0.5 Fibonacci region at US$70,877. This does not mean collapse is guaranteed. It means tactical traders should not use a 4-hour bounce to overrule weekly resistance..

💡 Comprehensive Conclusion & Trading Plan: Let the Market Prove It

StrategyTriggerActionRisk Control
Conservative breakoutBTC holds above US$96,500Treat as safer confirmation; monitor US$100,188, US$107,066, and US$126,402Reassess if price falls back below US$87,085
Aggressive pilot entryBTC reclaims US$87,085 and successfully retests itConsider small position first; add only if US$96,500 confirmsExit if US$84,077 fails
Defensive waitBTC fails at US$83,978–US$84,077Avoid chasing; wait for lower support or renewed confirmationDo not buy purely because headlines are bullish
Re-entry after stopBTC loses US$84,077 but later reclaims US$87,085Re-enter only if S/R Flip re-establishes itselfAvoid revenge trading

The Bullish scenario requires Bitcoin to reclaim US$83,978–US$84,077, break above US$87,085, and eventually hold US$96,500. If that sequence occurs, the next upside zones are US$100,188, US$107,066, and possibly the former high near US$126,402.

The Bearish scenario begins if BTC cannot reclaim the confluence zone and loses US$80K again. A deeper failure below US$70,877 would shift the market back into defensive mode and put US$57,776 on the radar.

The cleanest conclusion is this: Bitcoin has enough momentum to keep rebounding, but not enough evidence to declare the weekly down-structure fully reversed. US$87,085 is the test. US$96,500 is the confirmation. US$84,077 is the discipline.

🧠Retail vs. Institutions: The Information Gap That Never Closes

In the wild and greedy cryptocurrency market, there is always a massive information gap between retail investors and institutions.

The retail decision process typically looks like this: See bullish news → Feel FOMO → Rush to enter → Become institutional ‘Exit Liquidity’. The institutional decision process is entirely different: Analyze chart structure → Identify key support/resistance → Wait for S/R Flip confirmation → Quietly exit while retail is FOMOing in.

This is why, every time the market is flooded with overwhelmingly positive news, it is often also the most dangerous time. Because institutions need retail’s buying pressure to absorb their selling, and bullish news is the best bait to attract retail into the market.

In the bank’s trading room, I’ve witnessed this scene too many times: while retail investors were cheering and celebrating, my colleagues were quietly pressing the ‘sell’ button. This isn’t a conspiracy theory — it’s the operating law of the market.

I will continue to closely monitor the price action of this Crypto. As soon as a critical reversal signal appears on the charts, I will update my analysis and insights right here immediately. Remember to Bookmark this page and come back often to check for the latest updates!

Want to see our full, interactive chart breakdown? If you want to learn how to draw weekly VPFR, Fibonacci, EMA Ribbon, MACD, Donchian Channel, and S/R Flip frameworks designed for real trading decisions. Please browse the following『Further Reading』links. Fundamental news tells you what happened. Technical analysis predicts what will happen. To master the professional framework that separates market signal from noise, explore our exclusive models at www.chart-blitz.com.

📚Further Reading:

To help everyone gain a deeper understanding of the various technical indicators mentioned in this article, we have specially prepared the following further reading materials. These cover key analytical tools found across the weekly, daily, monthly, and 4-hour charts.

  1. Decoding Fibonacci Retracement: The Perfect Blend of Natural Law and Market Psychology Fibonacci Retracement is not just a set of magical numbers; it is a manifestation of market psychology. Learning how to correctly draw and interpret Fibonacci levels is a required course for every serious trader.
  2. Elliott Wave Theory Practical Manual: Key Rules for Identifying Impulse and Corrective WavesElliott Wave Theory is one of the most complex yet powerful tools in technical analysis. Understanding how to identify impulse and corrective waves, along with the iron rules of Elliott Wave Theory, can help you find direction in the market.
  3. Understanding VPFR: Finding the Hidden Footprints of Market MakersThe Volume Profile Fixed Range (VPFR) is a powerful tool that tells us where the most trading occurred within a specific price range. This helps us identify true support and resistance levels, as well as potential ‘Vacuum Zones’.
  4. S/R Flip Support and Resistance Swap StrategyS/R Flip is one of the most powerful concepts in technical analysis. This article uses real cases to teach you how to use S/R Flip to capture the highest win-rate trading opportunities.
  5. MACD Momentum Indicator Momentum First — What Does the MACD Line Crossing Above Zero Mean? Golden Cross & Divergence Signals!
  6. Parallel Channel Short-Term GameHow to Use Parallel Channels to Find Precise Entry/Exit Points for BTC short-term opportunities.
  7. EMA Ribbon Practical Guide: Catching Early Trend SignalsThrough the arrangement of multiple exponential moving averages, the EMA Ribbon intuitively displays the strength and changes of market trends. Learning to interpret the convergence and divergence of the EMA Ribbon allows you to spot trading opportunities ahead of others.
  8. Bollinger Bands Deep Dive: The Prophet of Volatility and Extreme Market ConditionsCombining moving averages and standard deviation, Bollinger Bands are an excellent tool for measuring market volatility. When the price touches the band boundaries, it often foreshadows a potential reversal or breakout.

【Disclaimer】 The content herein is for educational purposes and reflects the author’s personal opinion only; it is not investment advice. All financial investments, including cryptocurrencies, carry significant risk, and you could lose your entire capital. To support this site, this article may contain affiliate links. While we strive for accuracy, we cannot guarantee all information is complete or error-free. Please conduct your own research and be fully responsible for your own investment decisions.

Leave a Reply

Your email address will not be published. Required fields are marked *