Fetching Live Market Data...
When you make a trade, you should have a clear target of where you expect to get out
William Delbert Gann – 1949
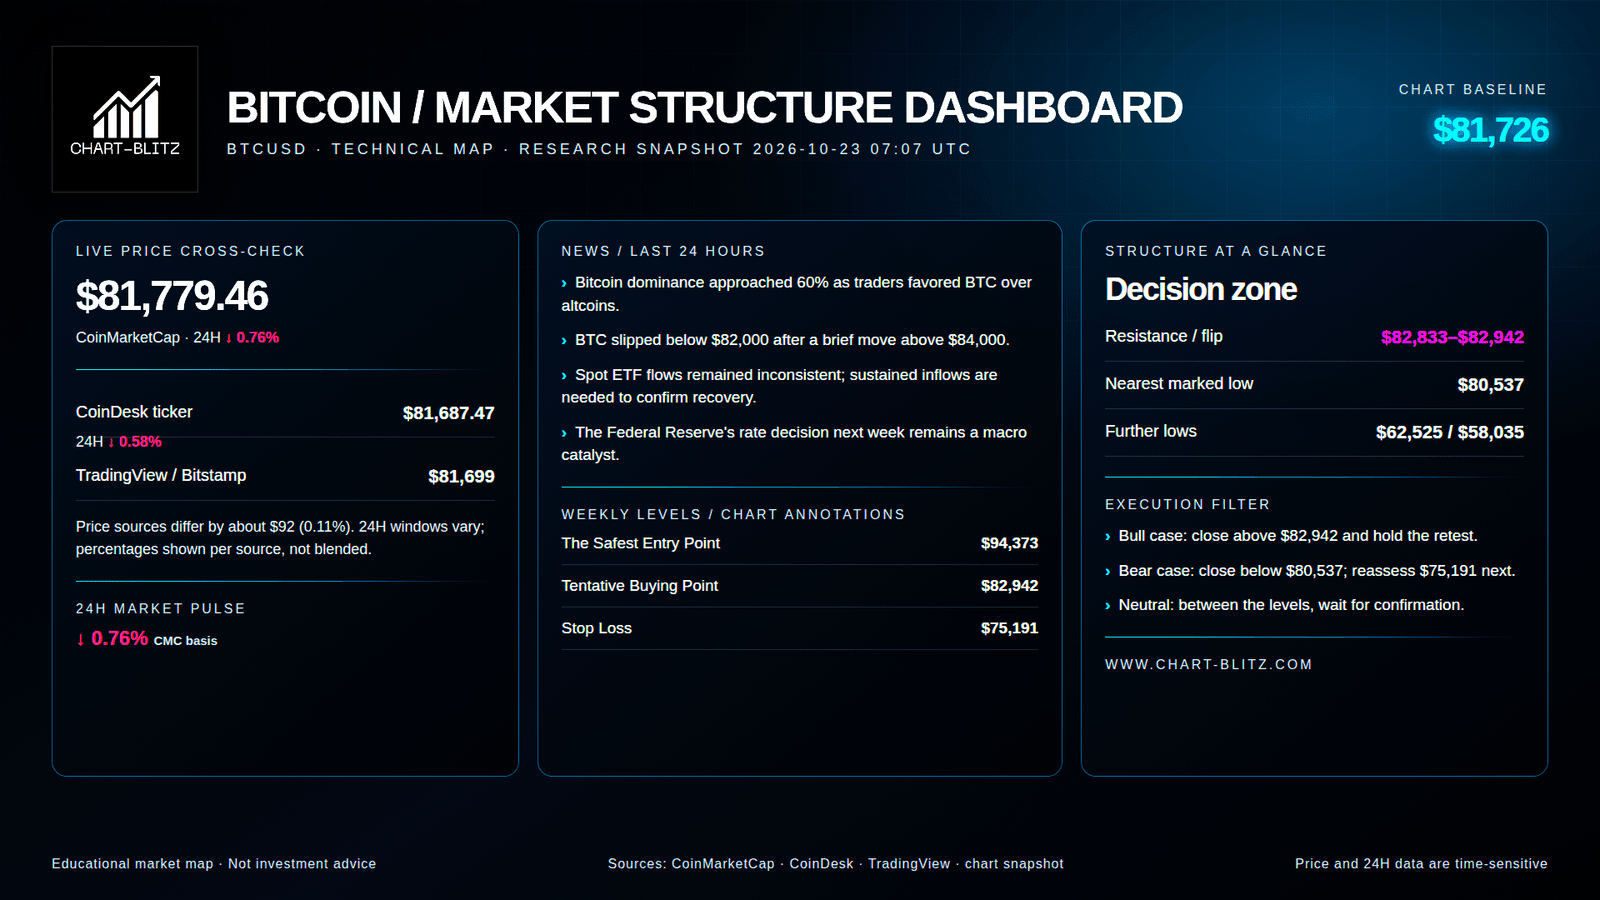
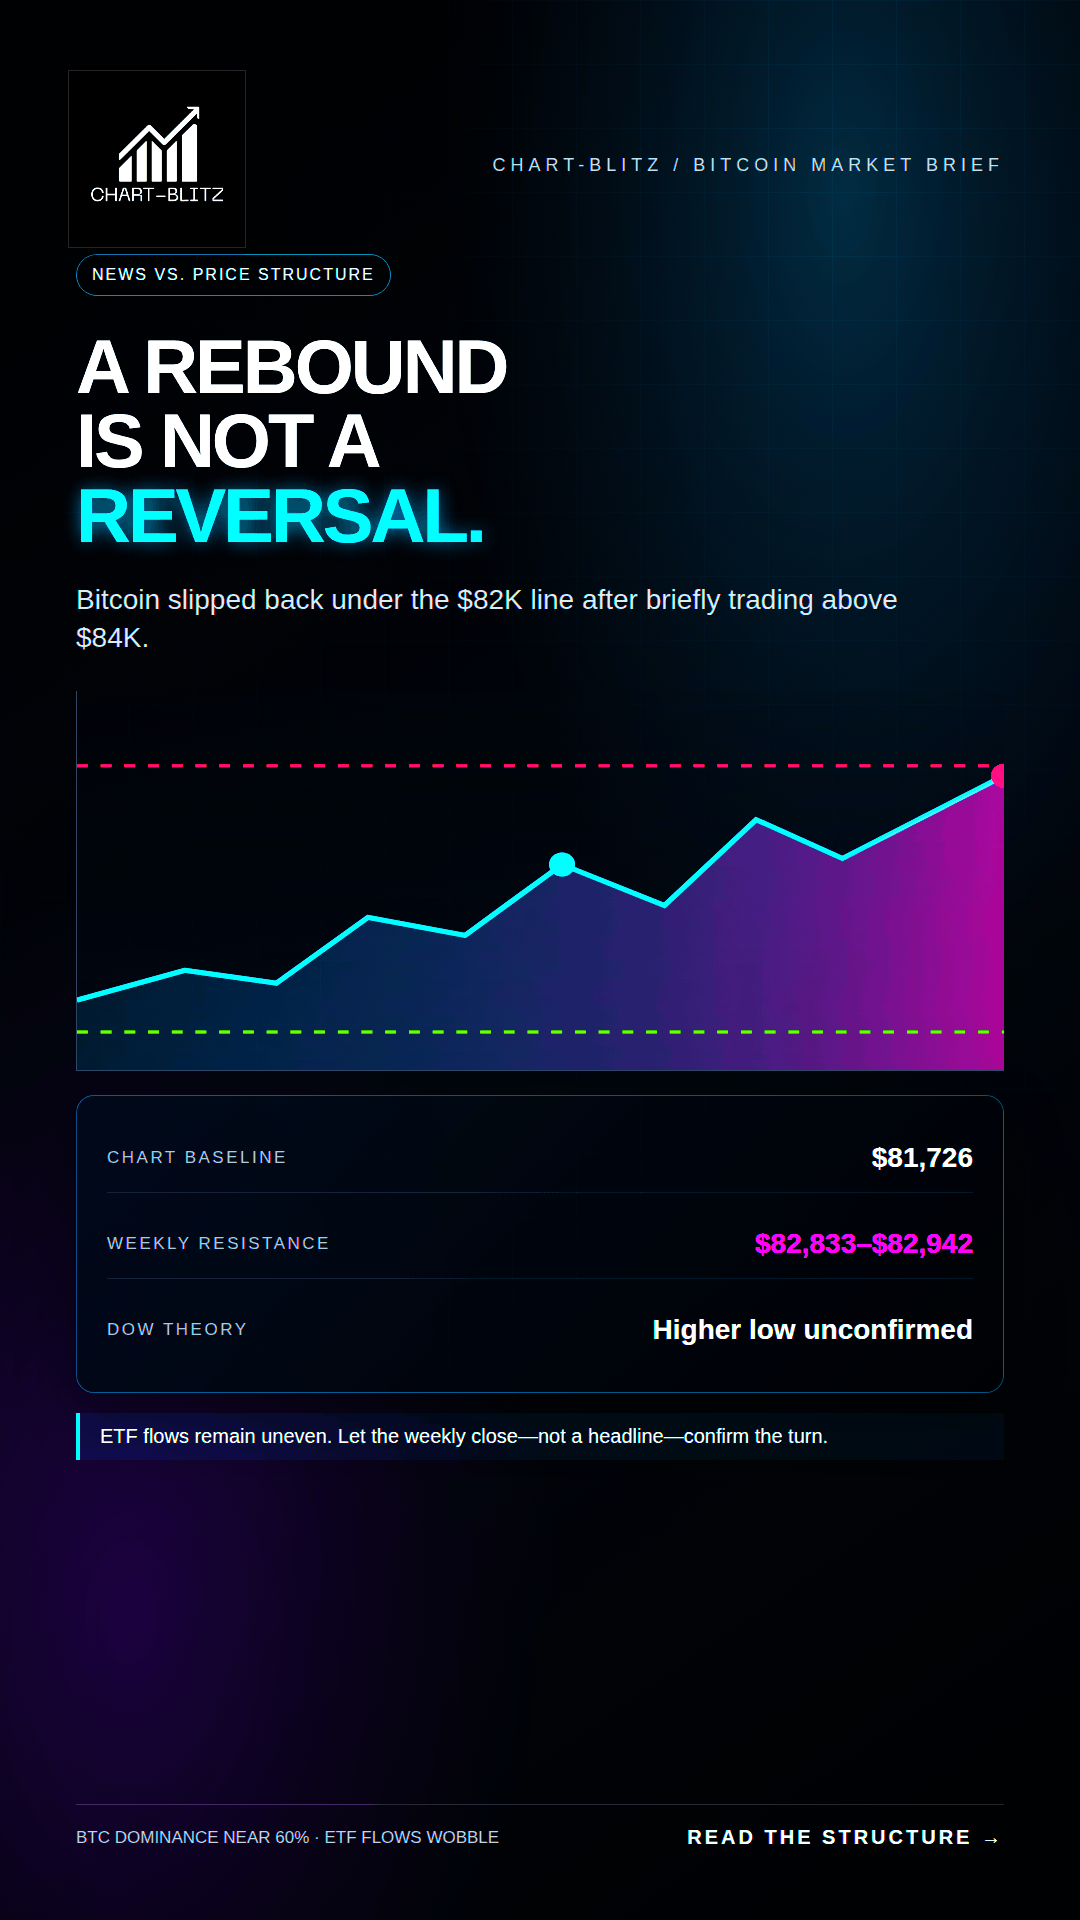
ETF demand is uneven, BTC dominance is elevated, and price is pressing against a decision area rather than clearing it. The weekly close—not a bullish headline—must decide whether $82,833–$82,942 becomes support or another failed rally.
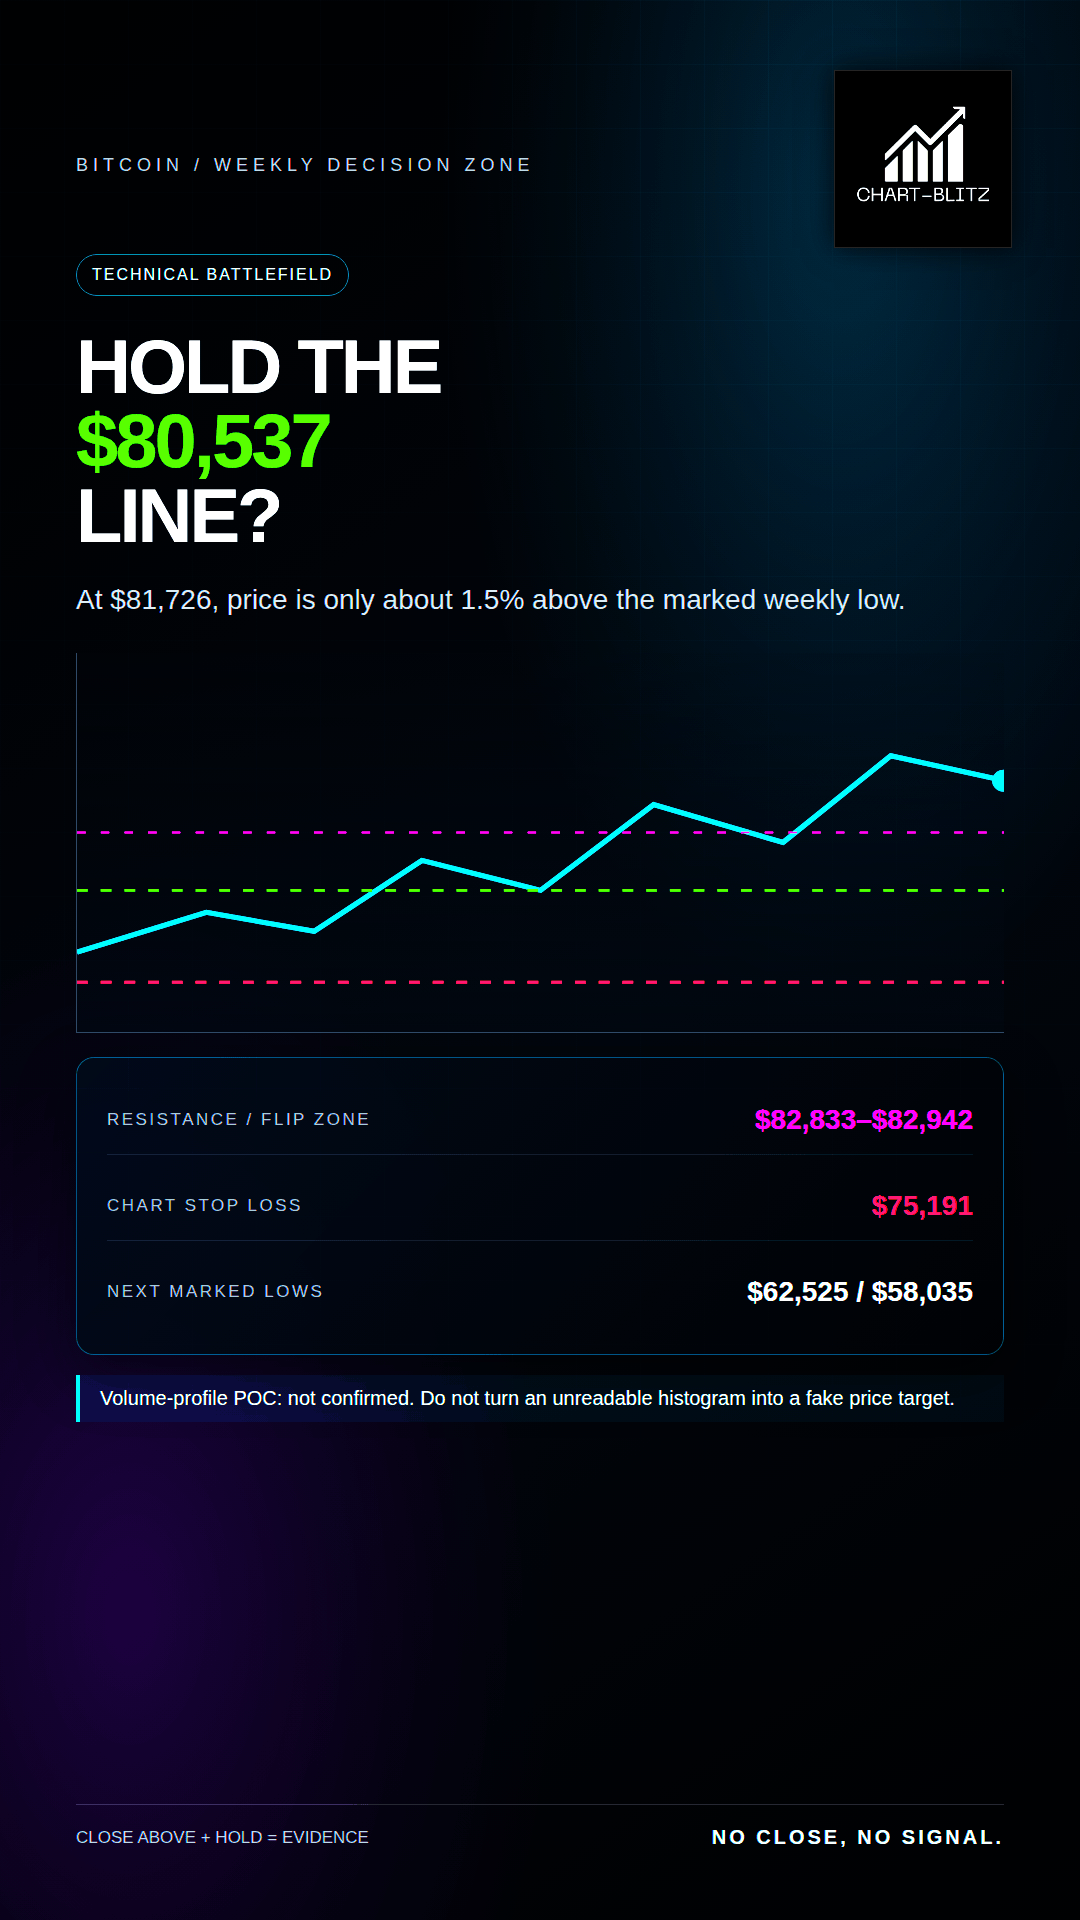
Bitcoin is trading around $81,726, close to the marked weekly low at $80,537 and just below the $82,833–$82,942 decision zone. That is not a clean bull-market signal. It is a test. Can buyers turn the overhead area into support after a close, and can they defend it on a retest? Until that answer is visible, “price bounced” and “trend reversed” remain two different statements.
In a bank trading room, the first discipline is to separate movement from structure. A sharp move in one direction is an event; a trend is a sequence that survives tests. A rally can be real and still fail to reverse the larger trend. The expensive mistake is paying a premium for a story before the market has confirmed the price structure. A green candle is not a signed reversal certificate. If a trader enters only because the move looks urgent, the trader may become the liquidity that an earlier position needs to exit.
【📊Analysis Baseline Statement】
All technical analyses below are based on the price snapshot locked on October 23, 2026 (EST): 02:30 Bitcoin (BTC) = $81,1726 USD. Please treat this report is an analytical map, not a live executable quote. Fragmented crypto venues can differ by a few dollars; every decision must be checked against the same venue and a completed candle before action is considered.
💡Four frames. One question: did it hold?
The Price and Timestamp above are the print this piece froze at the close of writing — not the tape now. Markets move; the copy does not. The only check that matters is whether that freeze still holds. Open Chart Grid: One name, Four frames, locked Weekly → Daily → Monthly → 4-Hour, the article’s print against the live chart. You do not pick timeframes, and you should not trust the headline. Hold or break: you decide.
🧭 Headlines Explain Attention, Not Timing
The central question is not whether Bitcoin can rebound. Markets rebound every day. The question is whether fresh demand can take BTC through resistance, keep it there, and raise the next important low. The news provides context for the object being analysed. The chart provides the timing conditions and the way a thesis can be proven or invalidated.
This distinction matters because market commentary routinely turns a catalyst into a conclusion. ETF demand can improve without producing a durable uptrend. A rate decision can change risk appetite without dictating the next daily candle. A move through a level can be a breakout, a stop run, or a failed test. Price behaviour after the headline is more informative than the headline itself.
📰 News Analysis: Bitcoin Dominance Near 60% Is Not the Same as Broad Risk-On Demand
CoinDesk published a market note about 20 hours before this research snapshot. It reported that Bitcoin dominance had reached roughly 60% on Wednesday as traders preferred BTC over altcoins. It also noted that BTC slipped below $82,000 on Thursday after briefly trading above $84,000. The same report described spot ETF flows as inconsistent and said sustained inflows would be needed to confirm a stronger recovery. A Federal Reserve rate decision the following week was another market catalyst to watch.
That combination is more nuanced than a simple “institutions are back” headline. Rising dominance can mean capital is concentrating in the largest and most liquid asset while investors reduce exposure to smaller tokens. It does not automatically mean net new capital is entering crypto. Unsteady ETF demand also means that a few positive sessions should not be mistaken for a durable institutional bid. If the recovery is already secure, why has price been unable to hold above $82,000 after trading above $84,000?
News is not proof that an unseen group deliberately engineered a trap. That claim would exceed the evidence. The more precise risk is behavioural: when traders treat a positive headline as a guarantee, their market orders can supply exit liquidity to participants who bought earlier. The trading desk analogy is a busy order book: the presence of buyers does not reveal whether they are building a new position or providing a convenient counterparty for someone else’s exit. The chart must resolve that question.
🌊Weekly Analysis: The Bounce Is Still Standing on a Conditional Floor
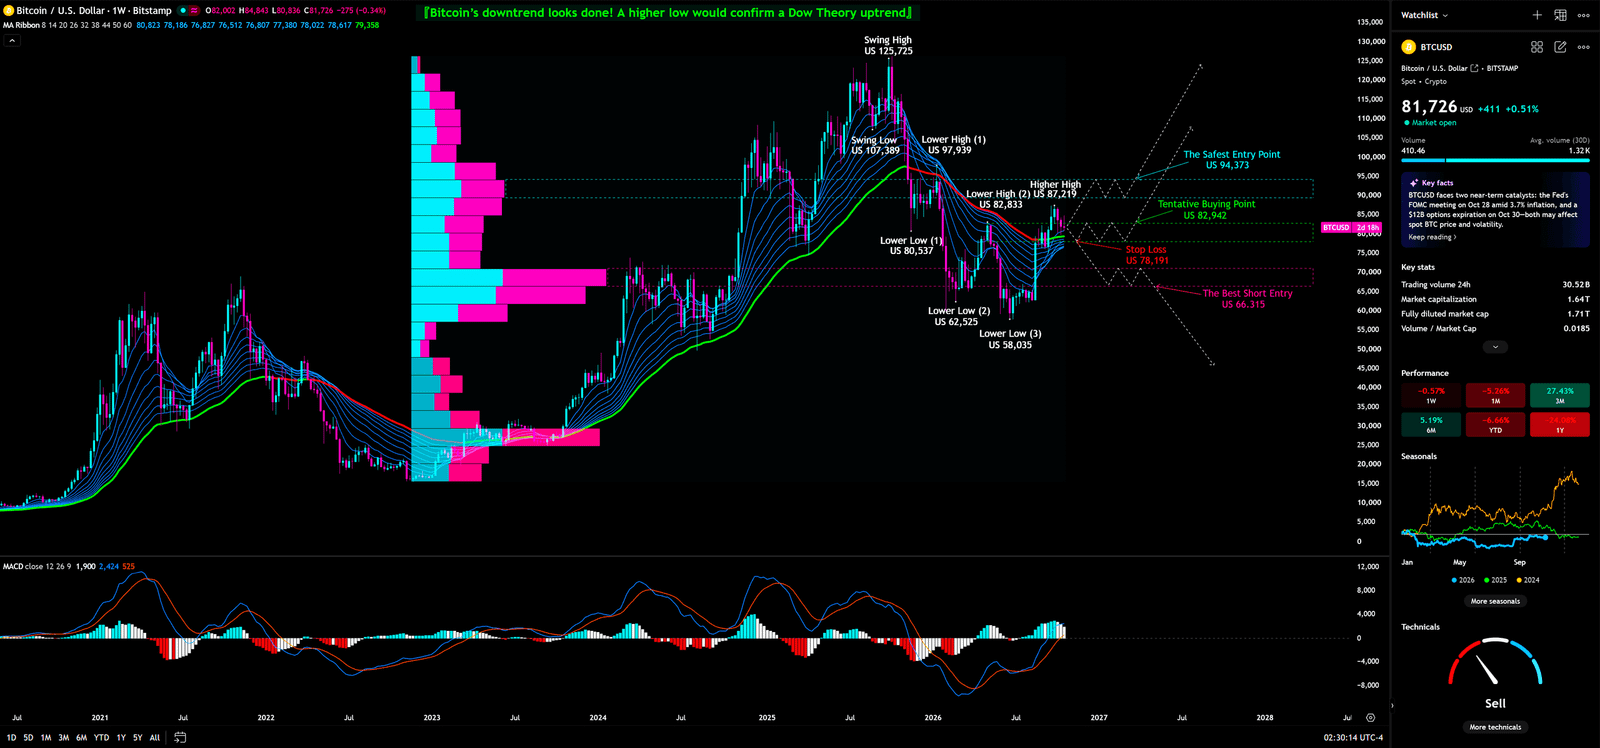
The weekly chart is the controlling timeframe in this analysis. It filters much of the short-term noise and shows whether major swings are rebuilding an uptrend or merely correcting a decline. The visible weekly tools are a moving-average ribbon, a fixed-range volume-profile histogram, and MACD. The chart also contains labelled swing highs and lows, lower-high/lower-low annotations, a tentative buying point, a safest-entry point, a stop-loss marker, and a best-short-entry marker. A note on the chart states that a higher low would confirm a Dow Theory uptrend. That sentence is important: it describes a condition that still needs proof, not a reversal already confirmed.
Weekly Timeframe for BTC (Bitcoin)
The Moving-Average Ribbon: Dynamic Cost Pressure, Not an Automatic Buy Button
A moving-average ribbon groups several moving averages with different lookback periods. The spread and slope of the lines show whether short- and longer-horizon average costs are rising, falling, compressing, or separating. A trader selects it to see whether price has reclaimed a band of trend costs rather than merely crossed a single line. The advanced reading is to judge the whole ribbon—its direction, spacing, and response to a pullback. One brief close above the band is not enough to establish a new regime.
The weekly structure is still vulnerable. The marked swing sequence includes a high at $125,725, another major swing at $107,389, a lower high at $97,939, and a lower high at $82,833. On the downside, the chart marks $80,537, $62,525, and $58,035 as progressively lower reference lows. These labels put the current $81,726 price close to a decision boundary: the market is near the $80,537 low, while the $82,833–$82,942 area is the first reclaim zone that matters to the current thesis.
Capital behaviour: A move into the ribbon or resistance band can be powered by short covering, but sustained buying must also show up when price revisits the zone. Retail misreading: Calling every upward cross a trend reversal ignores the supply from traders who want to exit near their cost basis. Institutional use: Larger participants can test whether new demand absorbs that supply; a failure at resistance can offer liquidity to reduce risk, while a successful break-and-retest can force short positions to cover. The bullish trigger is a weekly close through the marked decision area followed by a hold. The bearish invalidation of that recovery attempt is a renewed loss of $80,537.
A bank dealer handling a large order does not assume the market will absorb the entire position at the first price shown. Execution is staged, liquidity is measured, and the trader watches whether the next wave of orders confirms the first. That analogy has a limit: a chart cannot identify the actual owner of each order. It does, however, explain why the ribbon should be treated as a changing area of potential supply and demand, not as a magic line.
Volume Profile: The POC Is Not Legible, So No False Vacuum Price Will Be Invented
Volume Profile arranges traded activity by price rather than by time. Its longest horizontal bar is the Point of Control, or POC, for the selected range. Thick areas indicate prices where the market spent more time exchanging inventory; thinner areas may allow price to travel faster if price enters them. Traders use it to ask where genuine two-sided participation occurred, not just where price happened to touch a level.
The weekly screenshot shows the horizontal profile, but an exact POC value is not legible. The boundaries of any low-volume pocket are also not precise enough to assign an exact vacuum-zone range. The POC is therefore not confirmed. That is not an omission to hide; it is a necessary limit on the analysis. The reliable reference points remain the labelled $80,537, $62,525, and $58,035 lows and the chart’s $75,191 stop-loss marker. If $80,537 fails on a decisive close, the next clearly marked weekly references are substantially lower, so risk can expand faster than a casual dip-buyer expects. That is a conditional map, not a forecast that price must fall in a straight line.
Capital behaviour: Dense trading zones tend to attract two-way business; thinner areas can see faster movement because fewer prior trades created visible acceptance. Retail misreading: Treating every short bar as proof of an inevitable collapse turns a probability tool into a prophecy. Institutional use: A participant may adjust execution speed after a confirmed break, but a profile cannot prove the identity or intention of that participant. The trigger is a close below the marked support; a prompt recovery above it would invalidate the breakdown reading.
MACD: Improving Momentum Does Not Yet Confirm the Primary Trend
MACD compares the difference between faster and slower moving averages with a signal line; its histogram shows whether the distance between them is widening or narrowing. On a weekly chart, the useful question is whether momentum is strengthening with price, not whether one colour or crossover should automatically trigger a trade. The visible weekly MACD appears to be improving, but the screenshot does not justify a precise claim about a confirmed divergence or an exact crossover value.
Capital behaviour: A momentum recovery may reflect easing sell pressure, short covering, or a new bid; price structure is needed to distinguish those possibilities. Retail misreading: A small positive shift is often promoted as a “bullish divergence” even when the relevant swing comparison is not confirmed. Institutional use: Trend participants check whether momentum, the ribbon, and a price breakout align across closes. A weekly close over the reclaim area with continued momentum would strengthen the bullish case; a fall back through $80,537 would show that the improvement has not changed the controlling structure.
Dow Theory and the Elliott-Wave Rule: Do Not Add Counts the Chart Does Not Show
Dow Theory classifies an uptrend through a sequence of higher highs and higher lows, and a downtrend through lower highs and lower lows. The marked lower highs and lower lows keep the bearish structural risk alive. The chart’s note says that a higher low would be needed to confirm an uptrend. As of the snapshot, the safer classification is therefore “possible loss of downside momentum, confirmation pending,” not “bull trend restored.” Retail may promote a single rebound as a higher low before the subsequent high confirms it. A larger participant can wait for the sequence and the close rather than paying for that premature certainty.
There is no clearly labelled Elliott Wave count in the chart. No 1–2–3–4–5 impulse or A–B–C correction should be invented. The rule remains useful only as a future validity test: in a valid impulse count, the bottom of wave four must not overlap the top of wave one. If it does, the proposed five-wave impulse is invalid and may instead belong to a larger correction. That rule does not grant permission to label the present decline as a specific wave.
Weekly conclusion: This is a conditional reversal area, not a confirmed bull trend. Theoretically, BTC’s decline may not be over. If price turns up instead of continuing lower, the key test is whether it can break and hold above $82,833–$82,942. A close above the band followed by a successful retest would justify considering a plan. If price instead reaches the pre-planned $75,191 stop, the position thesis must be exited. A chart annotation called “safest” cannot make a price safe for every account or every risk tolerance.
📊Daily Analysis: $83,963 Is a Slope to Clear, Not an Elevator
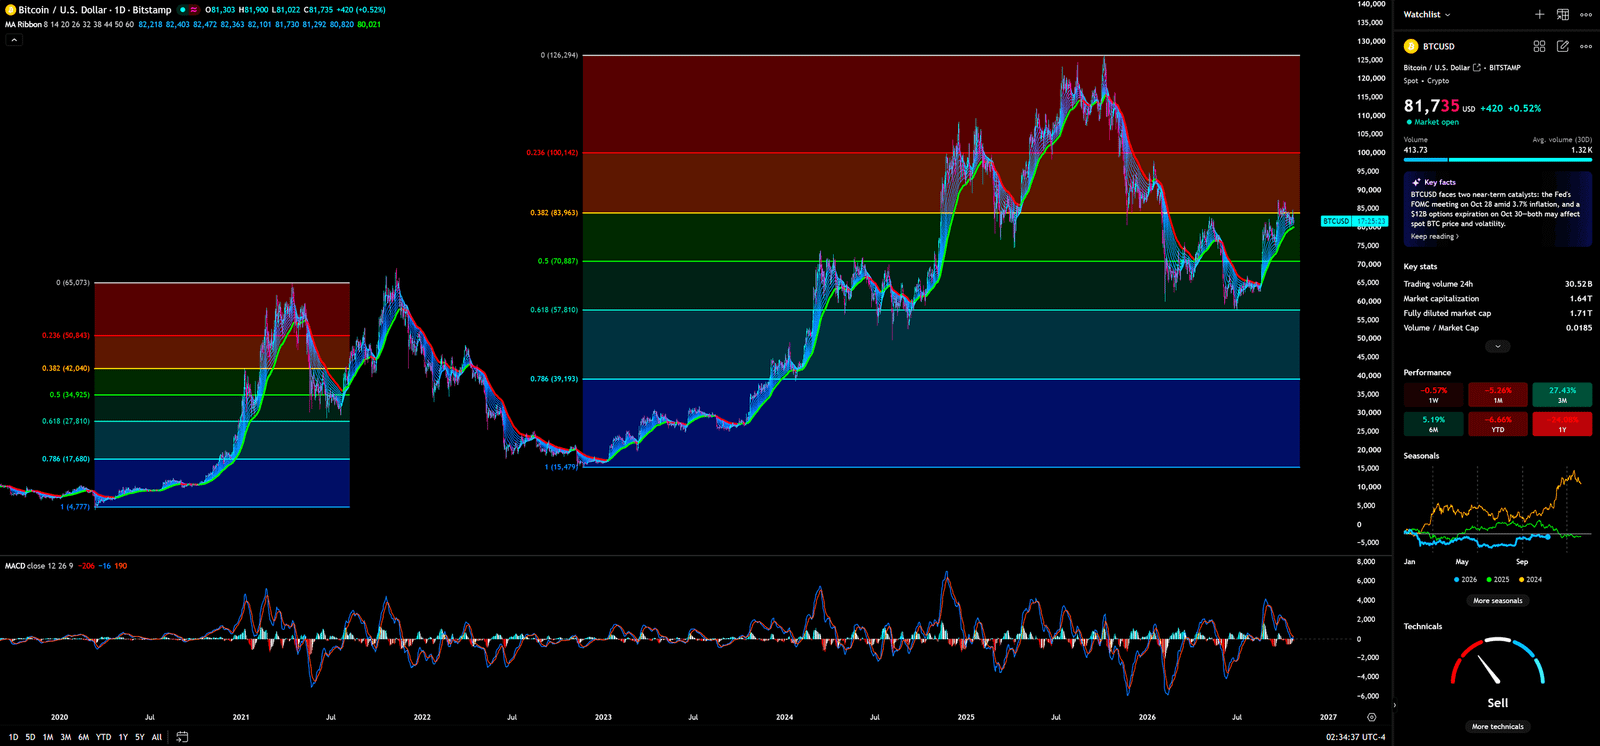
The daily chart tests whether short- and medium-term demand can advance the weekly recovery thesis. Its visible tools are Fibonacci retracement levels, a moving-average ribbon, and MACD. Together they can show where the current rebound sits within the prior swing, whether average costs are being recovered, and whether momentum is following price.
Daily Timeframe for BTC (Bitcoin)
Fibonacci Retracement: Ratios Mark Areas to Test, Not Promises from the Market
A Fibonacci retracement places horizontal ratios across a selected swing high and low. The daily chart marks a high at $126,294 and a low around $15,479. Visible levels are 0.236 at $100,142; 0.382 at $83,963; 0.5 at $70,887; 0.618 at $57,810; and 0.786 at $39,193. Around $81,726, BTC remains below the 0.382 line at $83,963 and above the 0.5 line at $70,887. This places price just under a clear retracement reference; it does not make the area a guaranteed “golden pocket” or automatic support.
Capital behaviour: Traders who bought during the decline may use $83,963 to exit closer to breakeven, while new buyers must demonstrate that they can absorb those offers. Retail misreading: Assuming a Fibonacci line must hold or treating a one-tick breach as a confirmed support-resistance flip. Institutional use: Watching the close, the quality of the retest, and whether the line changes from resistance into support. The bullish trigger is a daily close above $83,963 followed by a successful test from above. The failure condition is a move back below the level and deterioration toward $70,887. Any additional user-drawn price levels take precedence over generic textbook ratios.
Daily Moving-Average Ribbon: A Short-Term Reclaim Cannot Change the Weekly Gear by Itself
The daily ribbon displays average costs across several shorter periods. It responds more quickly than the weekly ribbon, so it is useful for testing whether the latest rebound is getting accepted above near-term trend costs. The chart shows price rebounding into the ribbon area, with the $83,963 retracement level and the weekly $82,833–$82,942 reclaim band still close overhead. A better daily appearance is evidence that pressure may be easing; it is not proof that the higher-timeframe regime has flipped.
Capital behaviour: Short-term traders may cover shorts, while holders trapped above may sell if price approaches their entry price. Retail misreading: Treating a daily ribbon cross as a full-cycle trend reversal. Institutional use: Checking if a pullback holds the ribbon and whether that hold coincides with a close above the higher-timeframe resistance. The bullish trigger is sustained acceptance above the ribbon and the nearby reclaim zone. The failure condition is a loss of the ribbon followed by a close back below $80,537. If the daily and weekly signals disagree, the rational response is smaller risk, not more leverage.
Daily MACD: A Momentum Burst Can Be a Firework
MACD on the daily timeframe compares moving-average momentum and highlights whether it is expanding or contracting. Its advanced use is to compare the breakout candle with the following sessions: do the lines and histogram expand in the direction of price, or does the move fade? The indicator is visible, but its latest exact values and crossover are not reliably readable. This analysis therefore does not claim a confirmed daily golden cross, death cross, or divergence.
Capital behaviour: If buyers are real, momentum should persist after the first push. Retail misreading: Naming any rebound in momentum a new trend, even while price remains below resistance. Institutional use: Waiting for follow-through and a retest rather than buying the first spike. The trigger remains a daily close through $83,963 and a hold; a wick above followed by a close beneath is an unconfirmed test. Daily conclusion: Buyers have earned a chance to test resistance. They have not yet earned the certificate that resistance has become support.
🌙Monthly Analysis: A Rebound from the Lows Does Not Automatically Reprice the Long Cycle
The monthly timeframe compresses short-term noise and shows the longer volatility and momentum setting. The chart displays Bollinger Bands and KDJ. Bollinger Bands help assess volatility and price relative to a moving average; KDJ tracks where the close sits in its recent range, with a fast J line that reacts more quickly than K and D. The chart does not show exact band prices clearly enough to quote them.
Monthly Timeframe for BTC (Bitcoin)
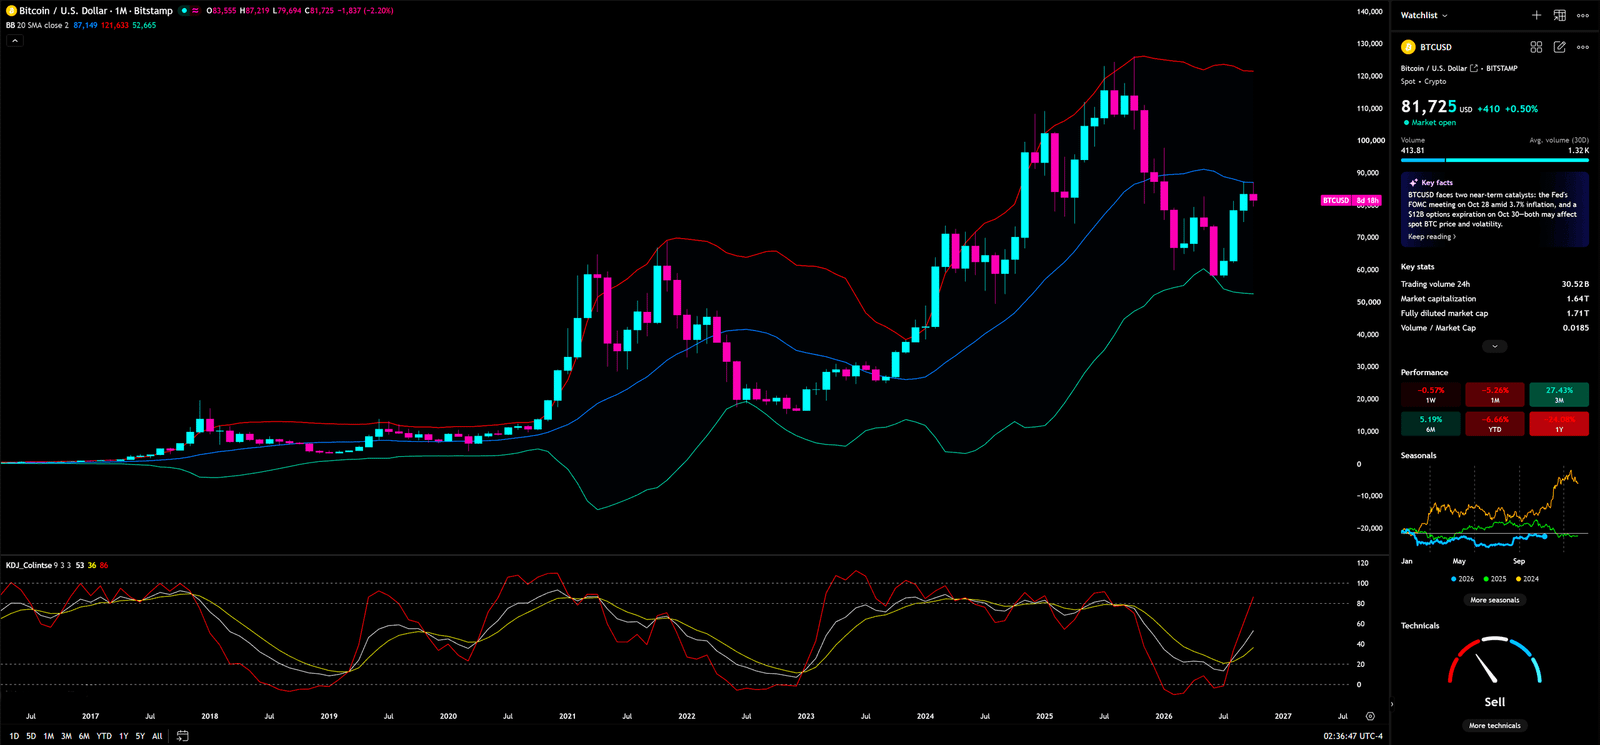
Bollinger Bands: Price Below the Middle Band Means the Long-Term Gate Is Not Reclaimed
Bollinger Bands consist of a moving-average middle line and outer bands that adjust to volatility. Widening bands indicate rising volatility; contracting bands indicate compression. A stronger reading considers band slope, width, and whether price can hold near one side of the band across multiple closes. A touch of the upper band is not an automatic short, and a touch of the lower band is not an automatic bargain.
Price is below the visible middle band and above the lower band. This means the longer-term middle reference has not been reclaimed, but it is not enough to declare a monthly collapse. Capital behaviour: Long-term allocators may remain cautious below the middle band; expansion in the bands will reveal more about direction only after price confirms it. Retail misreading: Calling a lower-band approach “cheap” or treating the middle band as a guaranteed magnet. Institutional use: Managing exposure against volatility and waiting for a monthly close that changes the position of the mean. The bullish trigger is a monthly close back above the middle band with evidence of persistence. The failure condition is renewed weakness toward the lower band while the weekly swing structure also breaks down.
KDJ: The Fast Line Can Warn Early and Mislead Early
KDJ is a stochastic-style momentum oscillator that adds a J line to the K and D lines. J is deliberately more sensitive, so it can turn before the slower lines but also generates more noise. It is useful on the monthly chart for judging whether momentum is recovering from a low area, but it cannot by itself confirm a change in the long-term price trend.
The visible J line has rebounded sharply toward or above the upper-80 region, while the slower lines lag. This is a meaningful momentum change, but it also warns against chasing a fast line after a large move. Capital behaviour: A rising J line indicates that recent closes are moving toward the upper part of their range; it can reflect reduced selling pressure. Retail misreading: Treating an oversold turn as proof that a durable cycle bottom is in. Institutional use: Waiting to see whether K and D follow, and whether price itself recovers the Bollinger middle band. The trigger is slower-line confirmation alongside a stronger monthly close. The failure condition is a quick rollover in J while price remains below the middle band. Monthly conclusion: The longer cycle offers a reason not to be reflexively bearish, but it does not grant permission to chase.
📐4-Hour Analysis: The Lower Edge of the Rising Fan Is the Short-Term Test
The four-hour chart is an execution timeframe. It can help place a trade after the weekly thesis is defined, but it should not overrule that thesis. The visible tools are Gann Fan angle lines and a rising trend/channel framework, with circled tests along the structure. No four-hour oscillator is shown, so no KDJ or MACD signal is attributed to this chart.
4-Hour Timeframe for BTC (Bitcoin)
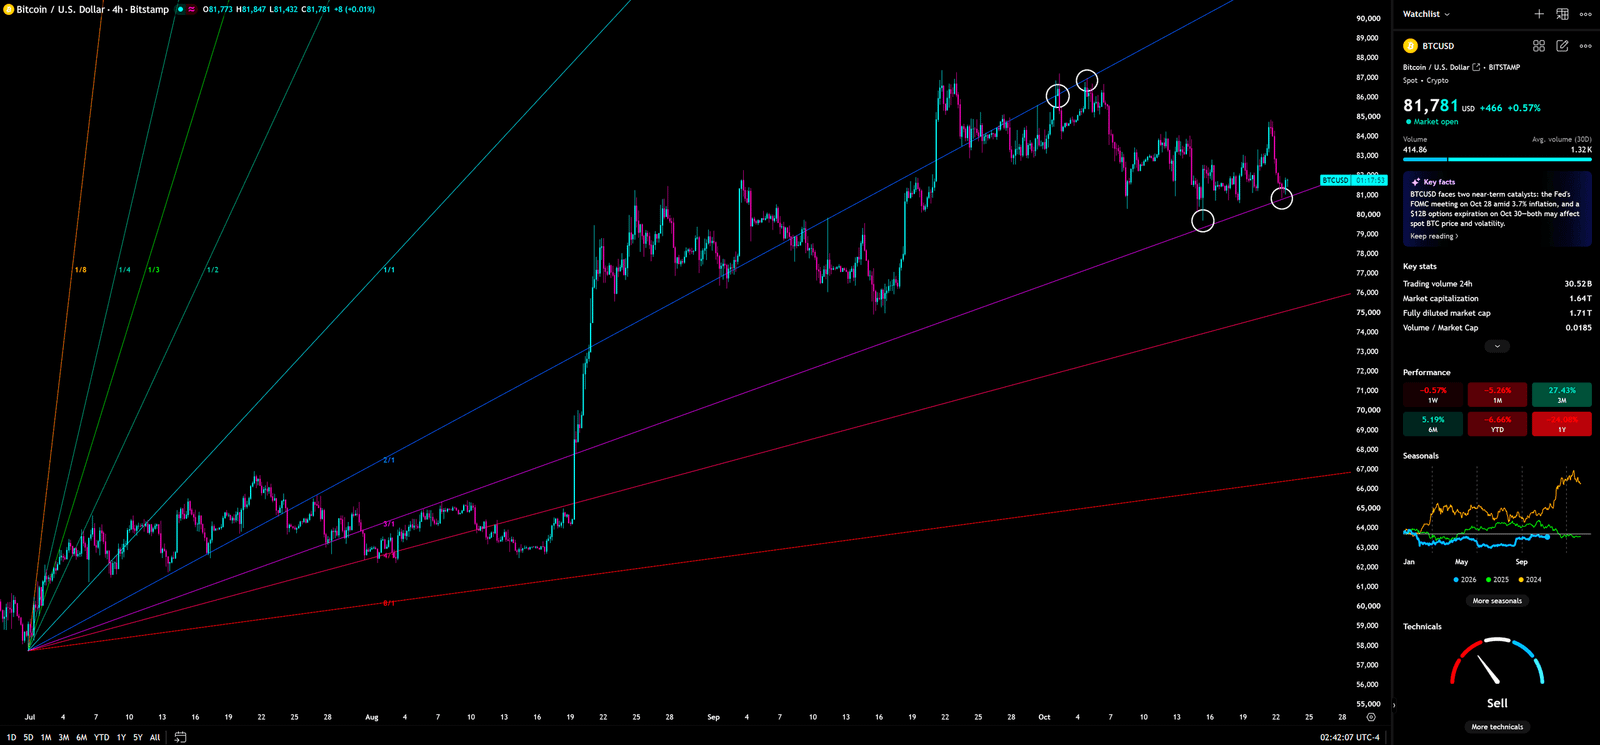
Gann Fan and Rising Channel: Angles Are Dynamic References, Not Fixed Walls
A Gann Fan projects several angle lines from an important pivot to compare price movement with time. A careful reading depends on the selected anchor and on the chart’s price-to-time scale; an angle drawn with a different scale cannot be treated as an identical geometric signal. The chart’s rising lines and channel show repeated tests of an ascending lower boundary. At roughly $81,700–$81,800, price is near that lower boundary, while the upper-side resistance sits in the mid-to-high $80,000s and will move with time.
Capital behaviour: Holding the lower edge may invite short-term buying; a confirmed loss can trigger stops and leveraged de-risking. Retail misreading: Assuming a drawn line must produce a bounce, or calling every brief breach a false break without waiting for a close. Institutional use: Watching the close and retest to distinguish a stop sweep from a structural break. The bullish trigger is a hold of the rising lower boundary followed by a break above the latest local swing high. The invalidation is a sustained four-hour close below that boundary with a failed recovery.
The four-hour path can change quickly, but it does not rewrite the weekly swing sequence on its own. One trading-room discipline is to let the low timeframe manage execution and the higher timeframe define the environment. When the two disagree, reduce position size before trying to prove which one is right. A test of the upper channel can create short covering and fresh chase orders; only a close and retest can help distinguish a genuine break from a brief liquidity sweep.
🎭 Retail vs. Institutions: One Sees a Missed Rally, the Other Starts with the Stop
A retail trader may read ETF headlines, Bitcoin dominance, or a central-bank story and then look for the chart to validate a decision already made. A disciplined large participant does not need to know the next candle in advance. The first questions are more practical: where is price relative to the relevant structure, what level proves the thesis wrong, and can the market hold beyond that level after the close?
A large bank order is not normally treated as a single button press at the first quote. The desk studies available depth, stages execution, and estimates the price impact of its own order. Chasing the market with a full-size market order during a thin or emotional move is like choosing the widest spread and then complaining about the fee. The analogy is about execution cost, not about proving that any specific institution caused this chart pattern. Another useful analogy is the risk line: a stop is the control room’s red boundary, not a wish that the market will reverse before it arrives.
If a positive headline appears and BTC still cannot close above $82,942, the measured response is to log a failed test and wait. If price closes above the zone and holds a retest, a bearish thesis also needs to be updated. “Whales did it” is not a substitute for observing who gained control of the close. Are you buying confirmation, or buying a headline that makes the trade feel safer than it is?
🔮 Three Scenarios: Every Path Needs a Trigger, a Target, and an Invalidation
Scenario 1 — Bullish: Resistance Flips to Support, Then $87,219 Comes into View
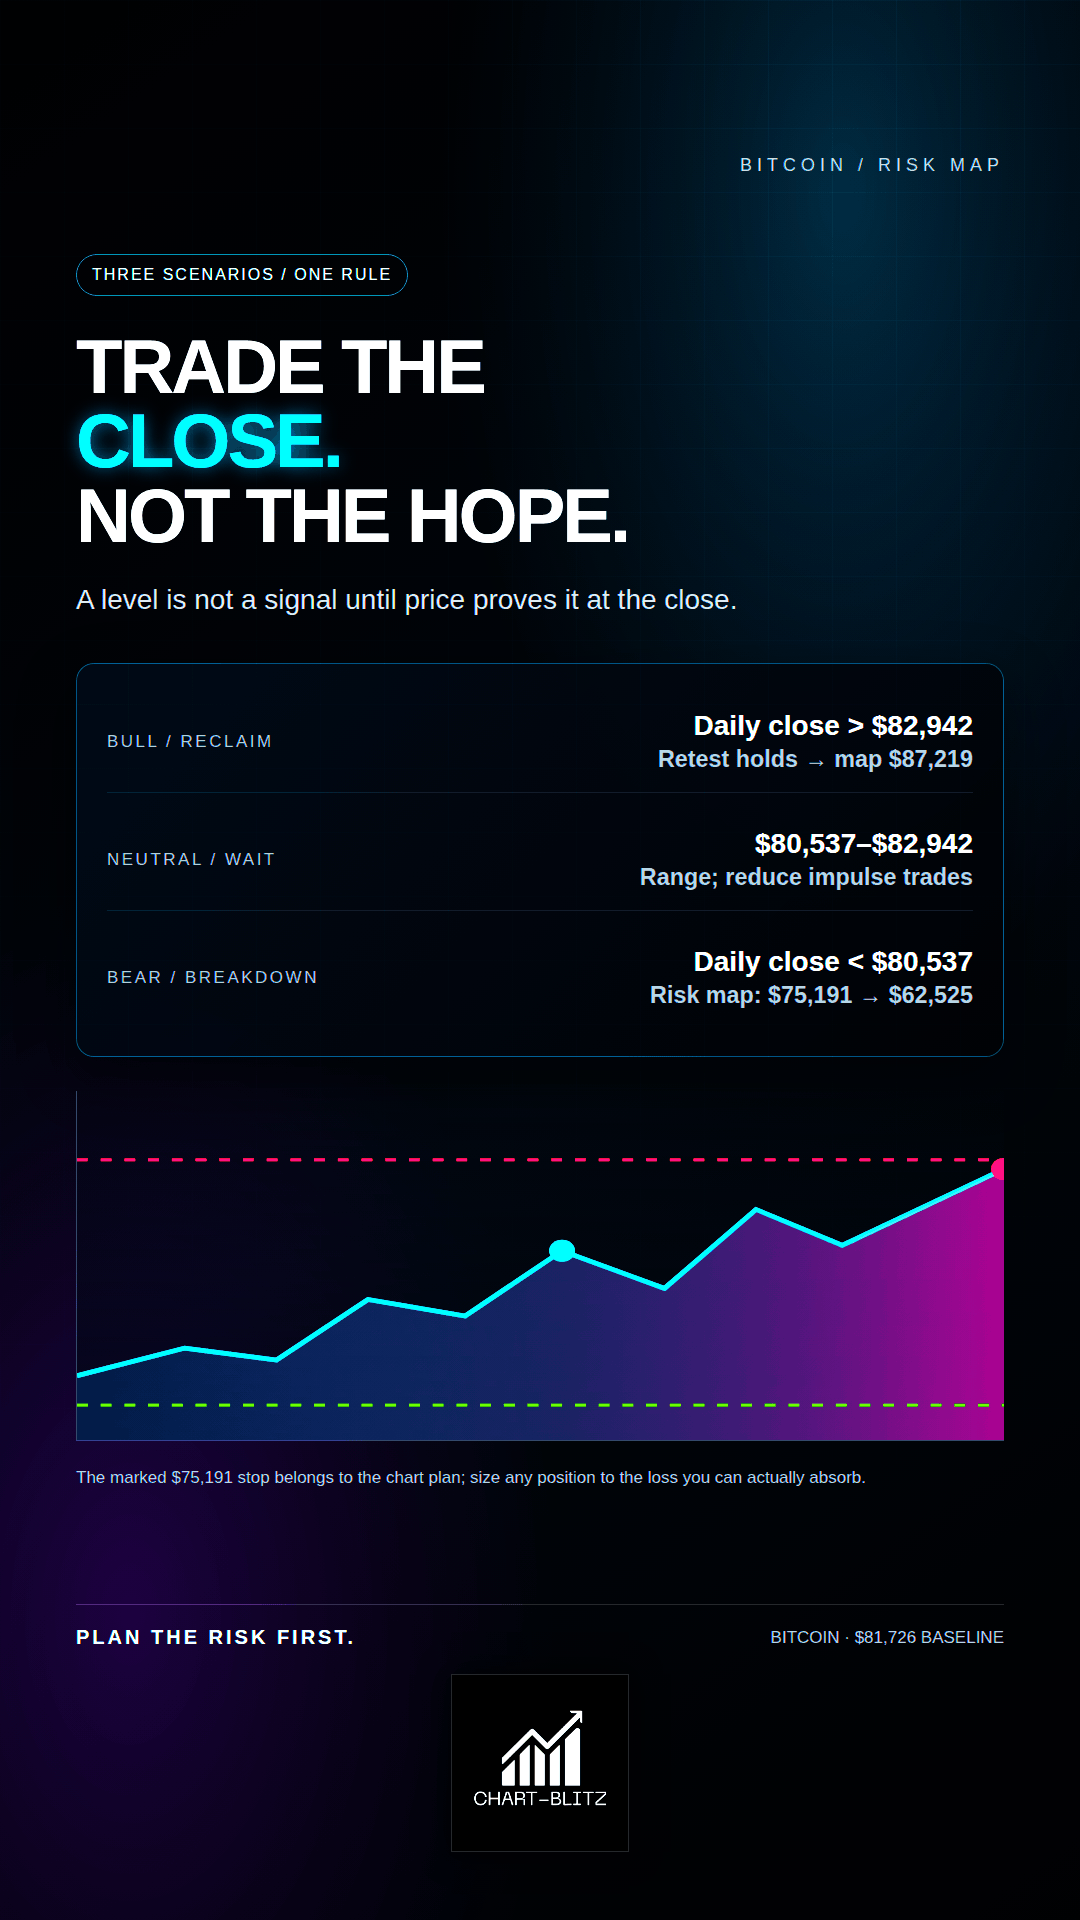
Trigger: BTC closes above $82,942 on the daily chart and then retests the $82,833–$82,942 band without closing back below it. A weekly ribbon that flattens and continued momentum improvement would add confirmation. The chart’s $87,219 marker is the next area to inspect for supply. Above it, $94,373 is labelled “The Safest Entry Point” and $97,939 is a prior marked swing-high area. These are conditional reference points, not promised destinations.
Capital reading: A successful retest suggests demand is doing more than lifting price through short covering. Retail often buys the first breakout candle; a larger participant can wait for the test from above. Invalidation: A close back under $82,833 after the attempted flip weakens the bullish case. A subsequent close below $80,537 invalidates the immediate recovery thesis. A position should be managed by its pre-defined risk plan, not by a hope of returning to breakeven.
Scenario 2 — Bearish: A Close Below $80,537 Puts $75,191 Back on the Risk Map
Trigger: Price closes below $80,537 on the daily chart or higher, fails to recover it on a retest, and the four-hour rising boundary also breaks. The first marked risk reference is $75,191, followed by the daily 0.5 retracement at $70,887. The chart also labels $66,315 as “The Best Short Entry,” then marks weekly lows at $62,525 and $58,035. The $66,315 label is a candidate short-entry reference, not proof that price must fall there.
Capital reading: A confirmed close below support can activate stops and reduce leveraged exposure. Retail may dismiss the first break as a fakeout and stay in a trade with no risk limit; larger participants often wait for a failed reclaim rather than shorting the bottom of an impulsive candle. Invalidation: A rapid recovery above $80,537, followed by acceptance above $82,942, would weaken the breakdown thesis. Any short position needs its own planned cover level.
Scenario 3 — Neutral: Price Remains Between $80,537 and $82,942
Trigger: BTC cannot close decisively above $82,942 or below $80,537, while four-hour price continues to oscillate around its rising channel. The signal is not a failure to predict; the market is still undecided. ETF flow consistency and the coming Federal Reserve decision can be watched through their effect on price rather than traded as a pre-announced outcome.
Capital reading: Neither side has secured sustained control of the range. Retail may buy the top and sell the bottom repeatedly, paying spread and stops for the privilege. A disciplined desk can reduce directional exposure and wait for the range to resolve. Invalidation: A decisive close outside the range followed by a successful retest. A wick beyond either edge without follow-through remains an unconfirmed liquidity test.
📝 Trading Plan and Conditions: Chart Labels Are a Risk Map, Not an Order Ticket
Current posture: observation first. At the locked $81,726 baseline, BTC sits between $80,537 and $82,942, so the cleanest breakout condition has not been met. The weekly chart explicitly marks “The Safest Entry Point” at $94,373, “Tentative Buying Point” at $82,942, “Stop Loss” at $75,191, and “The Best Short Entry” at $66,315. These labels are part of the chart plan; they are not automatically suitable recommendations for every account.
| Bias | Entry condition | Risk invalidation | Areas to monitor | Execution rule |
| Bullish | Daily close above $82,942, then a hold of the retest; weekly structure must begin to confirm a higher low | The chart’s hard risk marker is $75,191; a loss of $80,537 requires immediate reassessment | $87,219 → $94,373 marked entry area → $97,939; reassess at each zone | Do not chase the first expansion candle; size from the loss you can afford |
| Bearish | Daily close below $80,537, failed reclaim, and loss of the four-hour rising boundary | Recovery above $82,942 weakens the breakdown thesis; use a pre-defined stop | $75,191 → $70,887 → $66,315 marker, then $62,525 / $58,035 | $66,315 is a conditional chart label, not an immediate short at the current price |
| Neutral | Price remains between $80,537 and $82,942 | Do not increase leverage because the range feels boring | Wait for a close outside the range and a retest | Alerts are better than reacting to every candle |
An entry near $82,942 with a hard stop at $75,191 involves meaningful distance between entry and invalidation. Position size must be calculated backward from the maximum acceptable loss. “Safest” is a chart label, not a universal guarantee, and $94,373 has not been reached at the locked baseline. If price later moves through it, the risk/reward must be recalculated instead of copying a stale plan. The short-side marker at $66,315 is also far below the current price; it is not a reason to short immediately.
The full S/R Flip rule: Theoretically, BTC’s decline may not be over. If BTC stops falling and turns sharply higher, first test whether price can break and hold above $82,833–$82,942. Enter only after a close confirms the break and a retest holds according to the plan. If price instead reaches the pre-defined stop, exit rather than negotiating with the chart. Decide the maximum cash risk, stop, and cancellation condition before entry; never move a stop farther away simply to avoid admitting that the thesis failed.
✅Conclusion and Recommendation: Bitcoin Has a Bounce; It Has Not Yet Delivered Proof of Reversal
The weekly chart remains the judge. $80,537 is the nearby structural floor, while $82,833–$82,942 is the first resistance band that must be reclaimed and held. On the daily chart, $83,963 remains a visible retracement barrier. Monthly KDJ has rebounded sharply, but price has not reclaimed the Bollinger middle band. The four-hour rising lower edge gives a short-term reference, but it cannot replace higher-timeframe confirmation. These readings do not all point in one direction, so the honest conclusion is to wait for the close rather than predict the outcome that sounds most exciting.
News provides the object of analysis; technical structure defines timing and conditions. For bulls to take control, BTC needs closes above resistance, a successful retest, and a rising sequence of lows. For bears to retain control, price needs to lose $80,537 and fail to reclaim it. The zone between those tests does not owe either camp an answer. The main objective is not to guess the next candle; it is to make sure a wrong guess cannot destroy the account.
I will continue to closely monitor the price action of this Crypto. As soon as a critical reversal signal appears on the charts, I will update my analysis and insights right here immediately. Remember to Bookmark this page and come back often to check for the latest updates!
Want to see our full, interactive chart breakdown? If you want to learn how to draw weekly VPFR, Fibonacci, EMA Ribbon, MACD, Supertrend, and S/R Flip frameworks designed for real trading decisions. Please browse the following『Further Reading』links. Fundamental news tells you what happened. Technical analysis predicts what will happen. To master the professional framework that separates market signal from noise, explore our exclusive models at https://www.chart-blitz.com/fxcx-app/omni-chart.html?symbol=BTC.
📚Further Reading:
To help everyone gain a deeper understanding of the various technical indicators mentioned in this article, we have specially prepared the following further reading materials. These cover key analytical tools found across the weekly, daily, monthly, and 4-hour charts.
- Decoding Fibonacci Retracement: The Perfect Blend of Natural Law and Market Psychology — Fibonacci Retracement is not just a set of magical numbers; it is a manifestation of market psychology. Learning how to correctly draw and interpret Fibonacci levels is a required course for every serious trader.
- Is a Major Move Hiding in Plain Sight? Dow Theory May Already Know the Answer — As retail traders continue to chase short-term signals, experienced market readers are looking deeper — into trend structure, volume behavior, and market phases that may expose the early clues of a coming breakout.
- Understanding VPFR: Finding the Hidden Footprints of Market Makers — The Volume Profile Fixed Range (VPFR) is a powerful tool that tells us where the most trading occurred within a specific price range. This helps us identify true support and resistance levels, as well as potential ‘Vacuum Zones’.
- S/R Flip Support and Resistance Swap Strategy — S/R Flip is one of the most powerful concepts in technical analysis. This article uses real cases to teach you how to use S/R Flip to capture the highest win-rate trading opportunities.
- MACD Momentum Indicator Momentum First — What Does the MACD Line Crossing Above Zero Mean? Golden Cross & Divergence Signals!
- Gann Fan Masterclass — Deep dive into W.D. Gann’s angle theory to identify the geometric relationship between time and price in the market.
- Strategies for EMA Ribbon Bearish Alignment: Dead Cat Bounce or Real Reversal — Deep dive into the EMA Ribbon to understand the battle between short-term and long-term capital.
- Bollinger Band: Long-Term Repricing Zone — The Ultimate Tool to Capture Massive Market Moves Tired of getting shaken out of winning trades too early? Or buying right before a trend reverses? An ex-banker reveals how to use the Bollinger Band to filter out market noise and ride the big waves.
- KDJ Stochastic Indicator Bottom Confirmation — What is the implication of a downward-curving KDJ? Understand in one article how to use dynamic indicators to catch market turning points.
【Disclaimer】 The content herein is for educational purposes and reflects the author’s personal opinion only; it is not investment advice. All financial investments, including cryptocurrencies, carry significant risk, and you could lose your entire capital. To support this site, this article may contain affiliate links. While we strive for accuracy, we cannot guarantee all information is complete or error-free. Please conduct your own research and be fully responsible for your own investment decisions.