Fetching Live Market Data...
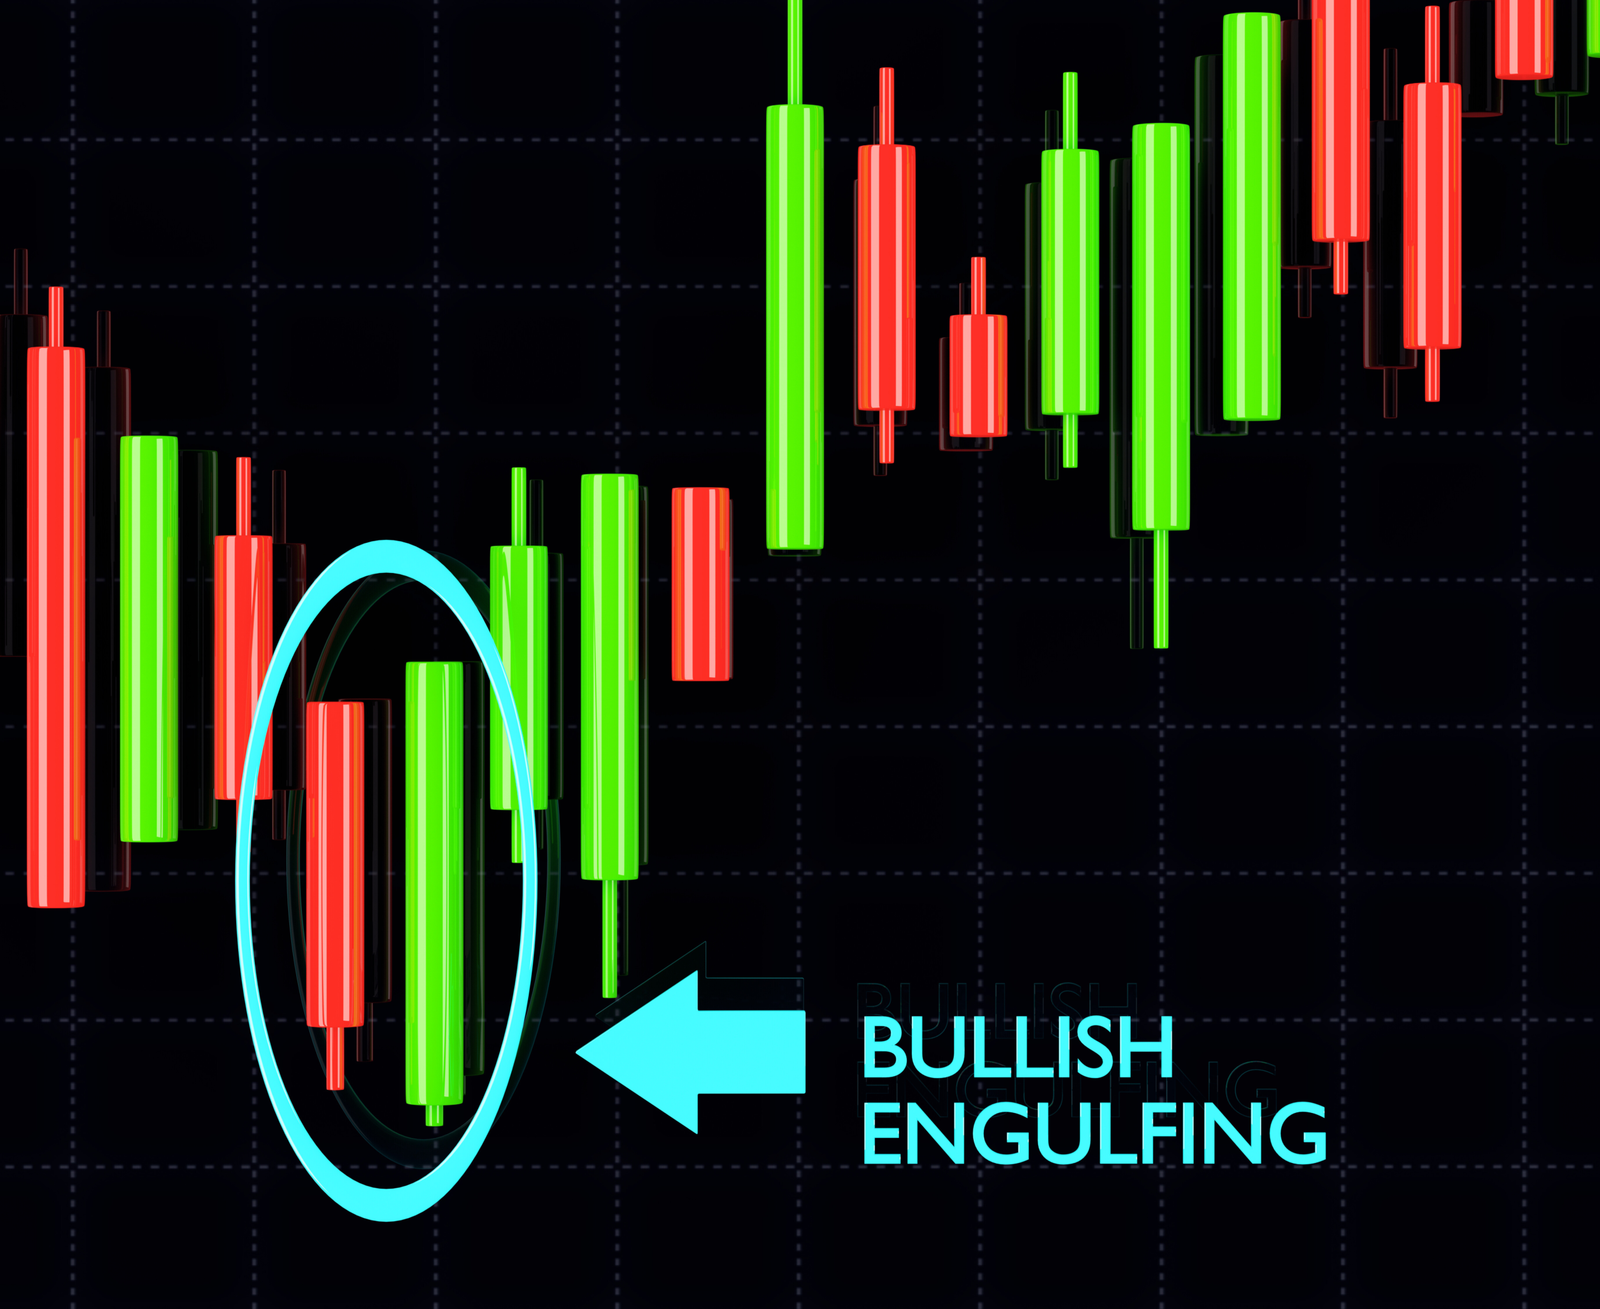
When you make a trade, you should have a clear target of where you expect to get out
William Delbert Gann – 1949
Bitcoin has bounced, but the tape has not granted absolution. The next verdict belongs to completed closes, defended retests, and the discipline to respect a pre-written stop.
That distinction matters. In a dealing room, the screen is not the trade. The close is the receipt. The retest is the audit trail.
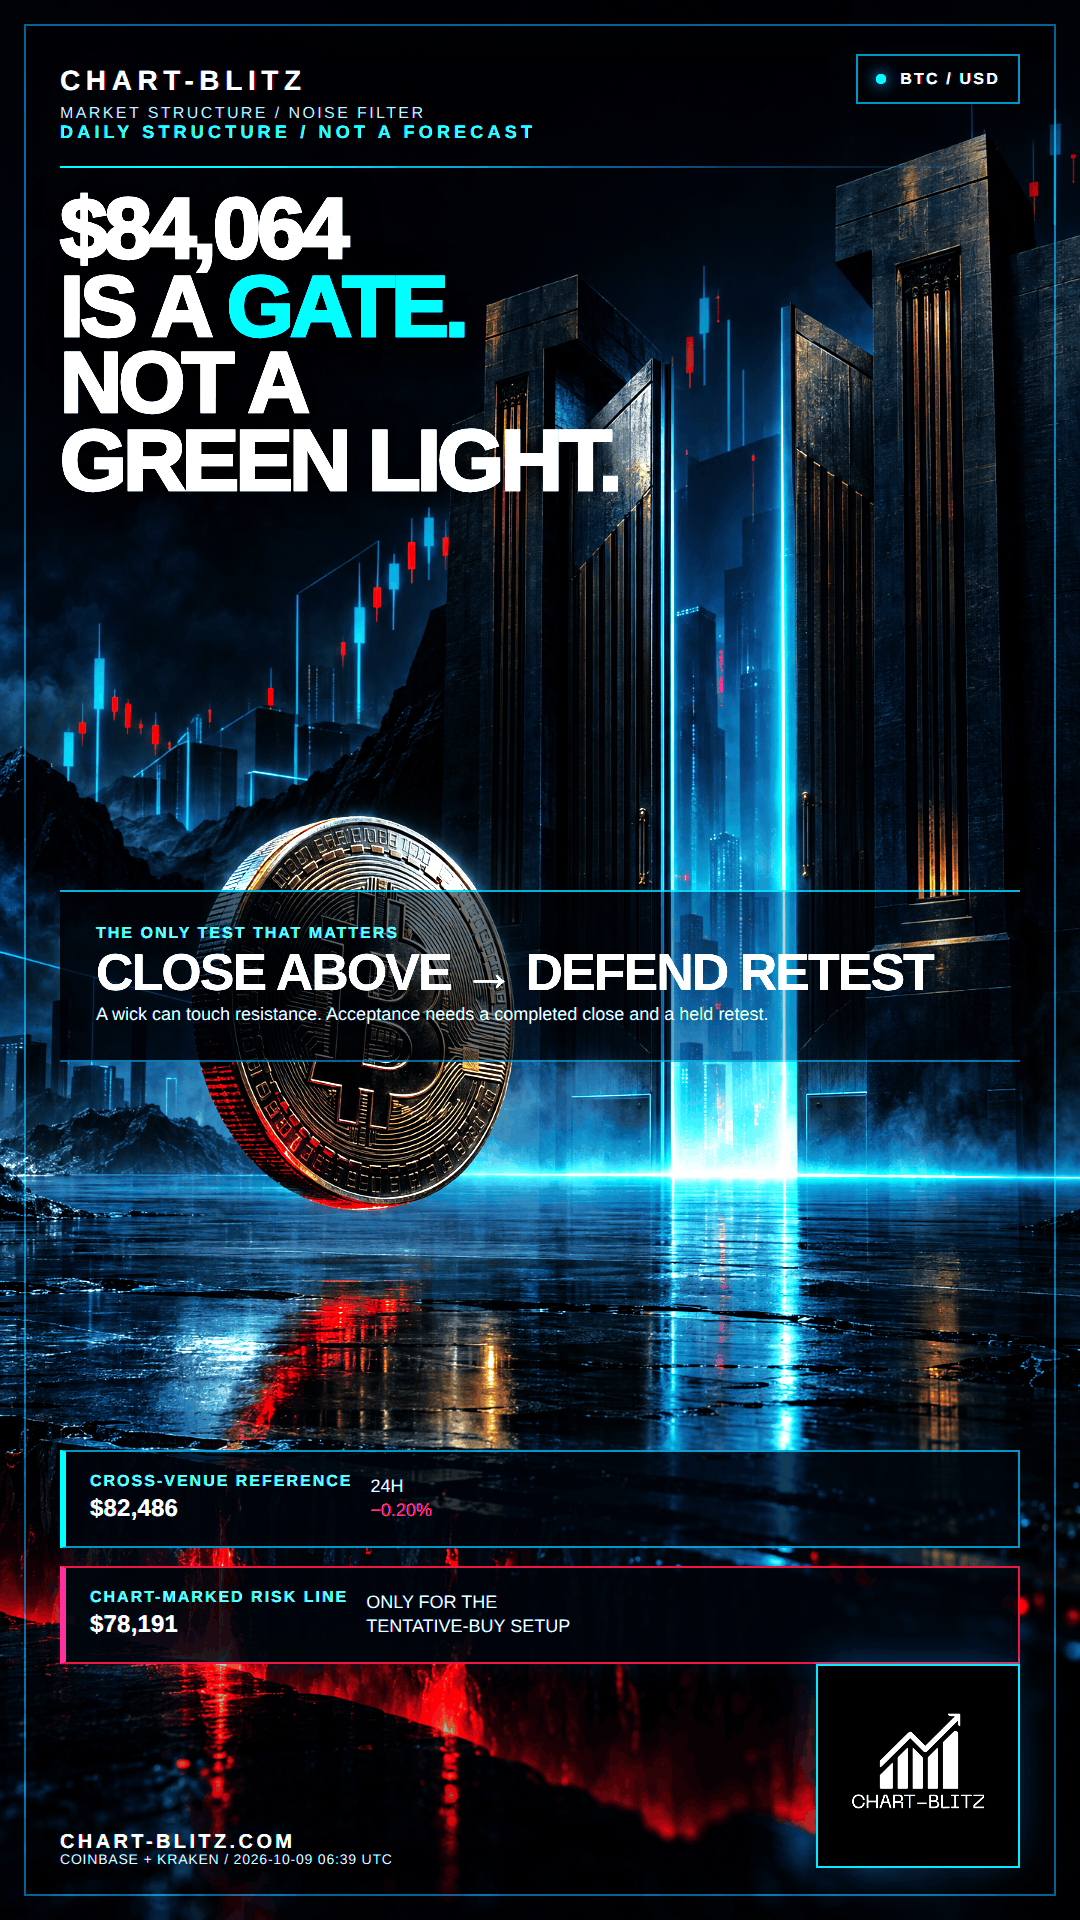
News explains the rush; the close decides whether the rush survives. Right now, the market is parked beneath the daily passport at $84,064 and above the weekly risk ledger’s red line at $78,191. That is not victory. That is probation
【📊Analysis Baseline Statement】
All technical analyses below are based on the price snapshot locked on October 8, 2026 (EST): 01:47 Bitcoin (BTC) = $84,408 USD. Please treat this report is an analytical map, not a live executable quote. Fragmented crypto venues can differ by a few dollars; every decision must be checked against the same venue and a completed candle before action is considered.
🔥Catalyst Deconstruction
The news tape delivered exactly the kind of adrenaline that attracts late hands and punishes loose stops.
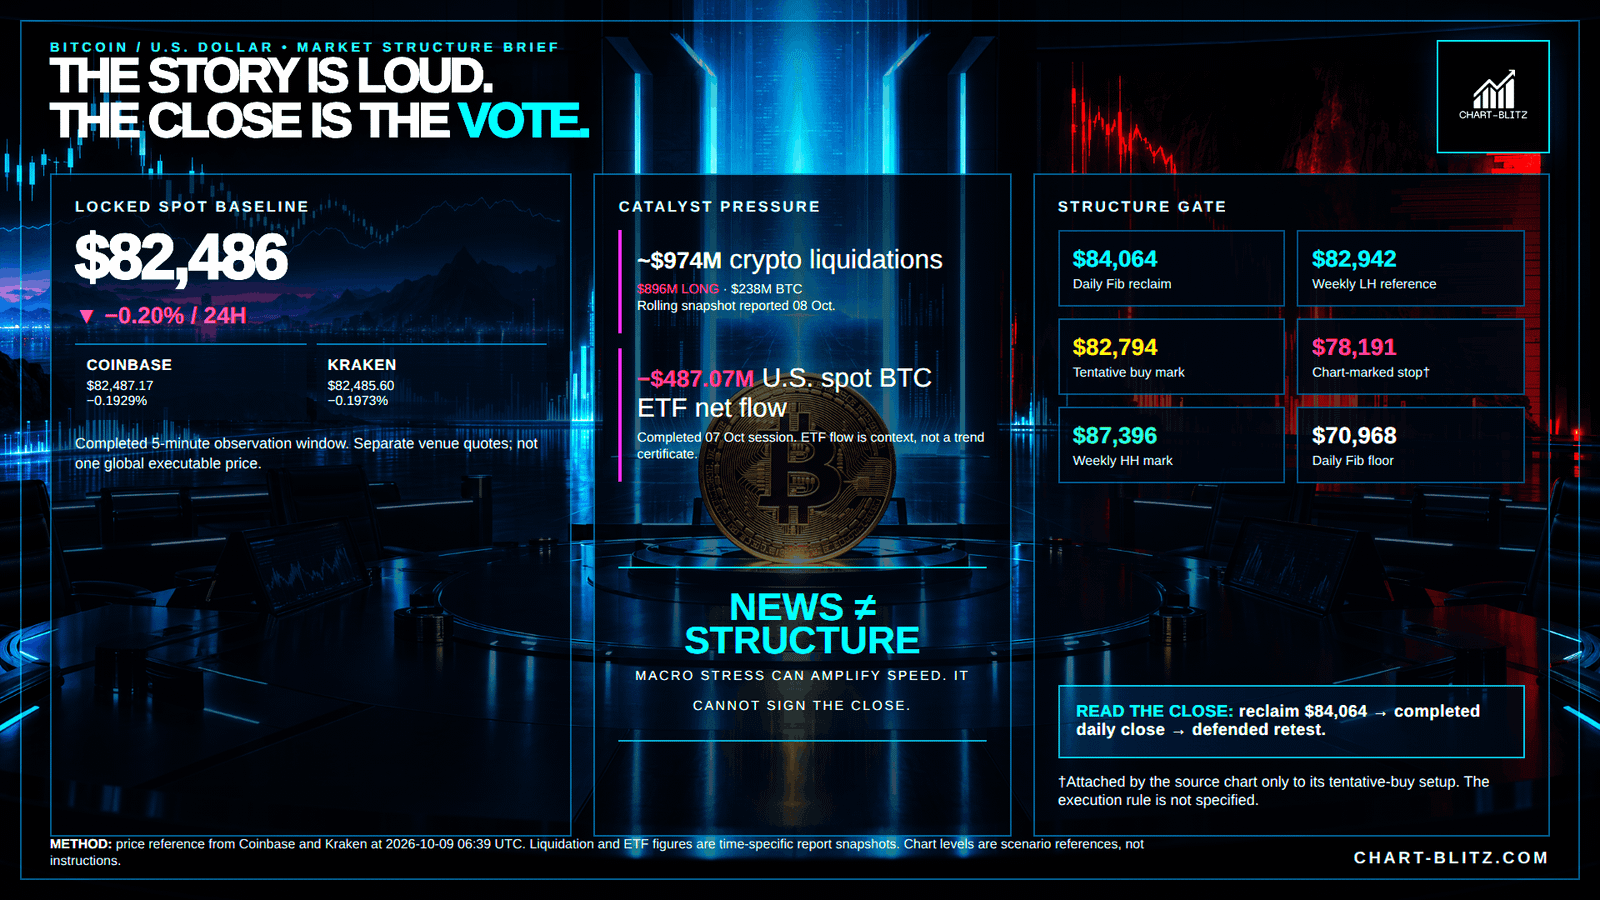
Yahoo Finance reported on Oct. 8, quoting a CoinGlass rolling snapshot, that crypto liquidations were about $974 million, including $896 million in longs and $238 million in BTC. In that report, BTC briefly reached $80,900 and recovered near $81,100 at the report’s time. Stocktwits retail sentiment was labelled bearish at publication time.
That is not the current liquidation total at this lock. It is narrative context only.
SoSoValue and CoinDesk add the ETF pressure layer. U.S. spot BTC ETFs recorded -$487.07 million in daily net flow on Oct. 7. The page later displayed -$238.58 million as of Oct. 8. Those dates must stay separate. CoinDesk described the Oct. 7 outflow as the most since June 25, with BTC around $83K in its article.
Reuters supplied the macro shadow: higher oil, higher yields, and Middle East tensions pressuring broader risk appetite. That is background, not proof of BTC causality.
Bitfinex commentary has also treated $84,000 as a conditional pivot. That sits close to the chart-derived $84,064, but Bitfinex’s on-chain and derivatives measures are not present inside the supplied technical framework. It is a competing market narrative, not chart proof.
Catalysts can explain why traders run. They cannot prove where capital has accepted risk.
The emotional trap is obvious. A trader sees a forced-liquidation headline, watches BTC snap away from the local low, and begins treating pain as proof that the sell-off has finished. That is not analysis. It is relief trying to hire a chart as an alibi. A liquidation report measures damage already done. It does not measure whether demand has accepted inventory at the next resistance shelf.
This is why news is useful and dangerous at the same time. It tells the desk where attention is concentrating; it does not tell the desk whether a level was defended after the attention moved on. A headline can bring a crowd to the door. Only a close and a retest tell whether the room was actually opened.
♟️News Versus Price Structure
A liquidation headline can create speed. An ETF outflow can create mood. A macro shock can create defensive posture. None of those replaces structure.
The chart question is colder:
Can BTC stop falling, break upward into resistance, complete a close above that resistance, and then defend the retest?
That is the clean support/resistance flip. Theoretically, BTC’s decline is not necessarily over. If price stops falling and breaks upward into resistance, the disciplined response is to wait for a completed close above resistance and a defended retest before reassessing. If a pre-written stop condition is reached, the rule is to exit, not widen the rule.
⚠️ The trap is emotional symmetry: because BTC fell hard and bounced, retail assumes the fall is finished. A dealing desk thinks differently. It asks whether sellers lost control, or whether buyers merely rented the tape for a few candles. The daily answer remains $84,064. The weekly risk answer remains $78,191.
💡Four frames. One question: did it hold?
The Price and Timestamp above are the print this piece froze at the close of writing — not the tape now. Markets move; the copy does not. The only check that matters is whether that freeze still holds. Open Chart Grid: One name, Four frames, locked Weekly → Daily → Monthly → 4-Hour, the article’s print against the live chart. You do not pick timeframes, and you should not trust the headline. Hold or break: you decide.
🌊Weekly Structure — Dow Theory First, Emotion Last
Dow Theory studies trend through confirmed sequences of highs and lows. A bullish structure normally needs higher highs and higher lows; a bearish structure shows lower highs and lower lows. It is used because it removes noise and forces price to prove trend by structure, not by excitement.
Weekly Timeframe for BTC (Bitcoin)
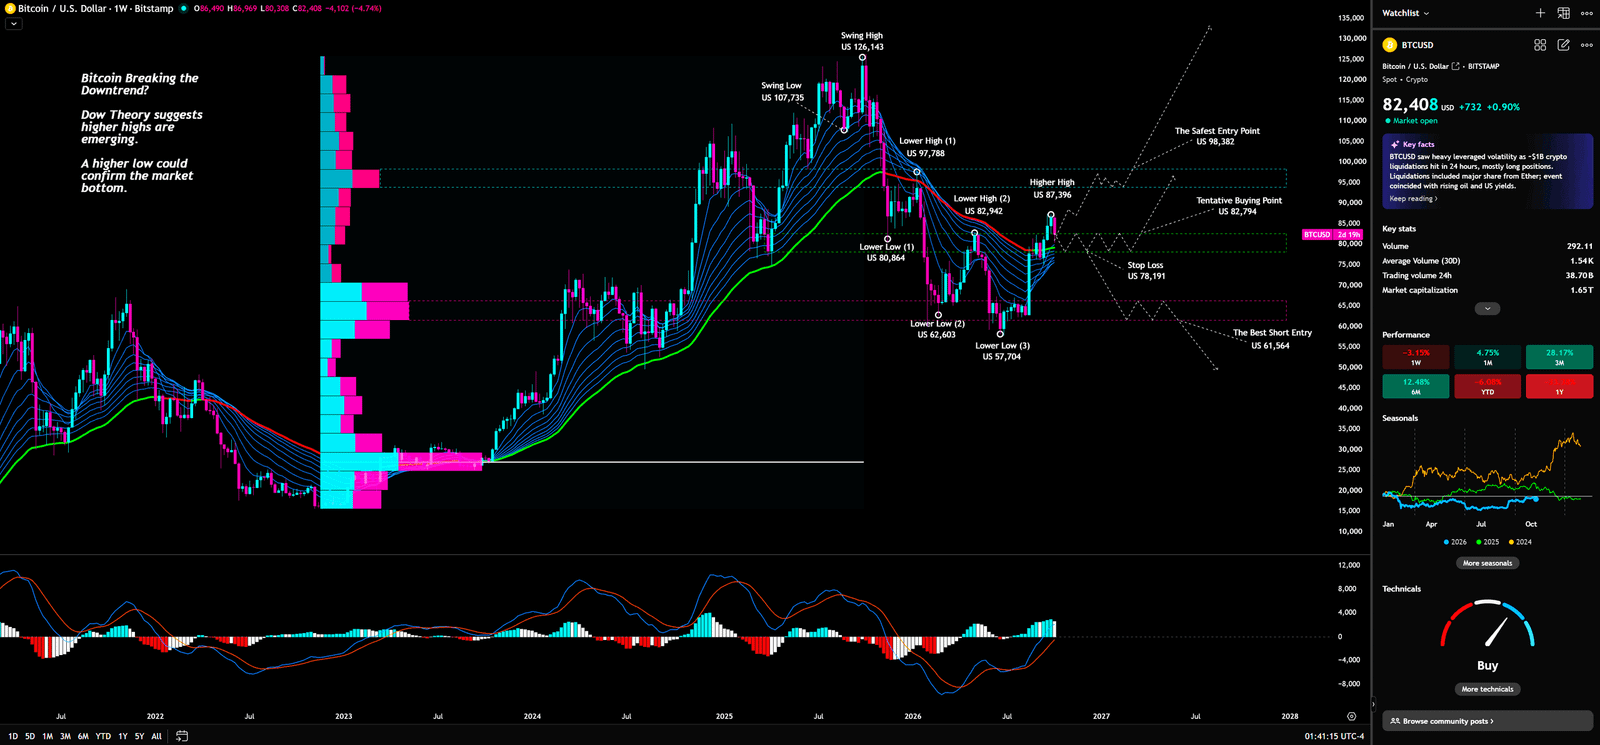
The visible weekly Dow labels are explicit and must be retained:
- Swing Low: $107,735
- Swing High: $126,143
- Lower High (1): $97,788
- Lower Low (1): $80,864
- Lower High (2): $82,942
- Lower Low (2): $62,603
- Lower Low (3): $57,704
- Higher High: $87,396
Additional printed weekly labels are also visible:
- The Safest Entry Point: $98,382
- Tentative Buying Point: $82,794
- Stop Loss: $78,191
- The Best Short Entry: $61,564
The key Dow conclusion is severe: a Higher High is marked at $87,396, but a confirmed Higher Low is not marked. That means the weekly chart has shown an attempt to change character, but not yet the structural proof needed to declare the regime repaired.
This is the difference between a trader shouting across the pit and a risk officer signing the ticket. Noise can be loud. Confirmation is bureaucratic.
A cyan/magenta horizontal profile-like distribution is visible, but there is no legible title, period, bin size, or POC. Therefore, no point of control, value area, or so-called vacuum zone can be invented. There are price-chart curves and a lower histogram/two-line panel, but their titles and parameters are not legible. They cannot be called MACD, EMA Ribbon, or anything else with technical certainty.
Elliott Wave caution: In a standard impulse, Wave 4 may not overlap Wave 1 territory. That is an iron rule. But no Elliott labels appear, so no count can be verified or invented.
Capital behaviour: Capital has not yet received the full weekly clearance. The Higher High $87,396 says upside pressure appeared. The missing confirmed higher low says risk has not been normalized. The market is still arguing around the older damage: Lower High (2) $82,942, Tentative Buying Point $82,794, and the stop at $78,191.
Retail misread: Retail often treats proximity to $82,794 as permission to pre-empt the signal. That is not structure. That is a guess dressed as courage. Another common error is seeing $87,396 and assuming a new bull leg is already secure. Without the higher low, the Dow map remains incomplete.
Institutional-style use: Institutional-style discipline does not require knowing who is buying or selling. It means treating levels as governance. $78,191 is not a debating club. It is the printed weekly Stop Loss. If reached under the plan, it is a red line, not an invitation to average down. $98,382 is labelled “The Safest Entry Point,” but price is not there. $61,564 is labelled “The Best Short Entry,” but that label alone does not authorize a trade without context and confirmation.
Trigger: The weekly picture improves only if BTC can reclaim and hold the zone around $82,794 and $82,942, then force acceptance through the daily gate at $84,064. A completed close matters. A defended retest matters more.
Invalidation: The clearest written invalidation is $78,191. If that stop condition is reached, discipline means exit under the plan, not a wider stop and a longer story.
💡 Weekly verdict: the rebound is alive, but it has not yet earned the word “reversal.”
Volume Profile / VPFR definition: volume profile places traded participation along price rather than time. Its point of control is normally the most active price row; low-volume areas can identify locations where price may move quickly. That power is precisely why false precision is dangerous. A cyan/magenta profile-like distribution is visible here, but no POC, value area, fixed range, bin size, or settings are readable. Calling a precise “vacuum zone” from that evidence would be like pricing a bond from half a term sheet: confident language, missing terms.
The distinction between the nearby weekly labels is equally important. $82,794 is explicitly called a Tentative Buying Point. It is not a completed acceptance stamp. $82,942 is marked Lower High (2), not confirmed support. The market must earn the right to reinterpret either level. If price reclaims them on a completed close and survives the retest, the map changes. If it merely trades near them, the map has not changed at all. In banking language, an indication of interest is not a funded allocation; the money only counts after the documents clear.

📊Daily Structure — Fibonacci as the Passport Control
Fibonacci retracement maps divide a price swing into proportional levels. Traders use them to identify where rebounds may stall, where pullbacks may stabilize, and where acceptance has to be proven. The tool is useful because it gives a fixed structural grid, but only if its anchors are respected.
Daily Timeframe for BTC (Bitcoin)
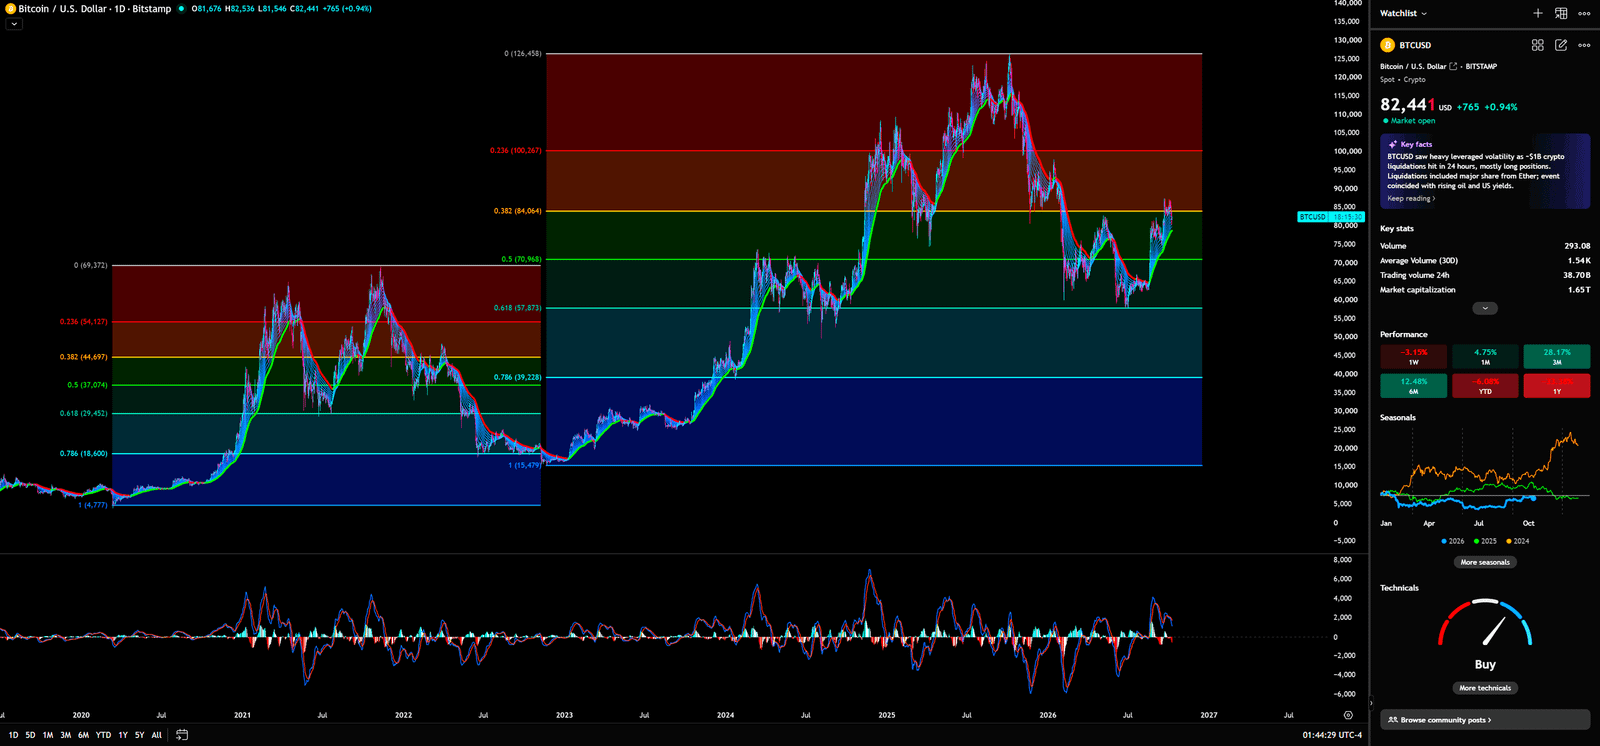
There are two separate daily Fibonacci sets.
The right, current-looking set shows:
- 0: $126,458
- 0.236: $100,267
- 0.382: $84,064
- 0.5: $70,968
- 0.618: $57,873
- 0.786: $39,228
- 1: $15,479
A separate left set shows:
- 0: $69,372
- 0.236: $54,127
- 0.382: $44,697
- 0.5: $37,074
- 0.618: $29,452
- 0.786: $18,600
- 1: $4,777
The anchors are not readable. These sets cannot be merged. Any blended interpretation would be false precision.
The screenshot price at its own capture was $82,441, inside the $70,968–$84,064 band. Other curves and lower oscillator titles are unreadable. A sidebar “Buy” label is not independently verifiable and cannot be treated as a signal.
Capital behaviour: Price is inside a contested daily chamber. Below $84,064, the rebound remains below the 0.382 retracement of the current-looking set. Above $70,968, the market has not collapsed into the next listed retracement. That creates pressure, not clarity.
Retail misread: Retail sees a bounce near $82K and calls it strength. The daily chart asks a harder question: has BTC actually closed above $84,064 and then defended it? Until that happens, the passport has not been stamped.
Institutional-style use: A disciplined desk would not need to predict emotion. It would define acceptance. A completed daily close above $84,064, followed by a defended retest, is materially different from an intraday spike into resistance. The first can change risk allocation. The second can trap impatience.
Trigger: The clean daily trigger is a completed close above $84,064, then a retest that holds. That is the support/resistance flip in its strict form: former resistance must become defended support before bullish reassessment deserves size.
Invalidation: Failure beneath $84,064 keeps the rebound suspect. A move into the weekly $78,191 stop condition invalidates the long-side plan that uses that stop. The rule is not to negotiate with it.
Daily verdict: $84,064 is the passport control. No close, no entry stamp.
The 0.382 line at $84,064 matters not because Fibonacci possesses mystical power, but because visible proportional levels concentrate decision-making. A fast wick can test the line. A completed close can start a conversation. A close followed by a defended retest is the first evidence that the conversation turned into acceptance. If price climbs above the line and immediately falls back into the $70,968–$84,064 interval, the market has answered: the door opened, but no buyer agreed to stay.
That is the S/R Flip in its strict form. Former resistance must become defended support. Anything less is not a breakout; it is an audition. Combining the second, separate Fibonacci set with the current-looking one just to manufacture a “super level” would be analysis by collage. Different anchors create different maps. A disciplined reader does not glue them together to make a more comforting story.
🌙Monthly Structure — Bollinger Bands, Pitchfan, and KDJ Without Fantasy
Bollinger Bands plot a moving average with upper and lower volatility bands. The visible legend reads BB 20 SMA close 2, meaning a 20-period simple moving average based on close, with bands set two standard deviations away. Traders use Bollinger Bands to judge whether price is extended, mean-reverting, or failing to reclaim its midline.
Monthly Timeframe for BTC (Bitcoin)
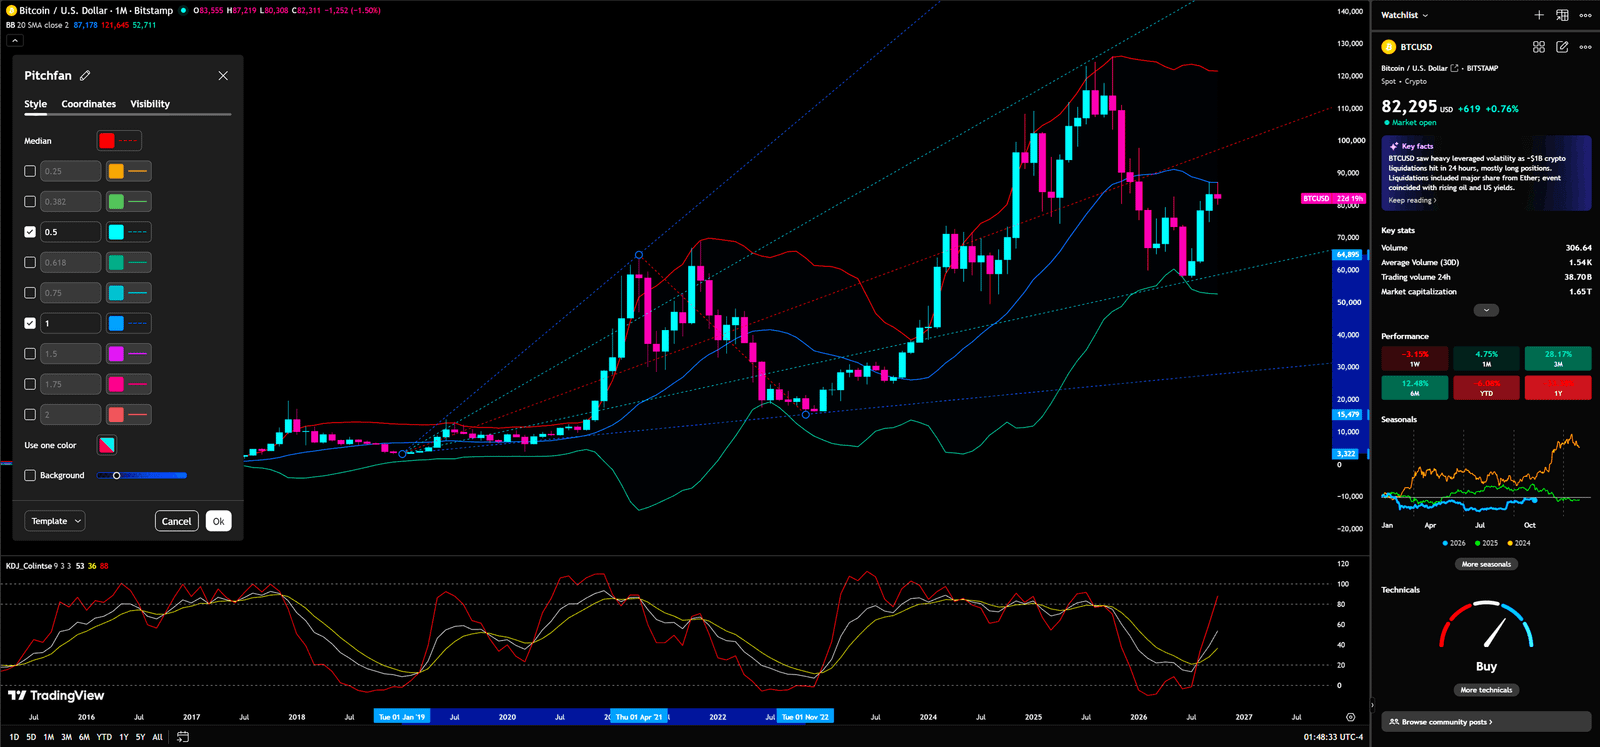
The monthly Bollinger values are readable:
- Upper band: $121,645
- Middle band: $87,178
- Lower band: $52,711
The screenshot close is $82,311, below the $87,178 middle band but within the outer bands. That matters. BTC is not outside the volatility envelope, but it is below the monthly mean.
Pitchfan definition: A pitchfan projects angled rays from selected anchors to estimate directional geometry. It is used to visualize slope, trend pressure, and possible reaction paths. Here, pitchfan rays and a red Median appear, but anchors and current intersection are not readable. No current pitchfan price level can be claimed.
KDJ definition: KDJ is a momentum oscillator related to stochastic analysis. It is used to gauge momentum and potential turning pressure. A KDJ title appears with values 53, 36, and 88, but the mapping of those values to K, D, and J cannot be verified, and the crossover rule cannot be confirmed. Therefore, no golden cross can be claimed.
Capital behaviour: The monthly chart is not offering rescue language. Price below the $87,178 middle band says the broader frame still carries mean-line pressure. Inside the bands says volatility has room both ways. That is not panic, but it is not dominance.
Retail misread: Retail loves oscillators when price is stressful. A visible KDJ title and three numbers can tempt a bullish reading. But if mapping and crossover rules cannot be verified, the signal is unusable. A vague oscillator is not a mandate.
Institutional-style use: Higher-timeframe discipline would treat $87,178 as a monthly mean-reclaim reference, not as a magical ceiling. Acceptance back above it would improve the macro posture. Rejection below it keeps the market defensive.
Trigger: A stronger monthly posture requires BTC to reclaim the $87,178 middle band on a completed close. Until then, the daily fight at $84,064 remains the nearer battlefield.
Invalidation: Continued failure below the middle band keeps monthly pressure active. If the weekly $78,191 stop condition is triggered first, that lower-timeframe risk rule dominates the manual plan before any monthly recovery thesis deserves patience.
Monthly verdict: BTC is inside the bands, but below the mean. That is not capitulation. It is unresolved risk. The monthly frame is the board meeting, not the chat room. The $87,178 middle band is the 20-period mean within the displayed volatility framework. Until price reclaims it on a completed monthly close, claims that the long-term posture is “safe” are simply premature. Conversely, a brief intramonth poke above it is not an acquittal. Monthly evidence is deliberately slow because higher-timeframe capital is not supposed to change policy every time a short-term candle gets dramatic.
📐Four-Hour Structure — Gann Fan as a Time-Moving Test
A Gann Fan projects angled rays from a selected low or high. Its ratios describe slope relationships, not fixed horizontal support. Traders use it to judge whether price is respecting or losing directional speed through time.
4-Hour Timeframe for BTC (Bitcoin)
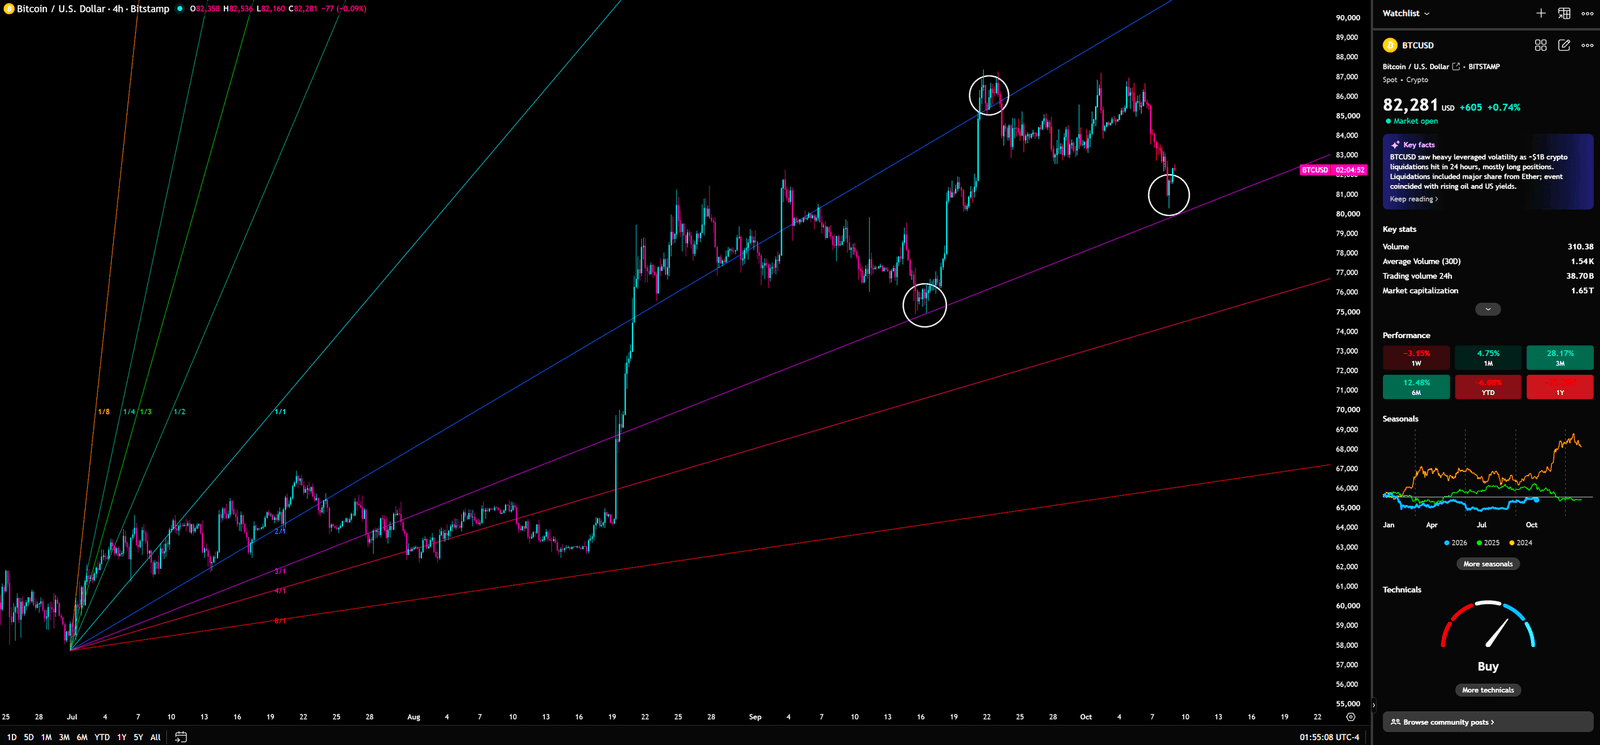
The 4-hour chart shows a Gann Fan from a shared low with the following rays: 1/8, 1/4, 1/3, 1/2, 1/1, 2/1, 3/1, 4/1, 8/1.
The latest visible 4-hour candle shows:
- Open: $82,358
- High: $82,536
- Low: $82,160
- Close: $82,281
That candle sits near the purple 3/1 ray. Because Gann lines move with time and the current intersection value is not readable, no fixed Gann support can be invented.
Capital behaviour: The 4-hour chart is testing slope, not a static floor. Buyers need more than proximity to a ray. They need a completed close and then a defended retest relative to the relevant ray at that time.
Retail misread: The common mistake is treating a diagonal line as a hard price level. A Gann ray is not a concrete wall. It is a moving benchmark. If time changes, the intersection changes.
Institutional-style use: A disciplined operator would use the 4-hour frame for execution timing only after the higher frames define permission. If daily $84,064 is not reclaimed, 4-hour strength can remain tactical noise.
Trigger: A usable 4-hour improvement requires a completed close beyond the relevant Gann ray at that time, then a retest that holds. Better still, that action should align with the daily reclaim of $84,064.
Invalidation: A failed retest after a 4-hour close is the warning. A slide into $78,191 is the written risk event for the broader plan.
Four-hour verdict: useful for timing, dangerous for conviction if isolated.
🎭Retail Versus Institutional-Style Discipline
Retail often trades the headline. Institutional-style risk management trades the rulebook.
That does not mean identified institutions are buying or selling here. It means professional behaviour tends to define exposure before the trade, define invalidation before the entry, and reduce debate once the line is crossed.
Retail sees $84,000 mentioned in commentary and rounds everything into a heroic pivot. A risk desk separates the Bitfinex narrative from the chart-derived $84,064 Fibonacci level. Close first. Retest second. Allocation only after proof.
Retail sees $78,191 and thinks, “maybe give it room.” A dealing-room veteran hears the margin clerk’s footsteps. The stop is not decoration. It is the emergency exit printed before smoke fills the hallway. Retail chases the rebound because the candle is green. Institutional-style process asks whether capital has accepted higher prices. That difference is everything.
🎯Bull, Base, and Bear Scenario Scripts
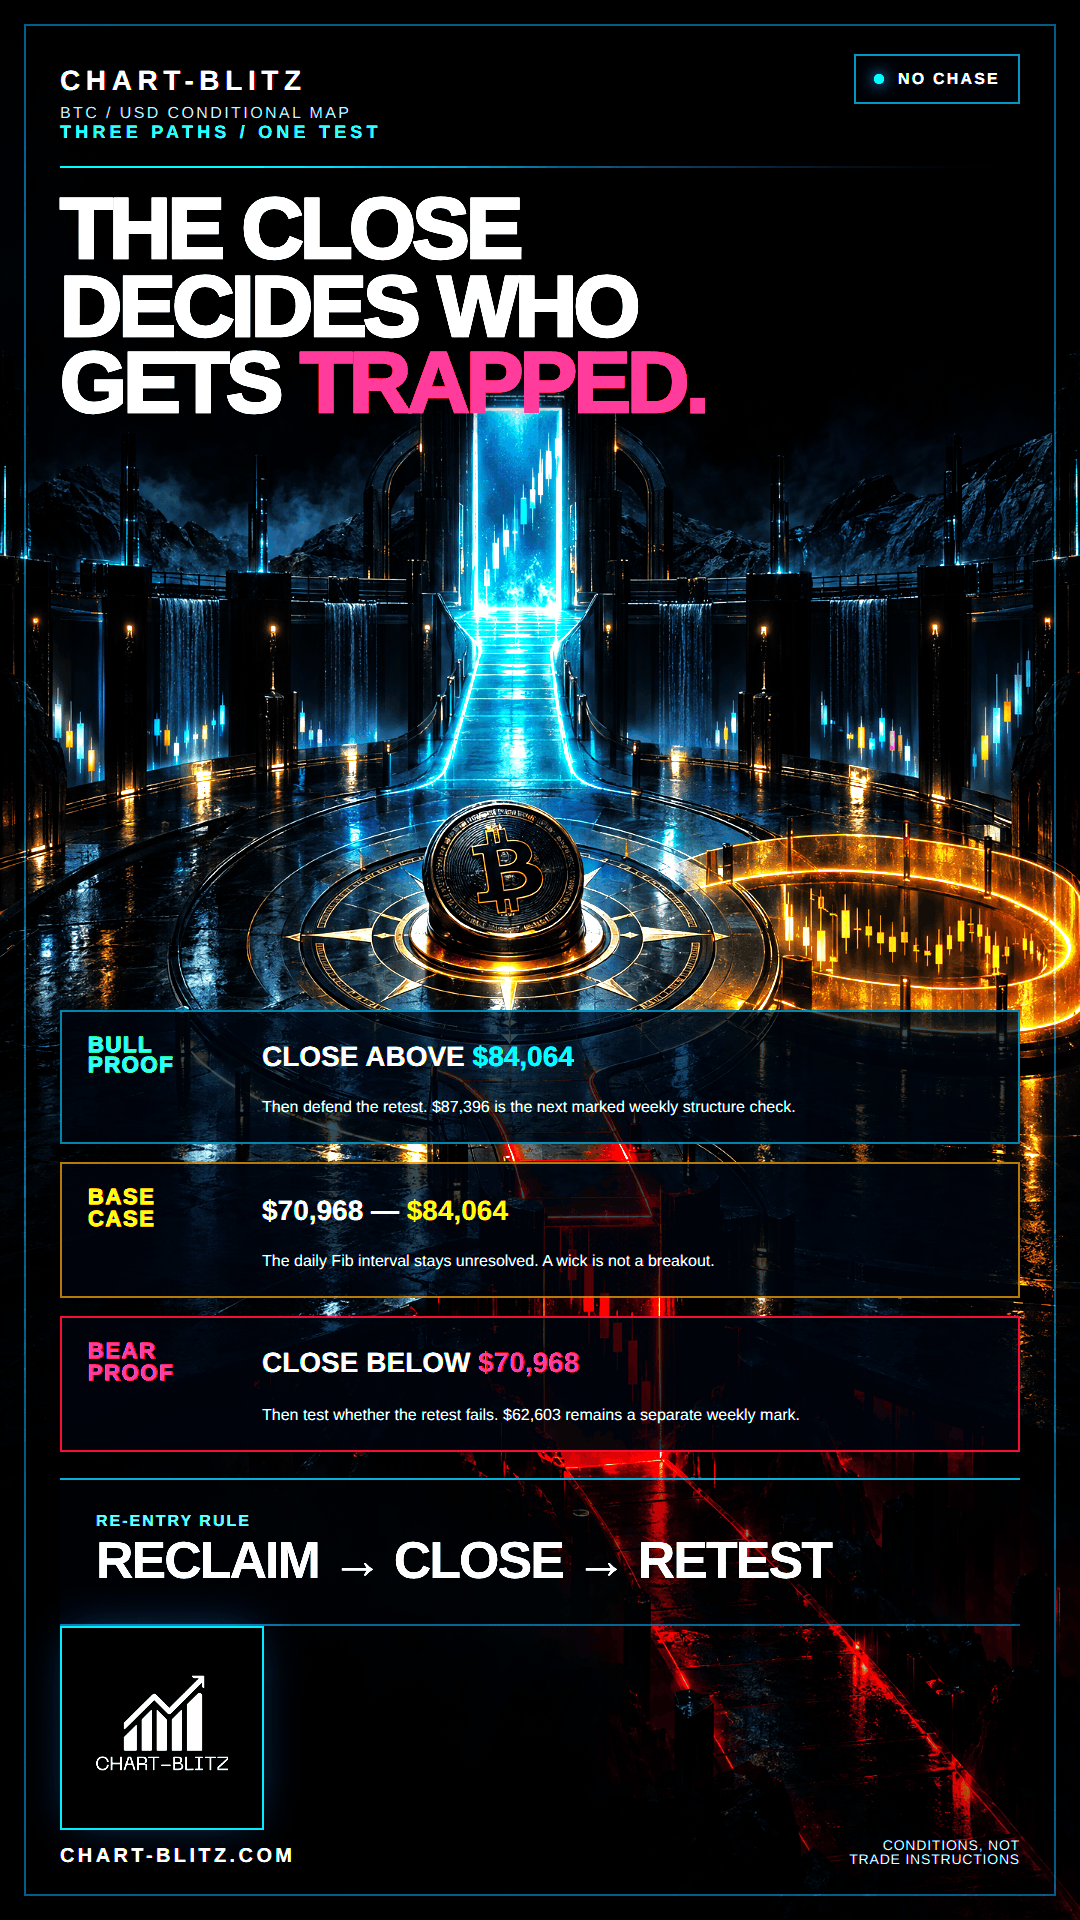
Bull script: BTC completes a close above $84,064, then defends the retest. That would flip resistance into support and shift attention toward the monthly middle band at $87,178 and the weekly Higher High $87,396. A true weekly repair still needs a confirmed higher low, which is not marked yet. The bullish case begins with acceptance, not enthusiasm.
Base script: BTC remains trapped below $84,064 but above $78,191. This is the chop script: enough rebound to punish late shorts, not enough structure to reward impatient longs. The market keeps negotiating around $82,794 and $82,942, while the daily passport stays unstamped.
Bear script: BTC fails beneath resistance and reaches the $78,191 stop condition. That would turn the rebound into a failed relief attempt. The next referenced daily and weekly map points include $70,968, $62,603, and $57,873, with $57,704 also marked as a weekly lower low. This is not a forecast of immediate travel. It is the risk map if the red line breaks.
The market is not obliged to reward bravery. It rewards process.
There is no virtue in choosing a script before price chooses it. Bullish proof needs proof. Bearish proof needs proof. The range needs no hero at all. Sitting out an unresolved interval is not a failure of conviction; it is a preservation of optionality. The most expensive desk habit is paying spread, funding, and attention to prove an opinion inside a band that has not offered an edge.
📝Conditional Manual Trading Plan
This is a conditional framework only. It is not an instruction to trade and does not place, trigger, route, or execute any order.
| Condition | Meaning | Conditional manual response | Invalidation |
| Completed close above $84,064 | Daily resistance breached | Wait for defended retest before reassessment | Retest fails back below $84,064 |
| Hold above $82,794 and $82,942 | Weekly labels defended tactically | Treat as stabilization, not confirmation | Loss of structure toward $78,191 |
| Completed reclaim of $87,178 | Monthly middle band regained | Macro posture improves | Monthly failure below $87,178 |
| Price reaches $78,191 | Printed stop condition | Exit under the pre-written plan; do not widen | No exception inside this plan |
| 4-hour close beyond relevant Gann ray | Timing improvement only | Require retest and alignment with daily structure | Failed 4-hour retest |
I will continue to closely monitor the price action of this Crypto. As soon as a critical reversal signal appears on the charts, I will update my analysis and insights right here immediately. Remember to Bookmark this page and come back often to check for the latest updates!
Want to see our full, interactive chart breakdown? If you want to learn how to draw weekly VPFR, Fibonacci, EMA Ribbon, MACD, Supertrend, and S/R Flip frameworks designed for real trading decisions. Please browse the following『Further Reading』links. Fundamental news tells you what happened. Technical analysis predicts what will happen. To master the professional framework that separates market signal from noise, explore our exclusive models at https://www.chart-blitz.com/fxcx-app/omni-chart.html?symbol=BTC.
📚Further Reading:
To help everyone gain a deeper understanding of the various technical indicators mentioned in this article, we have specially prepared the following further reading materials. These cover key analytical tools found across the weekly, daily, monthly, and 4-hour charts.
- Decoding Fibonacci Retracement: The Perfect Blend of Natural Law and Market Psychology — Fibonacci Retracement is not just a set of magical numbers; it is a manifestation of market psychology. Learning how to correctly draw and interpret Fibonacci levels is a required course for every serious trader.
- Is a Major Move Hiding in Plain Sight? Dow Theory May Already Know the Answer — As retail traders continue to chase short-term signals, experienced market readers are looking deeper — into trend structure, volume behavior, and market phases that may expose the early clues of a coming breakout.
- Understanding VPFR: Finding the Hidden Footprints of Market Makers — The Volume Profile Fixed Range (VPFR) is a powerful tool that tells us where the most trading occurred within a specific price range. This helps us identify true support and resistance levels, as well as potential ‘Vacuum Zones’.
- S/R Flip Support and Resistance Swap Strategy — S/R Flip is one of the most powerful concepts in technical analysis. This article uses real cases to teach you how to use S/R Flip to capture the highest win-rate trading opportunities.
- MACD Momentum Indicator Momentum First — What Does the MACD Line Crossing Above Zero Mean? Golden Cross & Divergence Signals!
- Gann Fan Masterclass — Deep dive into W.D. Gann’s angle theory to identify the geometric relationship between time and price in the market.
- Strategies for EMA Ribbon Bearish Alignment: Dead Cat Bounce or Real Reversal — Deep dive into the EMA Ribbon to understand the battle between short-term and long-term capital.
- Bollinger Band: Long-Term Repricing Zone — The Ultimate Tool to Capture Massive Market Moves Tired of getting shaken out of winning trades too early? Or buying right before a trend reverses? An ex-banker reveals how to use the Bollinger Band to filter out market noise and ride the big waves.
- KDJ Stochastic Indicator Bottom Confirmation — What is the implication of a downward-curving KDJ? Understand in one article how to use dynamic indicators to catch market turning points.
【Disclaimer】 The content herein is for educational purposes and reflects the author’s personal opinion only; it is not investment advice. All financial investments, including cryptocurrencies, carry significant risk, and you could lose your entire capital. To support this site, this article may contain affiliate links. While we strive for accuracy, we cannot guarantee all information is complete or error-free. Please conduct your own research and be fully responsible for your own investment decisions.