Fetching Live Market Data...
When you make a trade, you should have a clear target of where you expect to get out
William Delbert Gann – 1949
You think Citigroup lifting the 12-month target to $3,028 certified the weekly Higher High at $2,747.9. The desk thinks you just volunteered to queue outside the gate. That is not a metaphor. It is the book. Every reason you are using — a bank target, ETF inflows, a tagged Higher High — is a reason the other side of your trade can use against you.
Ethereum’s most dangerous moment is not a break below Stop Loss $2,353.9. It is the moment a Citi headline convinces late buyers that the weekly already stamped a bull-market passport on a trial high. The chart’s own green note is colder: a weekly higher high hints at a turnaround; a higher low and rebound would confirm it; a break below the prior low could signal another crash. The next run at $3,243.6 can be the start of a trend. It can also be the most expensive fake break of your quarter. Which evidence do you actually need before you believe it?
Working quote after the lock, two named venues: Investing.com Ethereum at $2,736.55 and OKX ETH session close $2,737.85, midpoint $2,737.20. The 24-hour percentage is Investing.com’s token return of +1.11%. That is not a market-cap percentage dressed up as a price move.
News compresses the whole tape into one lazy sentence: the bank raised the target, so the bull is back. Citigroup lifted its 12-month Ethereum forecast from $2,240 to $3,028 and its Bitcoin target from $82,000 to $113,000, citing stronger activity, a better macro backdrop, and a resumption of spot ETF inflows. The same note expects about $5 billion of crypto-product inflows over twelve months, slow and steady, not a stampede. In the same window, a TradingView digest put roughly $690 million into Ethereum funds between September 21 and 25, then spot Ethereum ETFs printed consecutive outflow days, including about $60 million on Wednesday. The headline and the structure have already stopped moving together.
If you felt late at $2,717.2, that feeling is the product. Who had to buy? A raised target can put advisers back in the queue. Who was allowed not to buy? Any book that still has not seen a Higher Low. Treat it like an unused credit line: retail counts the limit as cash already drawn; the desk asks whether the committee stamped, whether a Higher Low exists. The line can be real. The draw can still be delayed.
【📊Analysis Baseline Statement】
All technical analyses below are based on the price snapshot locked on October 2, 2026 (EST): 01:54 Ethereum (ETH) = $2,717.2USD. Please treat this report is an analytical map, not a live executable quote. Fragmented crypto venues can differ by a few dollars; every decision must be checked against the same venue and a completed candle before action is considered.
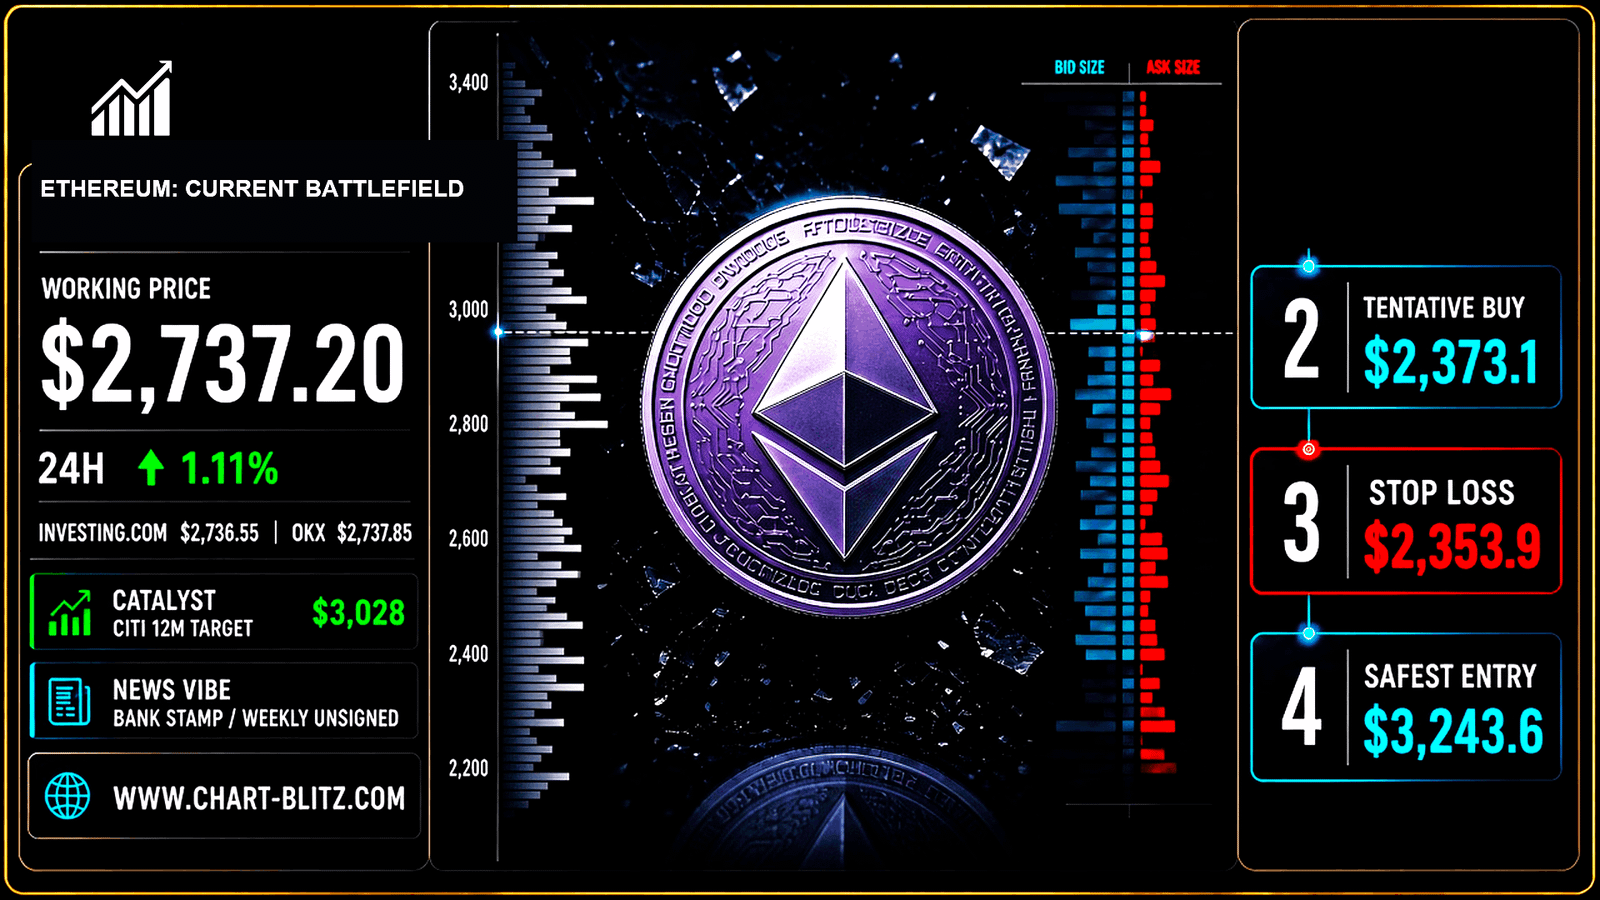
🔥 Citi Stamped $3,028. The Weekly Still Did Not Stamp a Higher Low.
A bank target is a mechanical catalyst. It is not trend confirmation. The forecast measures whether advisers might add slowly. It does not measure whether Dow structure printed a Higher Low. The same week, the Clarity Act did not advance in the Senate. Citi itself said the path to a market-structure bill narrowed, with the SEC and CFTC using existing authority to cushion sentiment.[3] Price can still range $2,600–$2,800 while the tape reads “$3,028” as if it had already arrived.
⚠️ These numbers measure fuel and story. Fuel can shove price through a VPFR vacuum. Fuel cannot sign a weekly close. Retail reads $3,028 as a bull passport. The desk reads the same note as: the line was approved, the exam was not passed. Flow can arrive one week and shrink the next — exactly while price sits near $2,717, still under the daily 0.5 at $2,923.5.
💡Four frames. One question: did it hold?
The Price and Timestamp above are the print this piece froze at the close of writing — not the tape now. Markets move; the copy does not. The only check that matters is whether that freeze still holds. Open Chart Grid: One name, Four frames, locked Weekly → Daily → Monthly → 4-Hour, the article’s print against the live chart. You do not pick timeframes, and you should not trust the headline. Hold or break: you decide.
🌊 WEEKLY COMMITTEE — $2,747.9 Is Exhibit A. The Gate Still Sits at $3,243.6
The weekly chart is the highest authority on this desk. The visible Dow labels are Swing High $4,955.3, Lower High (1) $3,403.2, Lower High (2) $2,424.3, Higher High $2,747.9, Swing Low $2,621, Lower Low (1) $1,799.8, and Lower Low (2) $1,510.1. The path labels are The Safest Entry Point $3,243.6, Tentative Buying Point $2,373.1, Stop Loss $2,353.9, The Safest Short Entry Point $1,875.6. The green note already wrote the conditions: a Higher High only hints; a Higher Low and rebound would confirm; a break of the prior low could crash again.
Weekly Timeframe for ETH (Ethereum)
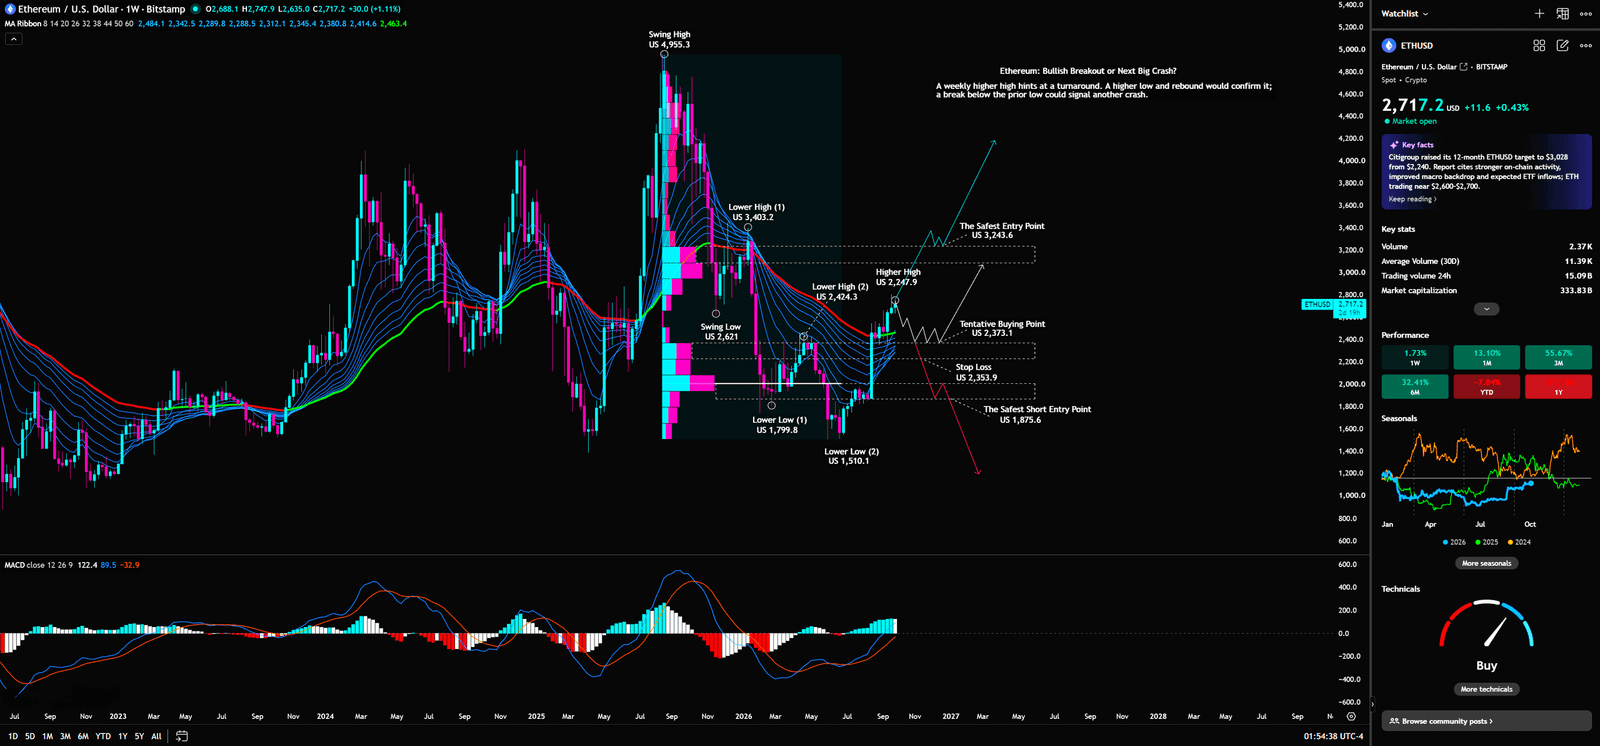
Dow Theory is not a museum piece here. An uptrend needs higher highs and higher lows. A downtrend speaks in lower highs and lower lows. $2,747.9 is tagged as a Higher High, but it still sits under Lower High (1) at $3,403.2 and on top of two lower lows. Until a Higher Low prints above $2,621, no bull certificate has been stamped. Calling $2,747.9 a breakout is counting an unapproved committee file as cash already wired.
VPFR moves volume off the time axis and onto price. POC and the value area are where the market accepted inventory. LVNs — vacuum zones — are corridors the market travelled through because almost nobody wanted to transact there. The advanced read is not “buy the pink bar.” It is: did this bounce get accepted inside a high-volume node, or did it sprint through a vacuum to harvest the next cluster of retail stops? The green box maps a volume shelf from roughly the $1,800s upward. Price is travelling on the path at the upper-right of that box. No POC number is printed — do not invent one. What is visible: denser volume in the mid-range, thinner inventory toward the top — exactly where a headline is most useful as exit liquidity.
The EMA Ribbon (8 through 60) measures whether a trend has fanned open. The amateur trap is treating a cross as an entry. The advanced use is squeeze, then fan, then a pullback that reclaims. The green ribbon once carried the bull run. In the decline it flipped red and pinned price. Price is now pressing the upper edge of the ribbon again. That is not yet proof the ribbon has turned back into an institutional life-raft instead of a retail shackle.
MACD (12,26,9) prints 122.4 / 89.5 / −32.9. Histogram flipping from negative to positive only proves momentum stopped decelerating. It does not prove structure healed. Advanced use is divergence and histogram expansion — not a zero-line gold cross as a bull diploma.
Retail misread: $2,747.9 broke, so it is a breakout; Citi $3,028 is the next stop. Institutional use: $2,747.9 is a trial; the confirmation gate is $3,243.6; until a Higher Low exists, $2,373.1 is a probe and a close through $2,353.9 cancels the hypothesis.
Confluence is the only honest entry story. Dow still missing a Higher Low, VPFR showing price off the fattest column waiting for acceptance, a ribbon that has not re-fanned into a life-raft, and a MACD that flipped without repairing structure. One bank target does not cover those four holes. One inflow week does not cover them either. The desk will not let a forecast overwrite structure. Retail will. That asymmetry is the gate. The more you hurry, the more expensive the gate. The more you use the headline to prove you are not late, the easier it is for the desk to harvest you at $2,747.9. This market does not owe you a story. It owes you an invalidation you will actually honor. Until a Higher Low prints, “buy now or miss it” is a sales script.
Trigger: a weekly Higher Low above $2,621 that holds on the close, after which $3,243.6 becomes a confirmation gate. Invalidation: a weekly close through Stop Loss $2,353.9, which reopens the lower-low sequence.
Desk note: $2,747.9 is a trial high. The bull certificate is not on this weekly candle. It is on a Higher Low that has not printed, and on the gate at $3,243.6.

📊 DAILY 0.5 EXAM — $2,717 Is Still Under $2,923.5
Daily Fibonacci is anchored from $4,966.9 down to $880.0: 0.236 at $4,002.4, 0.382 at $3,405.7, 0.5 at $2,923.5, 0.618 at $2,441.2, 0.786 at $1,754.6. Price at $2,717.9 sits between 0.5 and 0.618. It has not reclaimed $2,923.5.
Daily Timeframe for ETH (Ethereum)
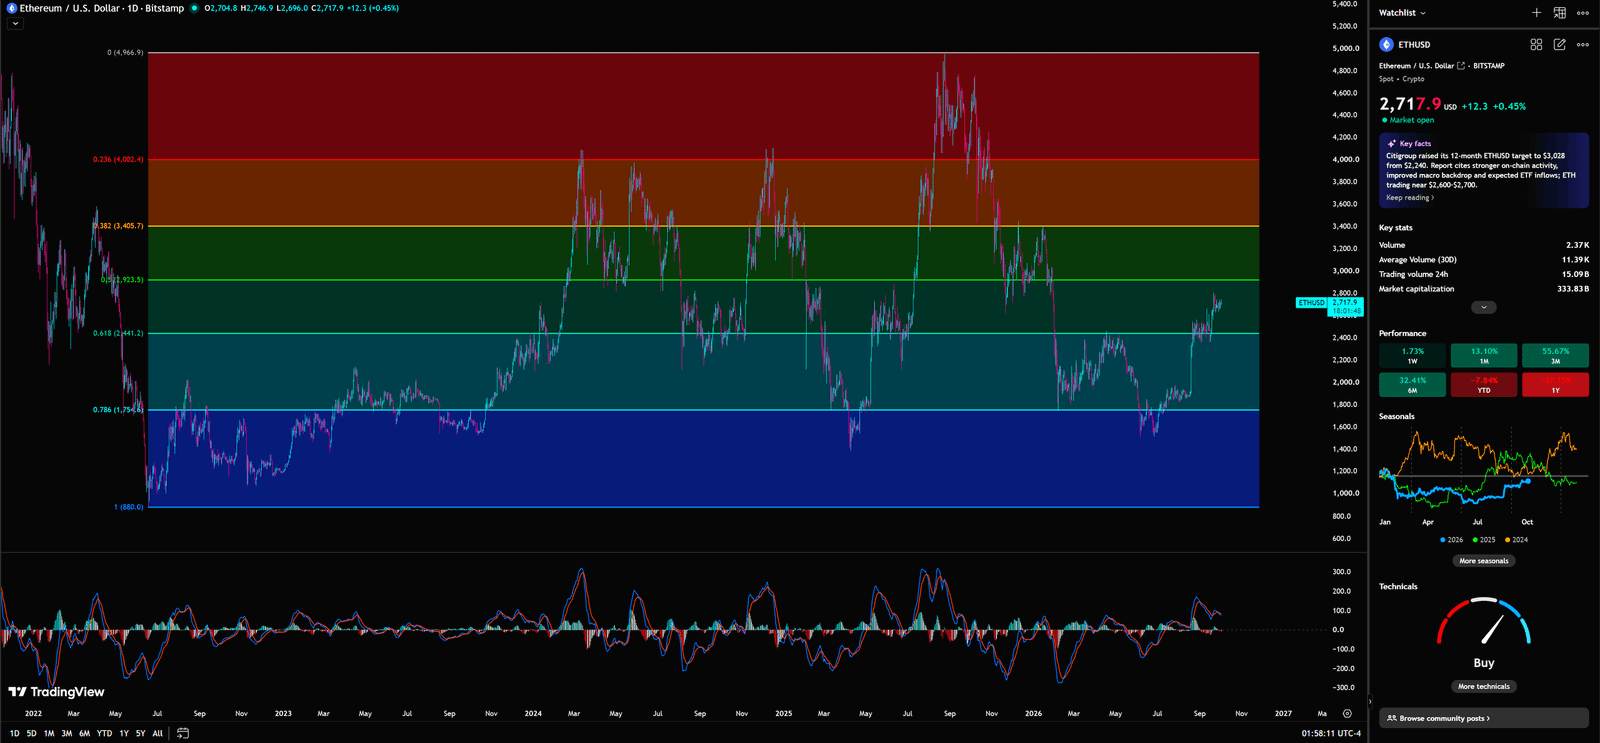
Fib is not prophecy. 0.5 is the mid-line exam after a deep cut. Advanced use: acceptance is a close that holds, not a wick that tags the line. Praising $2,717 as “already back” is consolation for a trade that has not started. The diploma is surviving $2,923.5 long enough to queue at $3,243.6 — not skipping the exam because Citi printed $3,028.
0.382 at $3,405.7 is still overhead supply, stacked almost on weekly Lower High (1) at $3,403.2. Even if 0.5 holds, the next daily exam is that wall — not the social-media slogan of “next stop three thousand.” 0.618 at $2,441.2 was previously accepted value. If 0.5 is never recaptured and price gives 0.618 back, the exam failed before it started.
Daily MACD is visible after a tangle near the zero line, with histogram flipping up. Advanced: histogram expansion must pair with a close that holds 0.5. A gold cross alone is not enough.
Capital that defended 0.618 is now being examined at 0.5. Retail misread: $2,717 is back, so the bull is certified. Institutional use: a failed reclaim sells into FOMO; a successful reclaim migrates inventory to the queue in front of $3,243.6 instead of grabbing chips outside the gate.
Trigger: a daily close that holds above $2,923.5 and does not immediately fall back. Invalidation: a close back under $2,441.2, which reopens the weekly Tentative / Stop case.
Desk note: $2,923.5 is an exam scoreline. Sitting under it and calling yourself passed is a lie you tell yourself.
🌙 MONTHLY MIDLINE $2,637.6 IS RECLAIMED — J at 95.2 Is Not Acquittal
Monthly Bollinger Bands (20, 2) print a midline at $2,637.6, an upper band at $4,230.7, and a lower band at $1,044.6. Price at $2,719.5 has recaptured the midline. The midline is the volatility mean, not decoration. Advanced: reclaiming the mid-band means the monthly is no longer using a one-vote veto to kill this bounce. The upper band at $4,230.7 is still extreme expansion, not a passport from here. A Band Walk needs consecutive closes above the mid, tags of the outer band, then a retest of the mid that holds — this is only the first reclaim.
Monthly Timeframe for ETH (Ethereum)
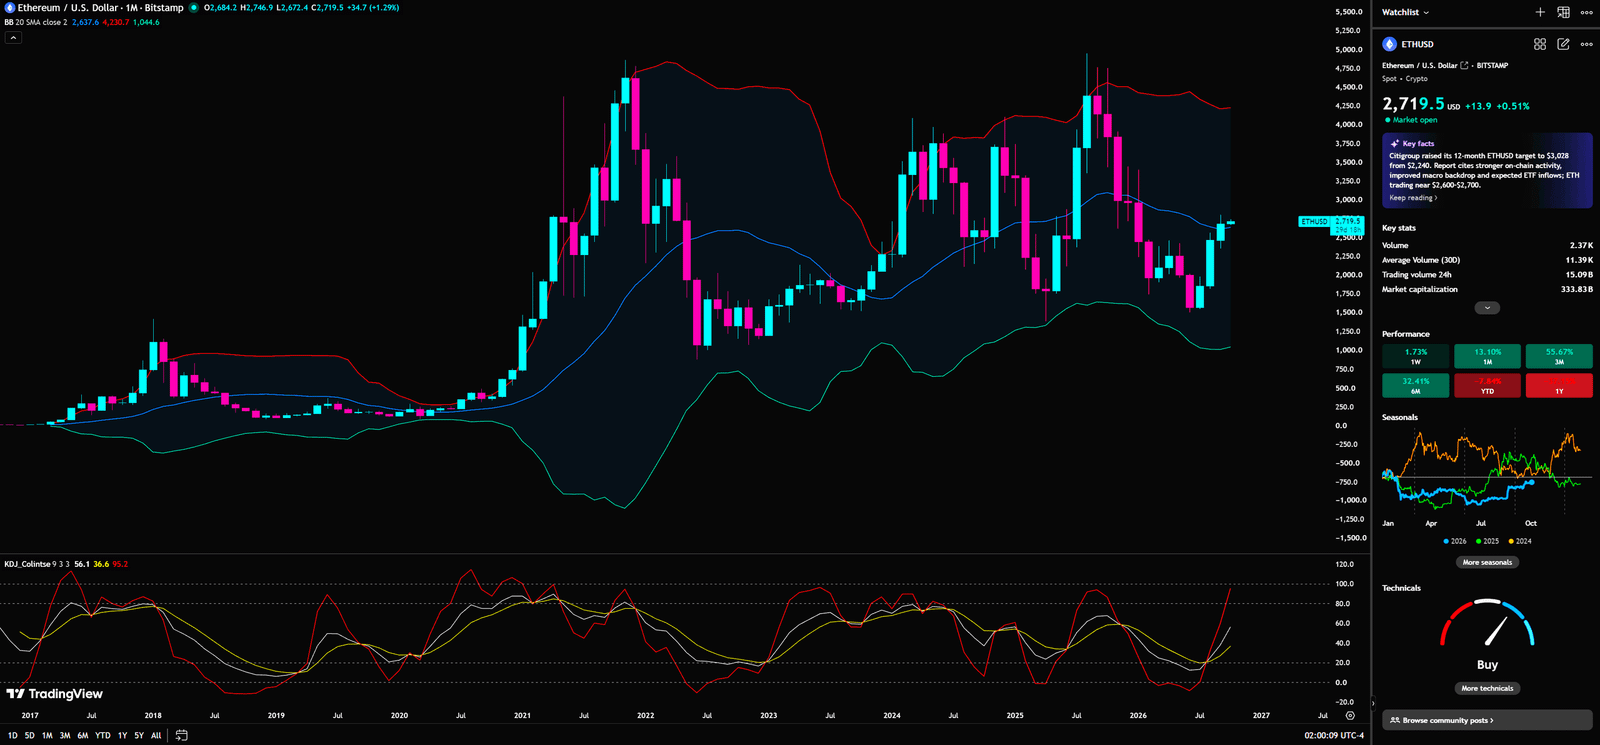
Monthly bands deserve more respect than a flashy intraday candle because a monthly close is difficult to fake with a few hours of excitement. What does capital behavior look like here? Longer-term allocators can begin evaluating exposure while waiting for volatility to resolve. What does retail misread? It sees the lower half of a band and calls it “cheap.” What do institutions look for? A recovery of the middle band, an upward expansion in volatility, and price acceptance that survives the next monthly decision point.
KDJ (9,3,3) prints K 56.1, D 36.6, J 95.2. K has just crossed 50. D is slower. J at 95.2 only proves oversold pressure is releasing fast. It does not prove the monthly has entered a stable bull regime. Treating 95 as an overbought exit or as a bull conversion is textbook laziness on both sides. This timeframe now does one job: the mid-band is recaptured, so the veto is lifted; a spike in J does not mean the committee has adjourned.
Slow money uses the monthly veto. Retail misread: a green monthly candle plus a KDJ turn plus J near 100 means the bull is done. Institutional use: the mid-band is recaptured, but every weekly hero trade is still a probe until a Higher Low prints. Trigger: monthly closes that hold above $2,637.6 while J cools into 40–80 and stays there. Invalidation: a monthly close back under $2,637.6, or KDJ rolling over before it holds.
Desk note: the monthly midline and the weekly trial high are not the same certificate. Recapturing the mid only cancels a veto. It does not stamp.
📐 4-HOUR RIDING 1/1 — Speed Is Not Permission
The 4-hour Gann fan rises from the mid-September low. Visible rays include 1/8, 1/4, 1/3, 1/2, 1/1, 2/1, 3/1, 4/1, 8/1. A white circle marks the collision with 1/1, after which price ran along the line. Last print $2,724.4 is above 1/1.
4-Hour Timeframe for ETH (Ethereum)
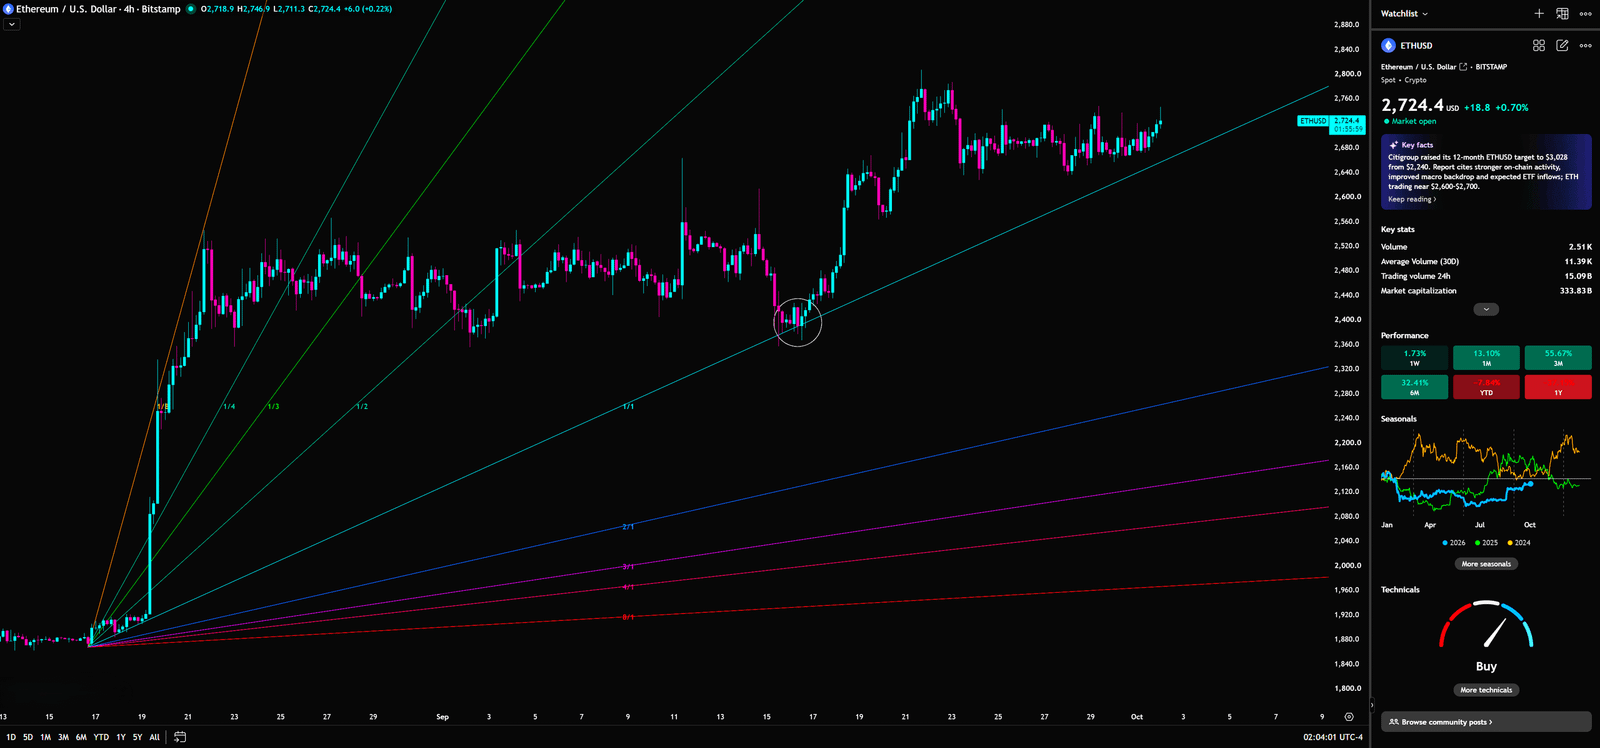
Gann angles are worthless unless the anchor and the scale are locked. 1×1 is time-price balance. Advanced use: the trade is the retest after the angle holds — not the first close beyond it. Price has already stretched along 1/1. The circle shows the line was tested.
Riding 1/1 explains the speed. Once that angle caught, stops and chase orders ran together. A 4-hour execution gate still cannot write a weekly Higher Low. Speed is not permission. Jogging the corridor is not service. The steep 1/8 orange ray is unbroken, which means a faster time-to-price ratio has not been confirmed from that anchor.
Trigger: a 4-hour retest of 1/1 that holds, without collapsing back into the circled structure. Invalidation: a close back under 1/1, which treats the acceleration as a fake. Weekly Stop Loss $2,353.9 still covers every short-horizon hero trade.
Desk note: the 4-hour is already jogging the 1/1 corridor. The weekly has not issued the pass.
🎭 Retail Buys the Citi Target. The Desk Buys Your Stop. Same $2,717.2. Two Businesses
Retail’s model this week is a mash-up: Citi $3,028 equals a bull passport; $2,747.9 equals a breakout; daily $2,717 equals already back; monthly mid-band reclaim equals the end of the bear; a 4-hour ride on 1/1 equals full size. Each sentence sounds true alone. Together they are a gate menu.
The desk’s model is the inverse: the forecast is fuel; $2,747.9 is a trial; $2,923.5 is an exam; $2,637.6 only lifts a veto; 1/1 is execution speed. They can hand inventory to FOMO on a fuel day and sell the same inventory again on an exam-fail day. Treat it like a syndicate bookbuild. The headline is the roadshow. Allocation is the trade. Citi’s note is headcount at the roadshow. A weekly Higher Low is the allocation list. Do not stand at the roadshow door and count yourself as filled.
Same candle. Two P&L machines. You bought the feeling. The desk bought your stop.
The 18-to-45 book does not usually blow up because it cannot name RSI. It blows up because “I am late” becomes a reason to click. That feeling is designed. Headlines, bank targets, green monthly candles, a held 1/1 — all packaging. Under the packaging the map is unchanged: no Higher Low, daily 0.5 unreclaimed, Safest Entry still at $3,243.6. You do not need another headline. You need a list that will not let you tell yourself “wait a little more” after $2,353.9 is gone. The gate is not loud. The gate waits for you to walk in. Once you are inside, you are liquidity. Do not collect that sentence as a quote. Use it as position size. Until the stamp exists, you are not an investor. You are a corridor. Corridors can get paid. Corridors can also be used once and discarded. Which one you are is your size, not the headline. The chart decides. The close counts.
🎯Three Scripts: Bulls Need the Gate, Bears Need $2,353.9, The Mid Is a Punishment Range
Bull. The weekly prints a Higher Low above $2,621. The daily holds $2,923.5. The monthly stays above $2,637.6. The 4-hour retests 1/1 and holds. Only then is $3,243.6 a confirmation gate — not a chase of $2,747.9 from here, and not Citi’s $3,028 treated as already printed.
Bear. The weekly closes through Stop Loss $2,353.9. Tentative $2,373.1 fails. Daily gives back $2,441.2. First downside map is The Safest Short Entry Point at $1,875.6, then LL(1) at $1,799.8. Until that close exists, do not treat fear as a fact that already happened.
Range / punishment. Price is trapped between Tentative $2,373.1 and the trial high at $2,747.9 while ETF flow arrives one day and shrinks the next and bank targets change with the note. The most expensive behaviour in this band is chasing breakouts — exactly the behaviour the green weekly note forbids
📝 Enter on Confirmation, Exit with Discipline — Great Traders Control Risk, Not the Market
Position size is the question of how much you can lose through $2,353.9, not how pretty the bull script sounds. Confirmation list: weekly Higher Low, daily $2,923.5 close, monthly mid-band, 4-hour 1/1 retest. Until those four line up, a probe is a probe. It is not a religion. Great traders do not control Ethereum. They control the moment they are allowed to feel that they are no longer late.
I will continue to closely monitor the price action of this Crypto. As soon as a critical reversal signal appears on the charts, I will update my analysis and insights right here immediately. Remember to Bookmark this page and come back often to check for the latest updates!
Want to see our full, interactive chart breakdown? If you want to learn how to draw weekly VPFR, Fibonacci, EMA Ribbon, MACD, Supertrend, and S/R Flip frameworks designed for real trading decisions. Please browse the following『Further Reading』links. Fundamental news tells you what happened. Technical analysis predicts what will happen. To master the professional framework that separates market signal from noise, explore our exclusive models at https://www.chart-blitz.com/fxcx-app/omni-chart.html?symbol=ETH.
📚Further Reading:
To help everyone gain a deeper understanding of the various technical indicators mentioned in this article, we have specially prepared the following further reading materials. These cover key analytical tools found across the weekly, daily, monthly, and 4-hour charts.
- Decoding Fibonacci Retracement: The Perfect Blend of Natural Law and Market Psychology — Fibonacci Retracement is not just a set of magical numbers; it is a manifestation of market psychology. Learning how to correctly draw and interpret Fibonacci levels is a required course for every serious trader.
- Is a Major Move Hiding in Plain Sight? Dow Theory May Already Know the Answer — As retail traders continue to chase short-term signals, experienced market readers are looking deeper — into trend structure, volume behavior, and market phases that may expose the early clues of a coming breakout.
- Understanding VPFR: Finding the Hidden Footprints of Market Makers — The Volume Profile Fixed Range (VPFR) is a powerful tool that tells us where the most trading occurred within a specific price range. This helps us identify true support and resistance levels, as well as potential ‘Vacuum Zones’.
- S/R Flip Support and Resistance Swap Strategy — S/R Flip is one of the most powerful concepts in technical analysis. This article uses real cases to teach you how to use S/R Flip to capture the highest win-rate trading opportunities.
- MACD Momentum Indicator Momentum First — What Does the MACD Line Crossing Above Zero Mean? Golden Cross & Divergence Signals!
- Gann Fan Masterclass — Deep dive into W.D. Gann’s angle theory to identify the geometric relationship between time and price in the market.
- Strategies for EMA Ribbon Bearish Alignment: Dead Cat Bounce or Real Reversal — Deep dive into the EMA Ribbon to understand the battle between short-term and long-term capital.
- Bollinger Band: Long-Term Repricing Zone — The Ultimate Tool to Capture Massive Market Moves Tired of getting shaken out of winning trades too early? Or buying right before a trend reverses? An ex-banker reveals how to use the Bollinger Band to filter out market noise and ride the big waves.
- KDJ Stochastic Indicator Bottom Confirmation — What is the implication of a downward-curving KDJ? Understand in one article how to use dynamic indicators to catch market turning points.
【Disclaimer】 The content herein is for educational purposes and reflects the author’s personal opinion only; it is not investment advice. All financial investments, including cryptocurrencies, carry significant risk, and you could lose your entire capital. To support this site, this article may contain affiliate links. While we strive for accuracy, we cannot guarantee all information is complete or error-free. Please conduct your own research and be fully responsible for your own investment decisions.