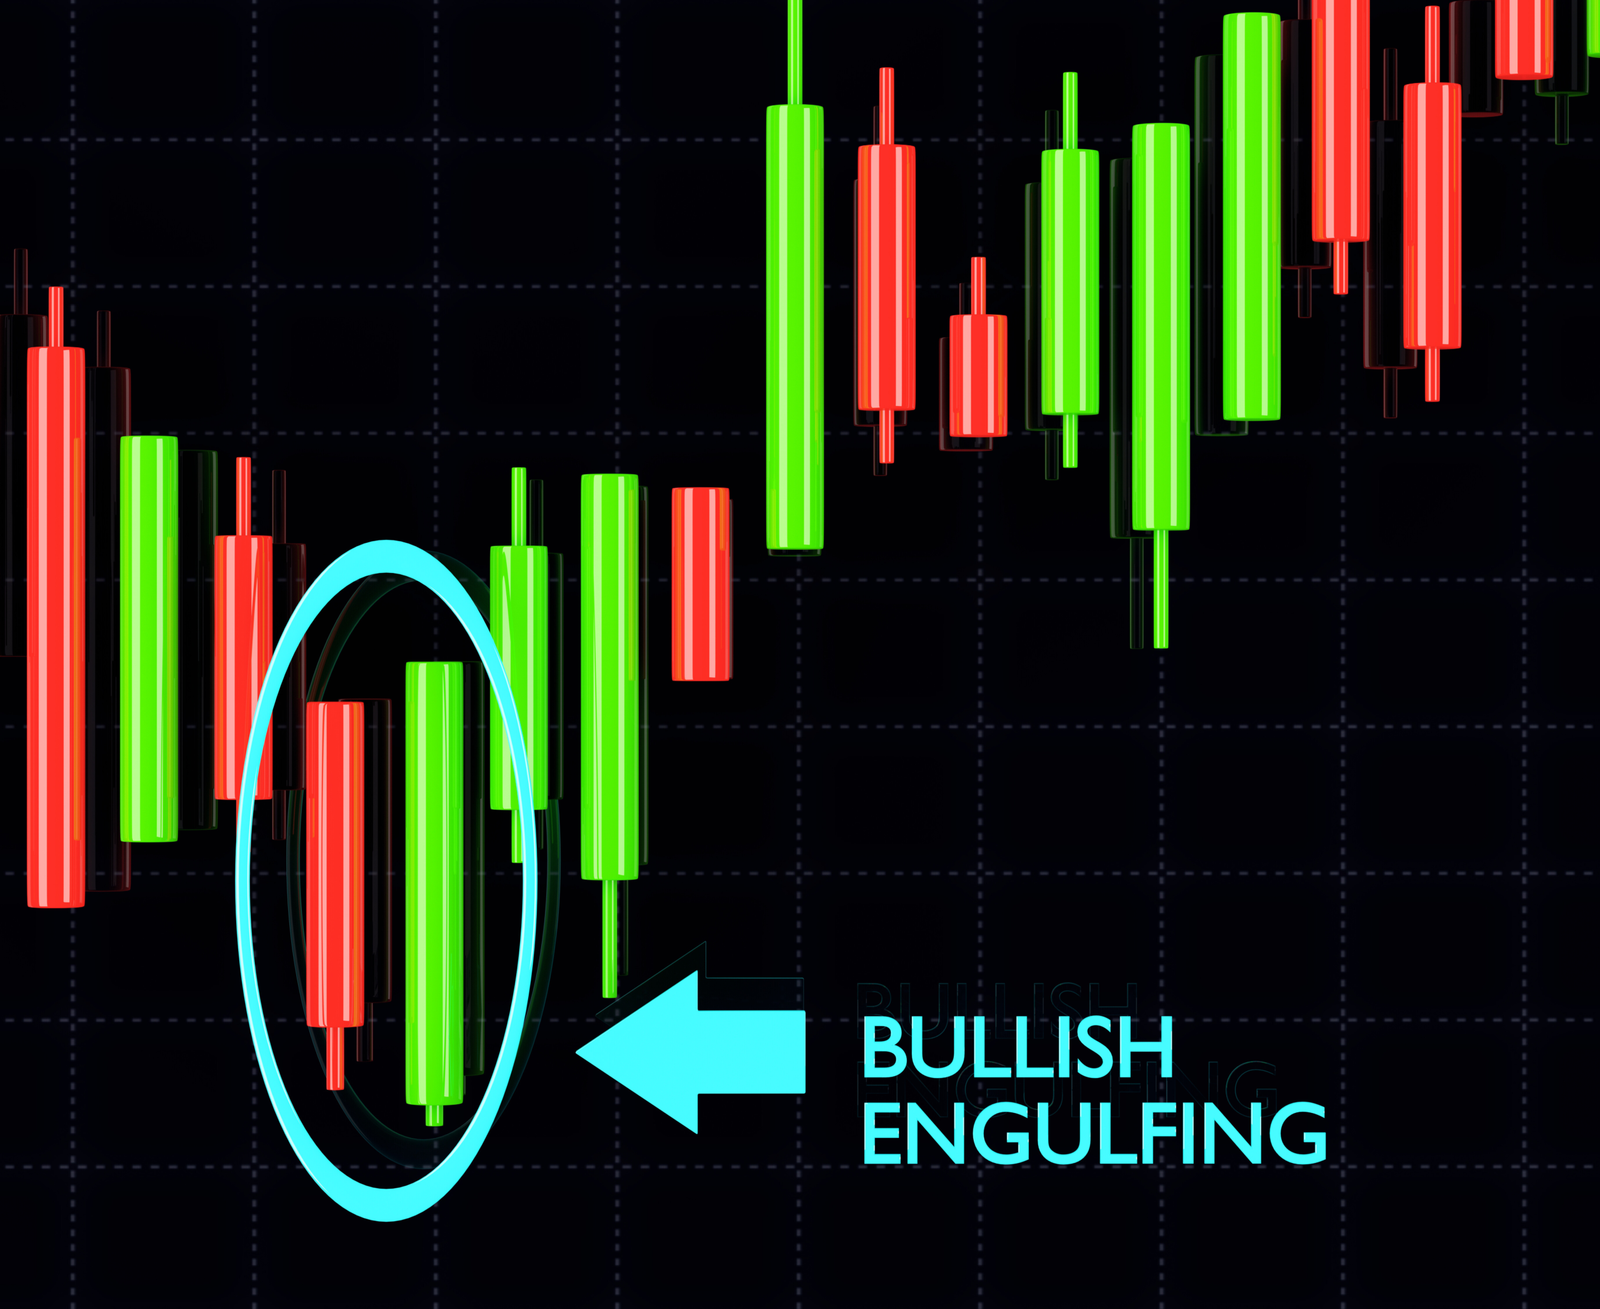
Fetching Live Market Data...
When you make a trade, you should have a clear target of where you expect to get out
William Delbert Gann – 1949
The uncomfortable truth is that SOL’s faster-chain narrative may be making the trade easier for professional sellers, not safer for late buyers.
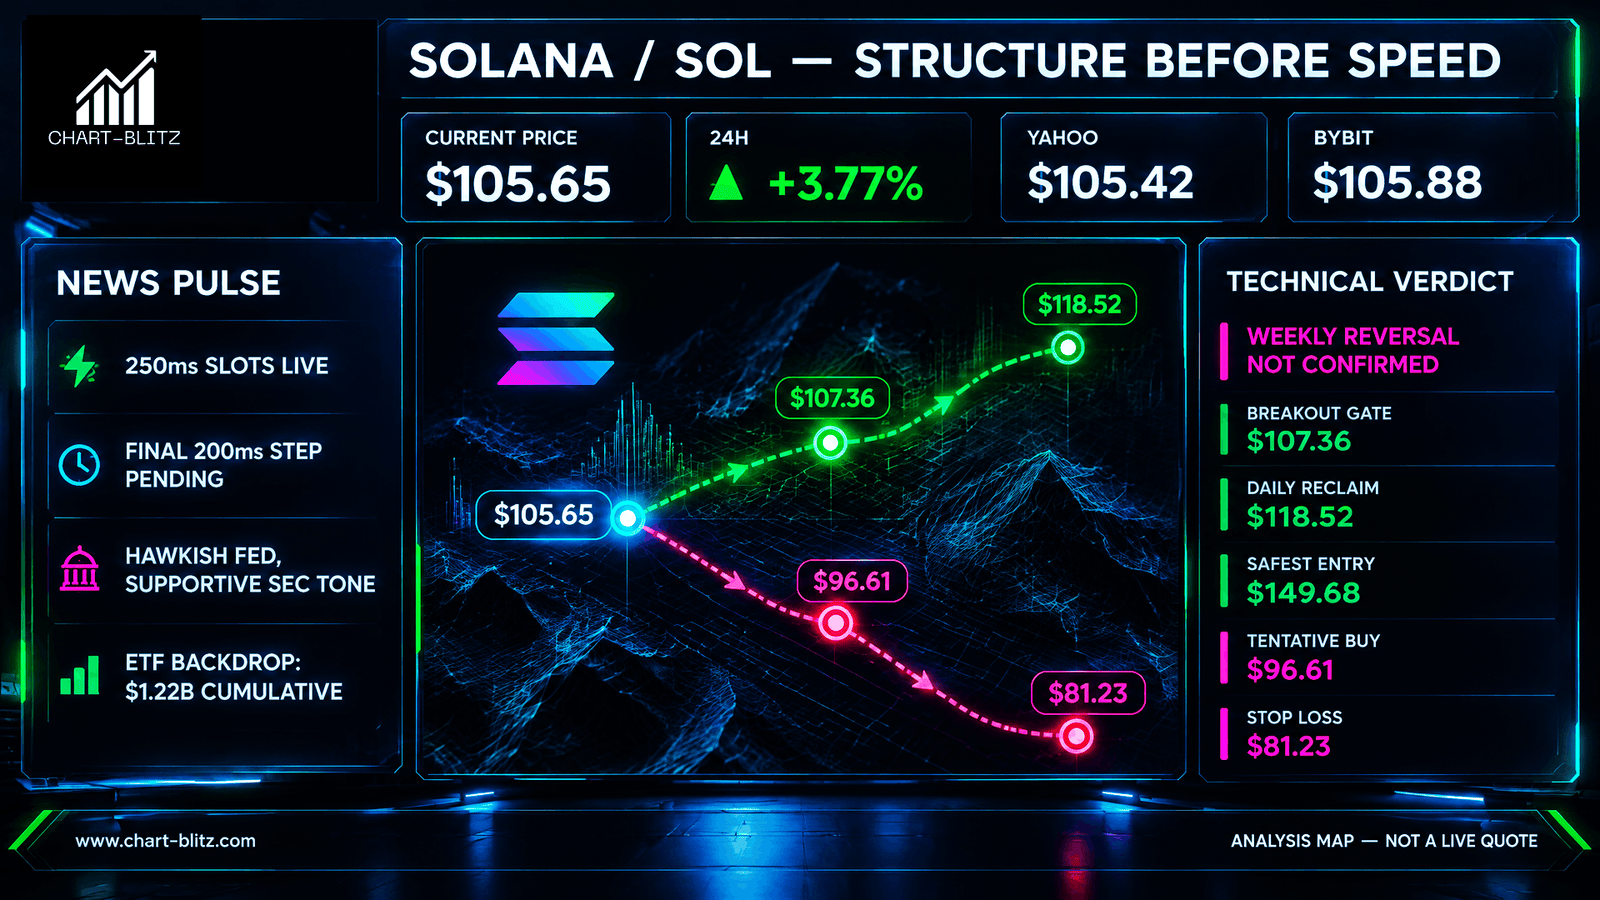
At 04:13 EST / 08:13 UTC, SOL/USD printed a working baseline of $105.65, calculated as the midpoint between Yahoo’s $105.42 quote and Bybit’s $105.88 quote. The spot price is cross-checked; the +3.77% 24H proxy is calculated from Yahoo’s prior-close field. The midpoint method reduces single-venue noise. Bybit did not expose a direct 24H token-return percentage in the available text; its +5.90% figure was a market-cap change, not token return.
That distinction matters because capital does not trade headlines in isolation; it trades where headlines meet liquidity. SOL is sitting near a pressure zone where enthusiastic buyers can confuse a positive percentage with trend confirmation. The retail misread is clean and dangerous: “green day plus fast network equals breakout.” Institutional desks usually see something colder: nearby resistance, obvious stop clusters, and a catalyst capable of attracting impatient flow. The price is not yet behaving like a fully confirmed reversal; it is behaving like a market daring traders to overstate the evidence. The sharper question is not whether SOL has a good story. It is whether enough capital will defend higher prices after the first excitement fades.
【📊Analysis Baseline Statement】
All technical analyses below are based on the price snapshot locked on September 18, 2026 (EST): 03:50 Solana (SOL) = $105.89 USD. Please treat this report as an “analytical map” rather than a real-time quote.
Faster Slots Fuel the Rally—But Don’t Confirm a Bull Market: Institutions Track Liquidity, Retail Chases Headlines
The fresh catalyst is mechanical before it is emotional: the 250ms slot step was expected at the epoch boundary around 05:01 UTC, and Anza verified at 05:06 UTC that ‘250ms slots [were] live on mainnet-beta,’ adding that the last stop is 200ms. The prior 350ms and 300ms stages were active, while 200ms remains pending. Official materials around SIMD-0525 describe a 400→350→300→250→200ms path; moving to 200ms would halve the four-slot leader window from 1.6 seconds to 800ms, potentially improving quote freshness and reducing stale-price exposure, while also doubling vote frequency and tightening validator timing requirements. The official caveat matters: lower slot time can improve latency and state freshness, but it does not by itself confirm a weekly trend reversal or automatically imply higher aggregate wall-clock transaction capacity. Operational effects at the fastest settings remain empirical mainnet questions.
That is the hook professional money cares about. Faster blocks can change execution rhythm, but they do not automatically validate direction. In a bank dealing room, this is like a venue cutting latency into a major fixing window: flow becomes livelier, quotes update faster, and sloppy orders become easier to locate. Nobody competent calls that a guaranteed bull market. Speed is liquidity fuel, not trend confirmation.
Macro and regulatory sentiment add color, not certainty. A Yahoo-hosted report noted SOL rebounding after a hawkish Fed setup and referenced SEC Chair comments about acting within statutory authority after the failed Clarity Act vote. That matters for mood, but mood is not a breakout.
Late-August background remains part of positioning memory: reports citing Farside placed cumulative US spot SOL ETF inflows at $1.22B, including $33.5M in one session and five consecutive inflow days, concentrated in Bitwise’s BSOL and uneven across the year. That is explicitly late-August background, not a 24H flow claim.
Longer-horizon context also includes the same reporting reference to July’s 4.2B transactions, up 13.5% month over month, compute limits rising from 60M to 100M units per block, and tokenized RWA at $3.73B. Those are meaningful ecosystem markers, but intraday they mainly explain why the crowd is willing to chase. Allocators may respect the infrastructure progress, short-term players monetize emotion, and institutions exploit the gap between a real catalyst and an unconfirmed chart. What if bullish news is best used not for instant buying, but for waiting until retail reveals its stops?
💡Four frames. One question: did it hold?
The Price and Timestamp above are the print this piece froze at the close of writing — not the tape now. Markets move; the copy does not. The only check that matters is whether that freeze still holds. Open Chart Grid: One name, Four frames, locked Weekly → Daily → Monthly → 4-Hour, the article’s print against the live chart. You do not pick timeframes, and you should not trust the headline. Hold or break: you decide.
📈 WEEKLY — Above $100 Is Only a Trial Rally—The Real Bull Test Lies at the $143–$150 Supply Wall
The weekly chart is the courtroom, and SOL is still on probation.
The Weekly MA Ribbon smooths longer-term trend pressure by layering moving averages into a visual band; when price rises into a curled but not fully expanded ribbon, the signal is often repair rather than regime change. VPFR, or Fixed Range Volume Profile, shows where visible historical trading activity clustered by price, helping identify acceptance corridors and thinner zones where movement can accelerate. Weekly MACD tracks momentum through the relationship between its fast and slow lines plus histogram; a turn up below zero can show waning downside force without proving a new bull phase. Dow labels describe the visible sequence of swing highs and lows, and that sequence remains the cleanest judge of trend status.
Weekly Timeframe for SOL (Solana)
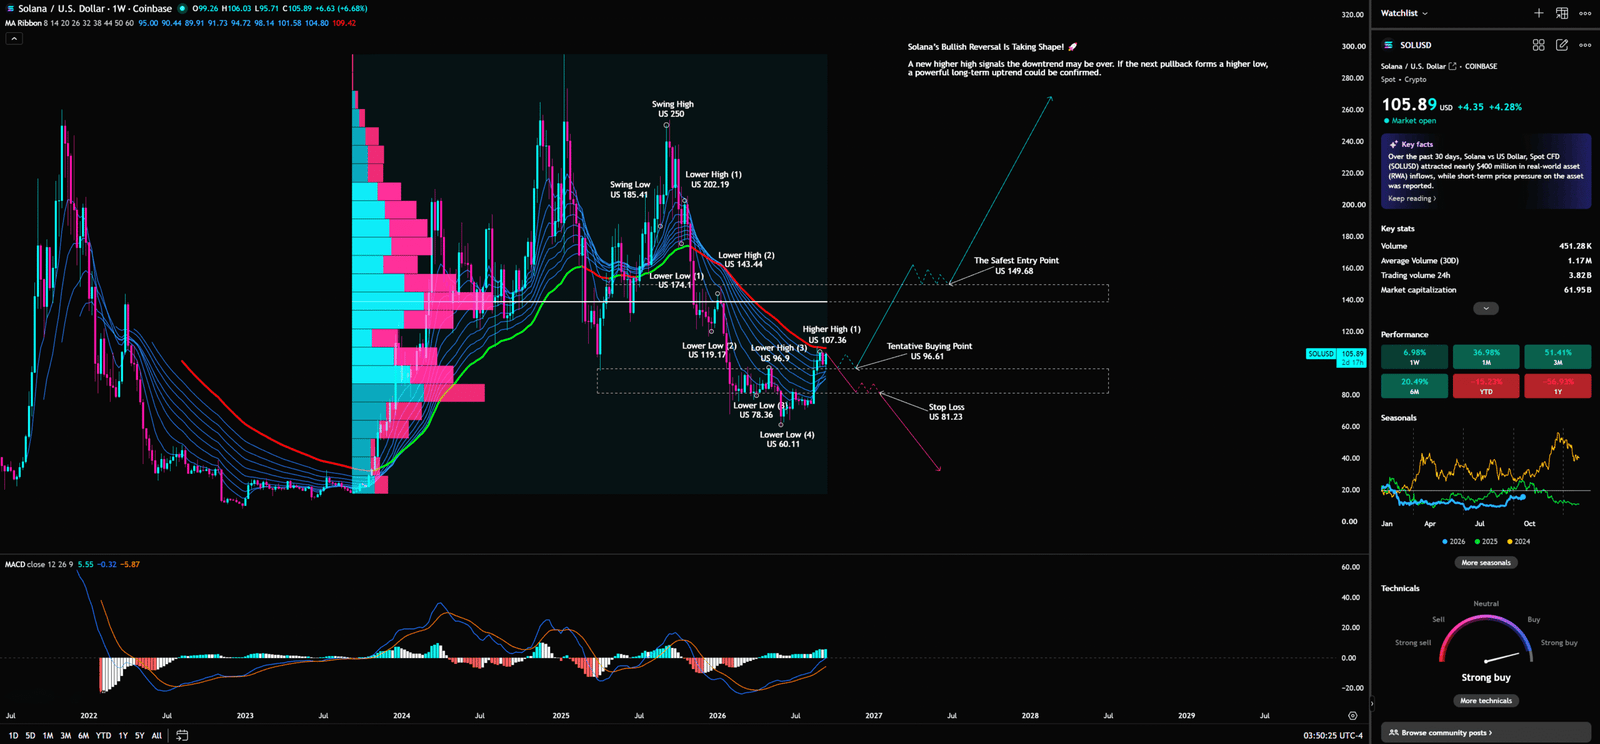
The Dow structure is not yet flattering. The visible sequence still shows lower highs and lower lows: Swing High $250; Swing Low $185.41; LH1 $202.19; LH2 $143.44; LL1 $119.17; Lower High (3) $107.36; LL $78.36; LL4 $60.11. That ledger says recovery is probationary until SOL prints a higher low and reclaims resistance with acceptance. It is not enough to poke through a level, ring the social-media bell, and call the downtrend dead. Dow structure still demands proof, not applause.
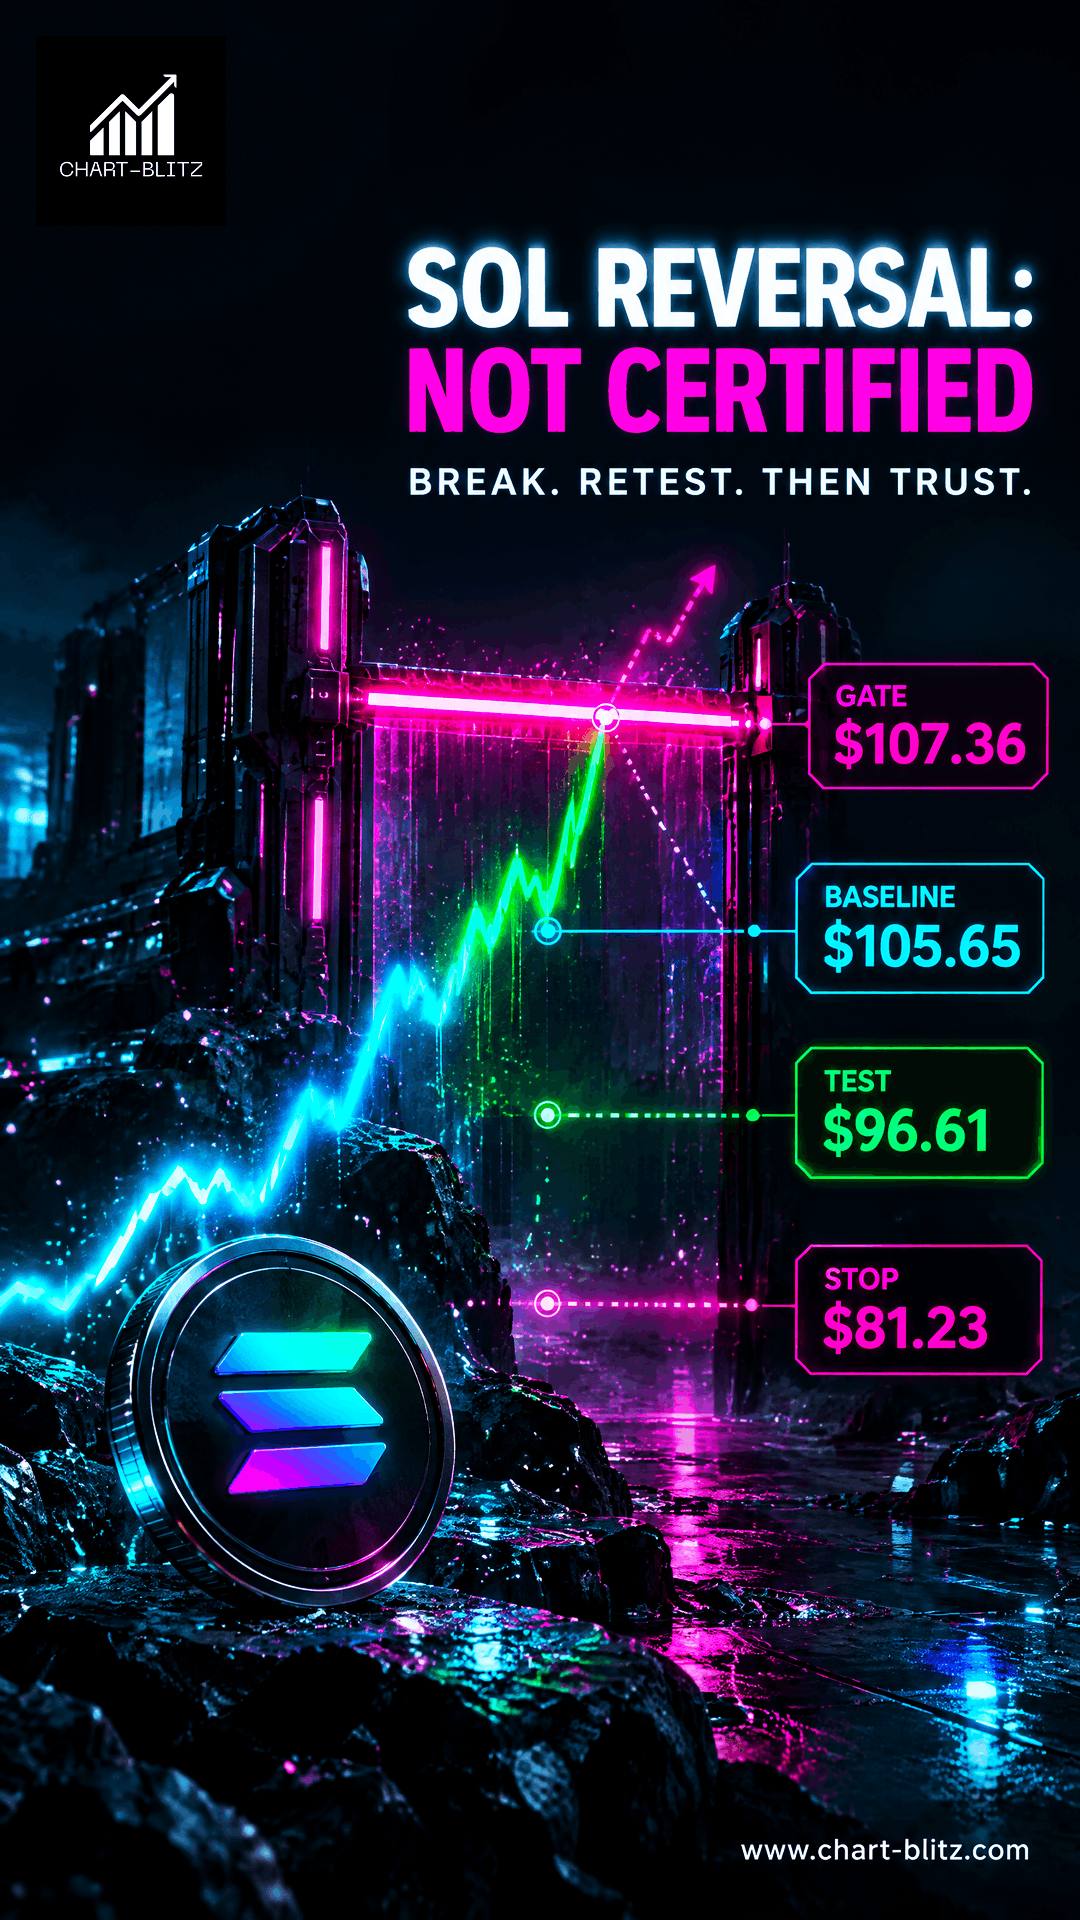
The key weekly map remains blunt. Safest Entry $149.68. Tentative Buying $96.61. Stop Loss $81.23. Lower High (3) $107.36 is the immediate structural challenge. Price near $105.65 is close enough to tempt breakout traders but not strong enough to erase the larger pattern. This is where capital behavior becomes tactical: larger accounts may let momentum buyers lift price into visible resistance, then test whether those buyers can defend the retest. Retail mistakes the first push for confirmation. Institutions prefer the second answer: what happens after the first push exhausts?
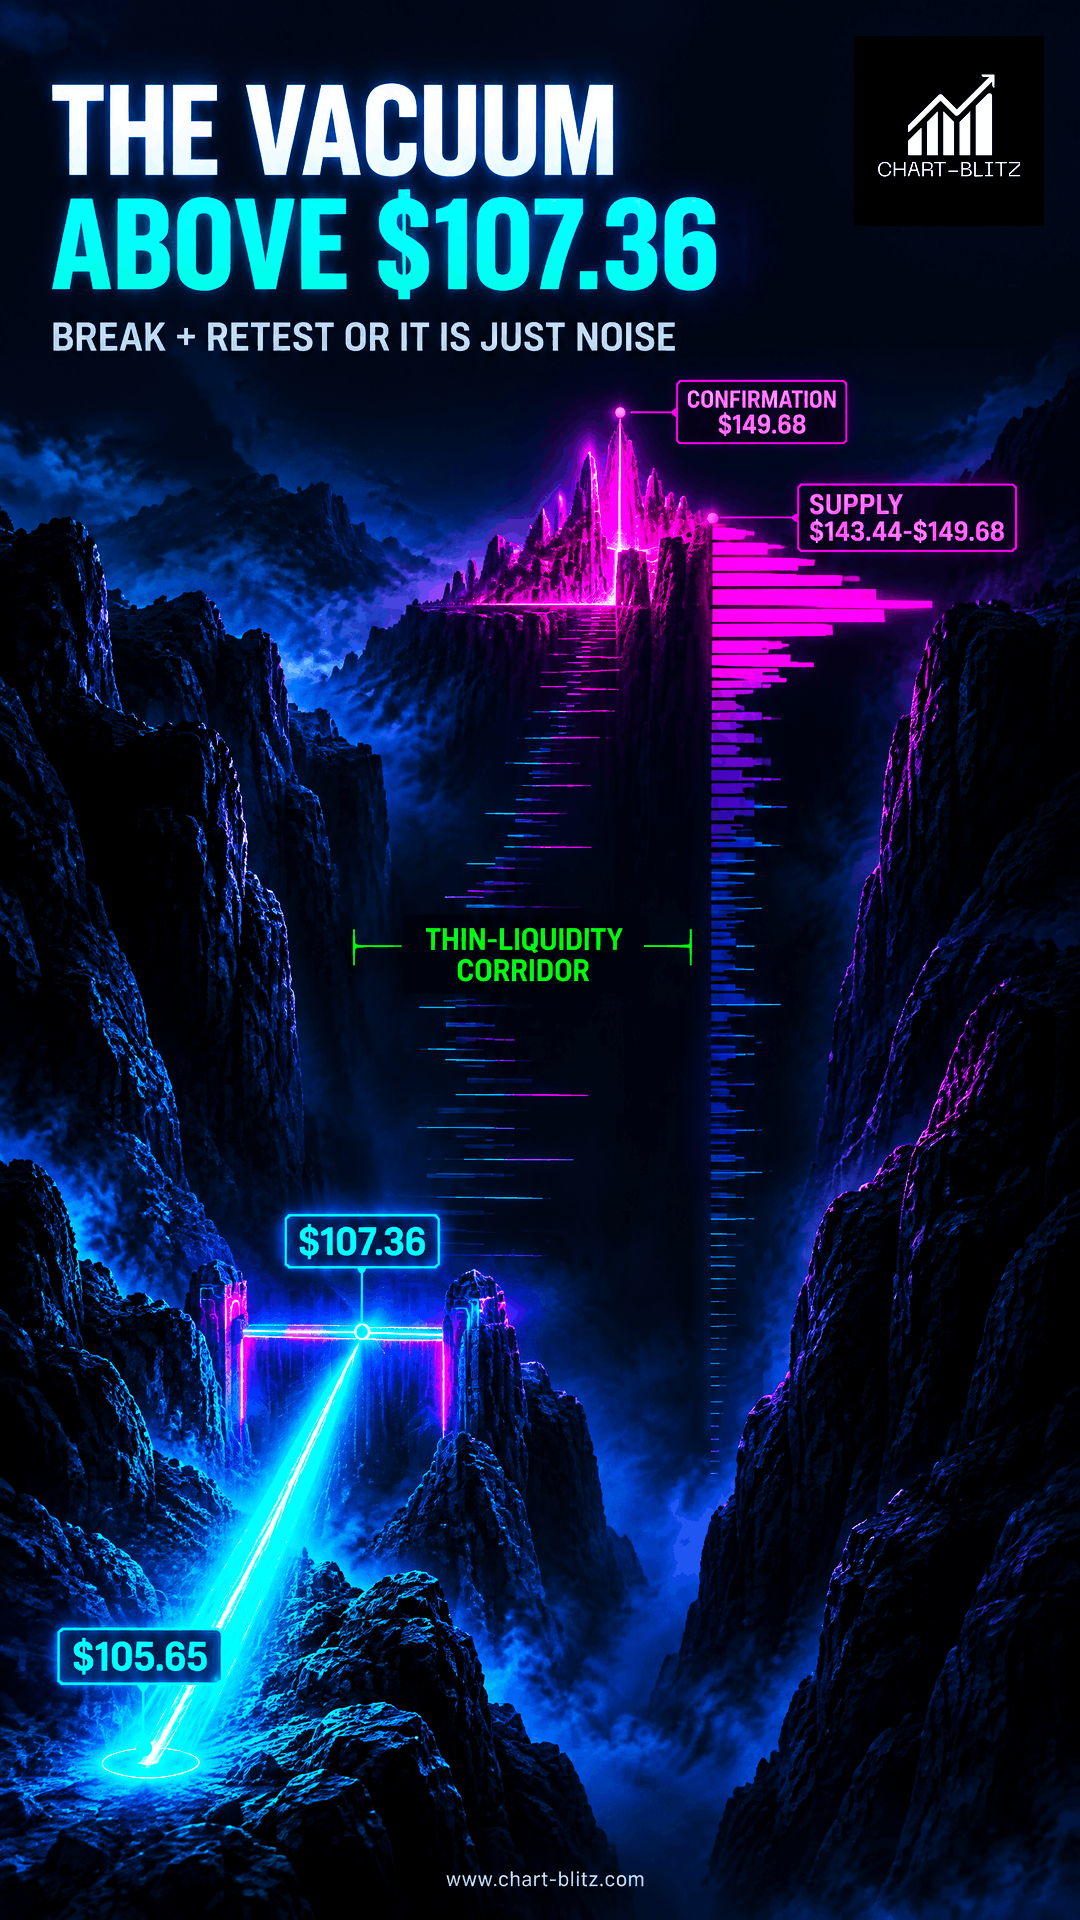
VPFR adds the cynical layer. The most important visible acceptance is in the mid-$140s, making $143.44-$149.68 a broad high-participation corridor rather than a magic print. If SOL clears $107.36 and then $118.52, the path can feel fast because thinner regions often allow momentum to travel. But the mid-$140s are not empty air; they are a warehouse. Prior business can become future supply, trapped buyers can reduce exposure, and institutions can distribute into optimistic demand. The retail label is “target.” The professional label is “inventory transfer.”
The Weekly MA Ribbon supports cautious improvement, not celebration. A curling ribbon beneath or around price can mark trend repair after an extended decline, yet an established regime usually needs price above the band, the band expanding, and pullbacks holding as higher lows. Until that happens, SOL remains a bounce candidate inside a theoretically larger downtrend not fully over. Capital may nibble; it will not usually pay any price. Retail sees a ribbon curl and buys. Institutions see it and ask where the first failed retest can be sold.
Weekly MACD strengthens that balanced reading. Momentum is improving from weaker territory, and downside pressure may be fading. But MACD improvement below or around the zero region is not the same as a decisive trend reset. In dealing-room language, this resembles a credit spread tightening after bad news has been priced, while the underlying balance sheet still has to prove cash-flow durability. Better tone, yes. Clean all-clear, no. Momentum repair is useful; structural confirmation is still missing.
Dow and Elliott discipline also prevent fantasy. Dow says visible lower highs/lower lows remain in force, and recovery stays probationary until a higher low and reclaimed resistance appear. No valid numbered Elliott count is visible, so none will be fabricated. Any future impulse must obey the wave-4 non-overlap rule with the wave-1 top; if that iron rule cannot be respected, the larger ABC correction hypothesis remains the safer educational guardrail. Retail often decorates uncertainty with labels; institutions monetize the confidence those labels create.
The weekly conclusion is sharp but not bearish for sport. Capital behavior is improving enough to make upside continuation possible, especially if $107.36 turns into support and $118.52 follows. The retail misread is assuming technical repair equals confirmed reversal. Institutional exploitation is likely to focus on stop runs around $107.36, retest failures, and later distribution if price reaches the high-volume corridor. Is SOL building a legitimate base above prior resistance, or advertising a better exit window for capital that bought lower?

📊 The Daily Rebound Isn’t Ashore Yet—The USD 107–119 Resistance Zone Awaits Impatient Buyers
The daily chart has energy, but it has not earned a blank cheque.
Daily Fibonacci retracement levels frame where traders often expect bounce validation, continuation, or failure; on this map, daily Fib $118.52/$152.21/$185.91/$227.61/$70.54 defines the major reference ladder. The Daily MA Ribbon captures short-to-intermediate trend alignment through clustered moving averages, while Daily MACD measures faster momentum shifts and is most useful when read against nearby resistance rather than treated as a standalone trigger.
Daily Timeframe for SOL (Solana)
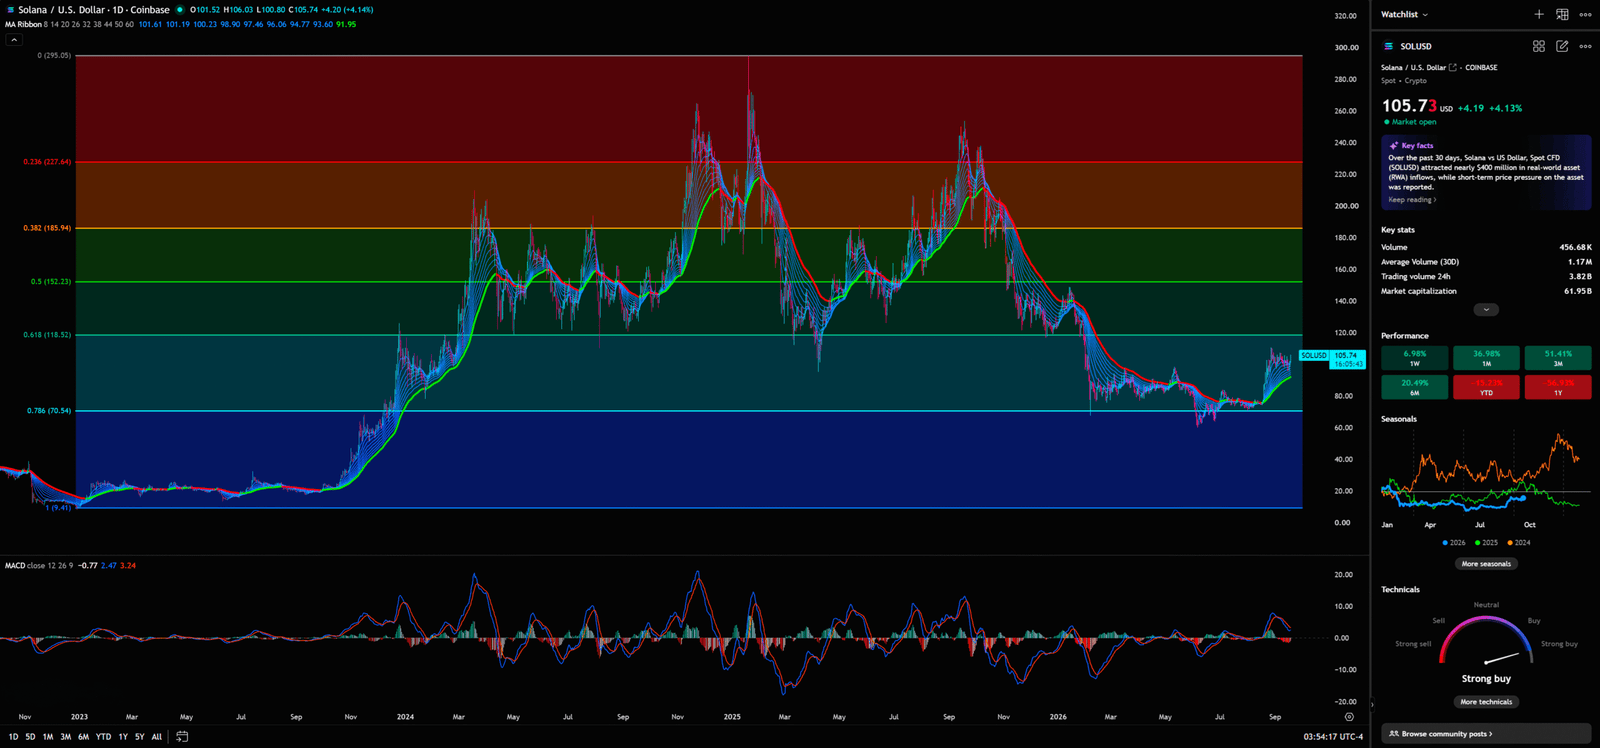
Price above $70.54 but below $118.52 places SOL in a recovery pocket, not a completed trend reversal. The first major daily test is $118.52. Above that, the next relevant ladder includes $152.21, $185.91, and $227.61, but those higher levels are not automatic magnets while the market remains under the first gate. The daily chart’s job is to confirm whether the weekly attempt has traction. Right now, it says repair is underway, but acceptance above immediate resistance still has to be proven. A bounce below $118.52 is still a candidate, not a conviction.
The Daily MA Ribbon is curling constructively, suggesting buyers have interrupted prior pressure. Yet it has not fully expanded into the mature alignment that usually supports confident trend-following. Capital behavior here is patient: stronger hands often buy retests only if price holds structure, while weaker hands buy the first green candle and wonder why the market retraces. Institutions can exploit this by allowing a push toward $118.52, fading the first failure, and forcing late longs back toward the $100-$103 region.
The major daily conclusion is conditional. Capital is not absent, but it is not yet reckless. Retail keeps buying intraday pushes under $118.52 as if the level has already been conquered. Institutional exploitation centers on making the market prove itself: defend resistance first, observe whether pullbacks hold, and only then consider whether the path to $143.44-$149.68 is tradable. Is $118.52 about to become a bridge to weekly supply, or simply the next wall wearing a bullish costume?
📉 A Monthly Recovery Isn’t a New Supercycle—Smart Money Waits, Retail Fears Missing Out
The monthly chart offers oxygen, not immortality. Is $94.57 a floor, or merely a ledge?
Monthly Bollinger Bands use a moving average and standard-deviation envelope to show long-term mean location and potential stretch; the middle band acts as a broad trend sanity check, while the upper band marks distant upside air. Monthly KDJ is a momentum oscillator built from K, D, and J lines, useful for spotting early turns from depressed areas while still requiring price confirmation.
Monthly Timeframe for SOL (Solana)
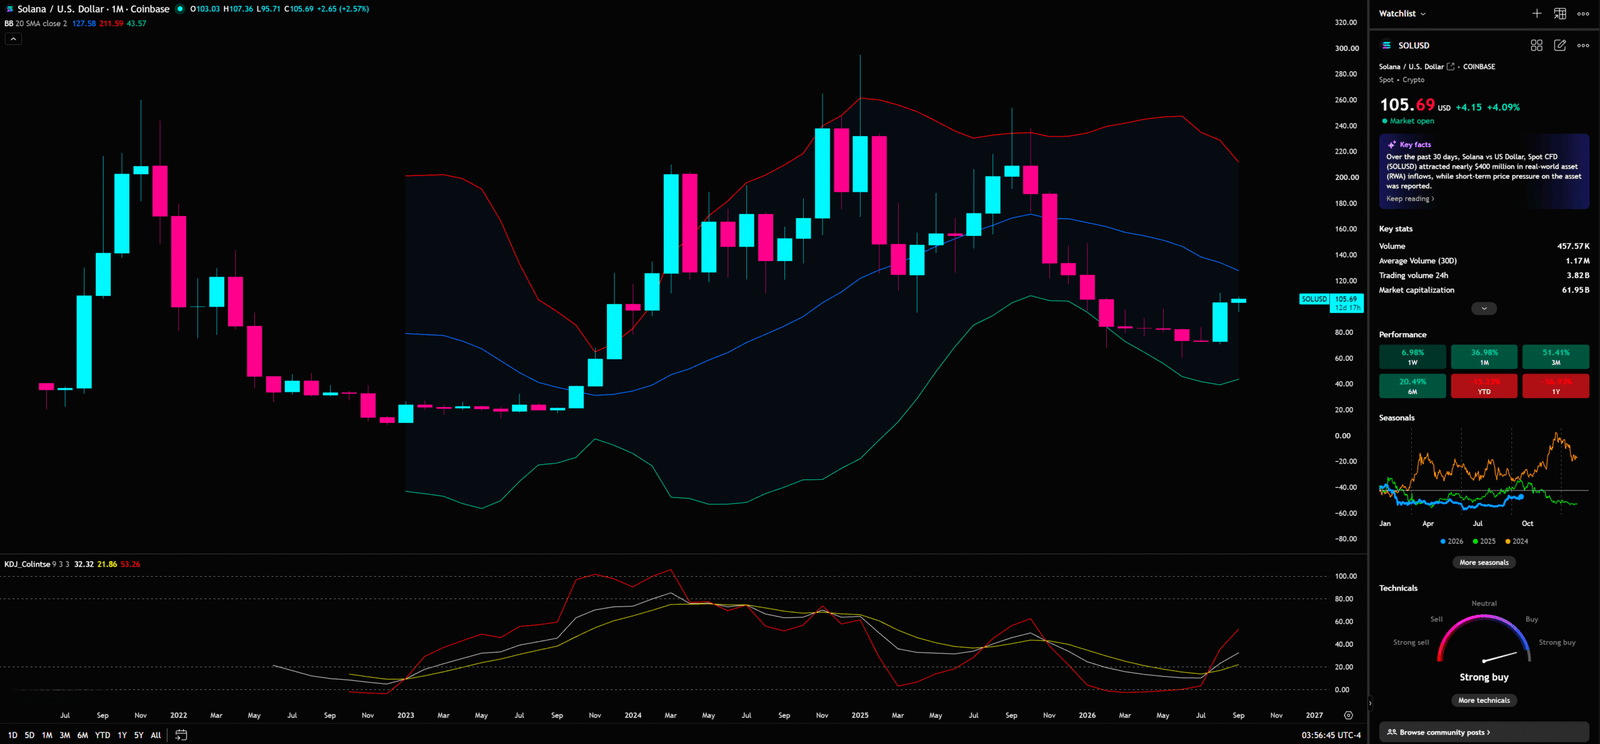
The important monthly references are clear: monthly BB middle about $94.57 and upper about $211.59, with KDJ about 32.32/21.86/51.26. Price above the middle band suggests SOL has lifted off the mat, but distance from the upper band says it is not yet stretched on this timeframe. KDJ turning up from low readings gives the chart a recovery pulse. That is constructive, but not a secular proof stamp. Monthly momentum is waking up; it has not signed a bull-market contract.
Capital behavior at this timeframe is deliberate. Longer-horizon accounts may treat the middle band near $94.57 as a sanity line: staying above it supports accumulation-on-weakness logic, while losing it would undermine confidence and reopen deeper downside references. Retail often overreads the J-line’s acceleration and imagines a straight shot toward the upper band near $211.59. Institutions usually break the path into gates: regain daily strength, clear weekly resistance, then test whether monthly upside has sponsorship.
📐 4-HOUR Holding $100 Isn’t a Win—Below the $106–$110 Ceiling, Bulls Risk Becoming Exit Liquidity
The 4-hour chart is where the trapdoor and the launchpad currently overlap.
The 4H MA Ribbon tracks near-term trend pressure with tighter sensitivity than the daily or weekly ribbons, often acting as a cradle for tactical pullbacks if a move is genuine. A Gann fan maps diagonal support and resistance tendencies; exact angle labels are not necessary here, only the visible diagonal confluence zones where price may react.
4-Hour Timeframe for SOL (Solana)
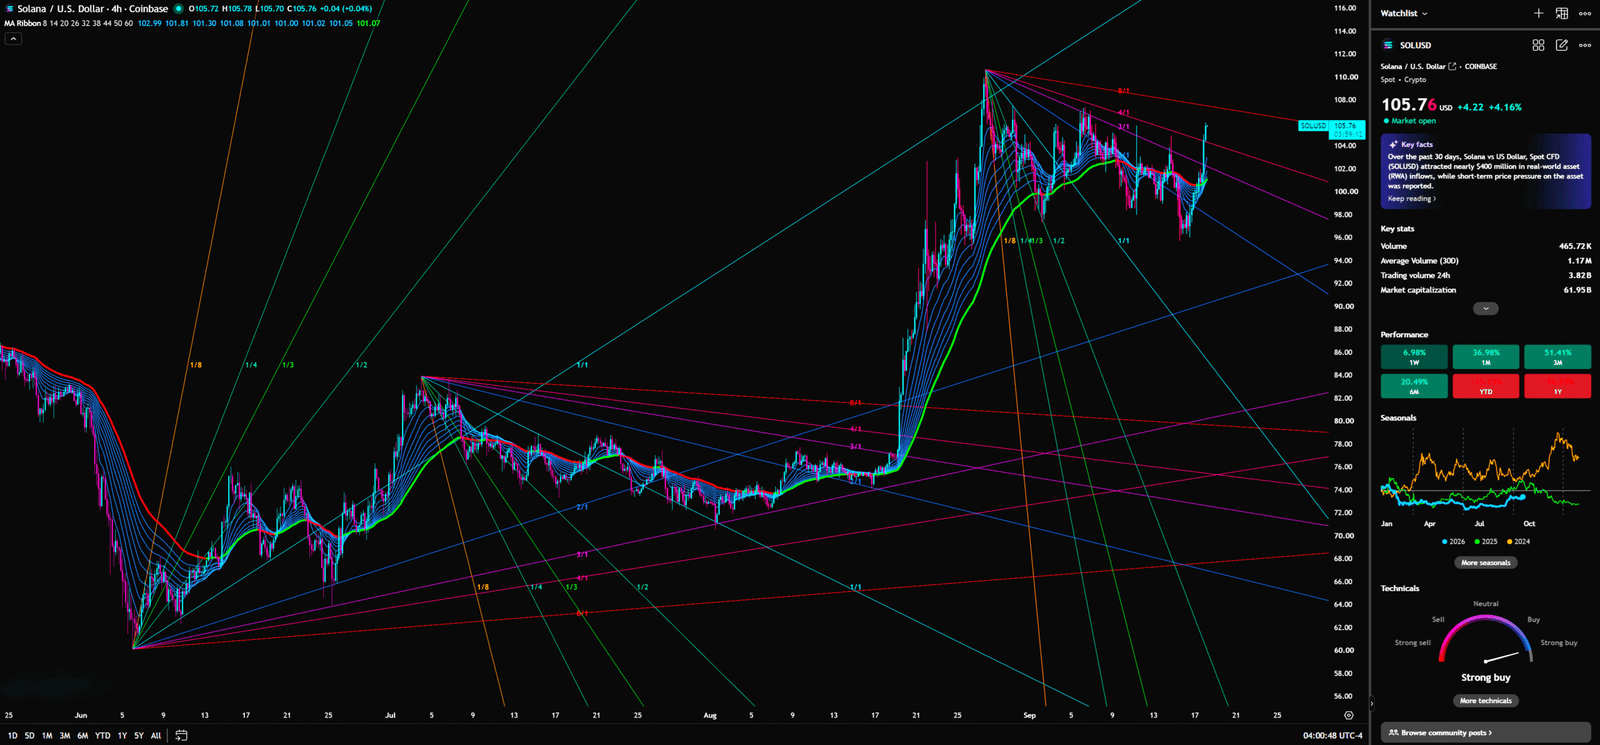
The immediate 4H map is concentrated: 4H ribbon $100-$103 and overhead $106-$110. Price above the ribbon supports tactical dip-buying logic, but the overhead zone is exactly where breakout systems, stop orders, and pre-positioned offers collide. That makes the setup tradable, but not clean. The $106-$110 area is not open sky; it is a professional liquidity checkpoint.
Capital behavior on this timeframe is fast and opportunistic. Algorithmic liquidity providers can fade laddered moves into $106-$110 while using $100-$103 as a risk reference. If price clears overhead and retests successfully, those same participants may flip from fading to trend-following. Retail commonly misreads a wick through $107 as full structural confirmation. Institutions demand closes, retests, and evidence that buyers remain active after the first stop run.
The Gann fan reinforces layered overhead rather than a simple breakout highway. A descending diagonal structure from the recent swing area near $110 creates confluence where price can stall even if the news tape is bullish. Supports below remain $100-$103 first, then Tentative Buying $96.61, with Stop Loss $81.23 as the hard invalidation on this educational map. Is the 4H ribbon supporting a real launch, or merely bouncing impatient traders into the next wall of supply?
Retail vs Institutions
Retail and institutions can stare at the same SOL chart and trade completely different markets.
Retail framing is usually linear: 250ms slot timing, green candles, social excitement, then a straight-line expectation toward $150. The focus narrows to the nearest breakout area around $107.36 and the overhead $106-$110 zone. Stops cluster just below obvious intraday supports, and entries arrive after the move has already become visible.
Institutional framing is colder: catalyst equals volatility supply. The map starts with $107.36 as the first structural trigger, $118.52 as the daily validation gate, and $143.44-$149.68 as the larger weekly acceptance/supply corridor. The theoretically larger downtrend is not fully over; if a sharp reversal breaks resistance and holds retest, conditional entry logic becomes rational, but if price reaches stop-loss, exit. That is an educational, unsubmitted framework, never a transaction instruction.
The dealing-room analogy is an interbank desk around a major data release. The first move clears stops and discovers price; the serious trade often appears only after spreads normalize and retests expose who is trapped. Professionals buy or sell the retest; tourists buy the headline. Which side of the book is being paid for patience, and which side is volunteering liquidity?
🎯Bull, Bear, or Range—Unplanned Money Always Becomes Market Fuel
Which path would trap the most impatient capital?
- Bullish path: $107.36 → $118.52 → $143.44-$149.68 → $152.21.
This path requires SOL to break and hold above Lower High (3) $107.36, then prove the move by reaching and accepting above $118.52. If that happens, the thinner route toward the weekly $143.44-$149.68 corridor becomes more plausible, with $152.21 as the next measured daily reference. Capital behavior would shift from tactical repair to cautious trend participation. Retail may chase late; institutions would likely prefer retests and staged distribution into the corridor. - Bearish path: loss $100-$103, failure $96.61, hard stop/invalidation $81.23, deeper $70.54.
If SOL loses the 4H ribbon $100-$103, then fails Tentative Buying $96.61, the recovery structure weakens sharply. Stop Loss $81.23 becomes the hard invalidation level on this map, and $70.54 is the deeper Fibonacci reference. Retail may keep averaging down because the news still sounds positive. Institutions generally exploit that stubbornness by forcing liquidation into obvious lower liquidity zones. - Neutral path: $96.61-$107.36 or broader $96.61-$118.52.
A neutral market would chop between Tentative Buying $96.61 and Lower High (3) $107.36, or broaden into $96.61-$118.52 while traders digest the 250ms step and speculate about the pending 200ms target. This is the range where retail overtrades and institutions collect spread, fade extremes, and wait for a decisive close. Is indecision a pause before expansion, or the market quietly draining impatient accounts?
♟️ Enter on Confirmation, Exit with Discipline—Great Traders Control Risk, Not the Market
Can the trade survive being wrong?
This plan is educational, manual, and unsubmitted. It is not personalized advice, not a transaction instruction, and not a promise of gains.
- Breakout-retest setup:
If price breaks $107.36, the educational trigger is not the first spike. Cleaner logic waits for a retest that holds above $107.36. If resistance becomes support, conditional entry becomes rational within a pre-planned risk framework. If the retest fails, no FOMO chase is justified. - Tentative-buy test:
Tentative Buying $96.61 is a possible test level, not a heroic catch-the-knife invitation. If price flushes into $96.61, stabilization matters: watch whether price reclaims the 4H ribbon $100-$103 and whether closes improve. Retail often buys panic because the level is visible; institutions often wait until forced selling is complete. - Stop logic and invalidation:
Stop Loss $81.23 is the hard invalidation level for this recovery map. If price reaches stop-loss, exit. Arguing with the stop because the catalyst still sounds exciting is how small losses become expensive tuition. The market does not care how elegant the thesis sounded before invalidation. - Re-entry discipline:
After a failed breakout above $107.36, re-entry logic should wait for either a reclaim and successful retest of that level or a deeper washout toward $96.61 with stabilization. Mid-range revenge trades between obvious levels usually pay the spread to someone more patient. - Staged targets:
The first staged target is $118.52. If price accepts above it, the next major zone is $143.44-$149.68, where partial exits or risk reduction become educationally sensible because prior volume acceptance can invite two-way trade. $152.21 is the next measured reference after that corridor begins to resolve. - Close confirmation:
Tactical decisions should respect 4H closes; structural claims should respect weekly closes. Wicks can be engineered by stop-hunting flow. Closes show whether capital stayed after the easy liquidity was taken. - Risk sizing and slippage:
Position size must account for volatility around $106-$110, $118.52, and headline windows linked to 250ms/200ms discussion. If the plan requires a perfect fill to survive, the sizing is too large. No FOMO entry should override predefined maximum risk. - S/R Flip rule:
Theoretically, the larger downtrend is not fully over; if a sharp reversal breaks resistance and holds on retest, a conditional entry is rational. If price reaches the stop-loss, exit. This is educational and unsubmitted, not a transaction instruction.
I will continue to closely monitor the price action of this Crypto. As soon as a critical reversal signal appears on the charts, I will update my analysis and insights right here immediately. Remember to Bookmark this page and come back often to check for the latest updates!
Want to see our full, interactive chart breakdown? If you want to learn how to draw weekly VPFR, Fibonacci, EMA Ribbon, MACD, Supertrend, and S/R Flip frameworks designed for real trading decisions. Please browse the following『Further Reading』links. Fundamental news tells you what happened. Technical analysis predicts what will happen. To master the professional framework that separates market signal from noise, explore our exclusive models at https://www.chart-blitz.com/fxcx-app/omni-chart.html?symbol=SOL.
📚Further Reading:
To help everyone gain a deeper understanding of the various technical indicators mentioned in this article, we have specially prepared the following further reading materials. These cover key analytical tools found across the weekly, daily, monthly, and 4-hour charts.
- Decoding Fibonacci Retracement: The Perfect Blend of Natural Law and Market Psychology — Fibonacci Retracement is not just a set of magical numbers; it is a manifestation of market psychology. Learning how to correctly draw and interpret Fibonacci levels is a required course for every serious trader.
- Is a Major Move Hiding in Plain Sight? Dow Theory May Already Know the Answer — As retail traders continue to chase short-term signals, experienced market readers are looking deeper — into trend structure, volume behavior, and market phases that may expose the early clues of a coming breakout.
- Understanding VPFR: Finding the Hidden Footprints of Market Makers — The Volume Profile Fixed Range (VPFR) is a powerful tool that tells us where the most trading occurred within a specific price range. This helps us identify true support and resistance levels, as well as potential ‘Vacuum Zones’.
- S/R Flip Support and Resistance Swap Strategy — S/R Flip is one of the most powerful concepts in technical analysis. This article uses real cases to teach you how to use S/R Flip to capture the highest win-rate trading opportunities.
- MACD Momentum Indicator Momentum First — What Does the MACD Line Crossing Above Zero Mean? Golden Cross & Divergence Signals!
- Gann Fan Masterclass — Deep dive into W.D. Gann’s angle theory to identify the geometric relationship between time and price in the market.
- Strategies for EMA Ribbon Bearish Alignment: Dead Cat Bounce or Real Reversal — Deep dive into the EMA Ribbon to understand the battle between short-term and long-term capital.
- Bollinger Band: Long-Term Repricing Zone — The Ultimate Tool to Capture Massive Market Moves Tired of getting shaken out of winning trades too early? Or buying right before a trend reverses? An ex-banker reveals how to use the Bollinger Band to filter out market noise and ride the big waves.
- KDJ Stochastic Indicator Bottom Confirmation — What is the implication of a downward-curving KDJ? Understand in one article how to use dynamic indicators to catch market turning points.
【Disclaimer】 The content herein is for educational purposes and reflects the author’s personal opinion only; it is not investment advice. All financial investments, including cryptocurrencies, carry significant risk, and you could lose your entire capital. To support this site, this article may contain affiliate links. While we strive for accuracy, we cannot guarantee all information is complete or error-free. Please conduct your own research and be fully responsible for your own investment decisions.