Fetching Live Market Data...
When you make a trade, you should have a clear target of where you expect to get out
William Delbert Gann – 1949
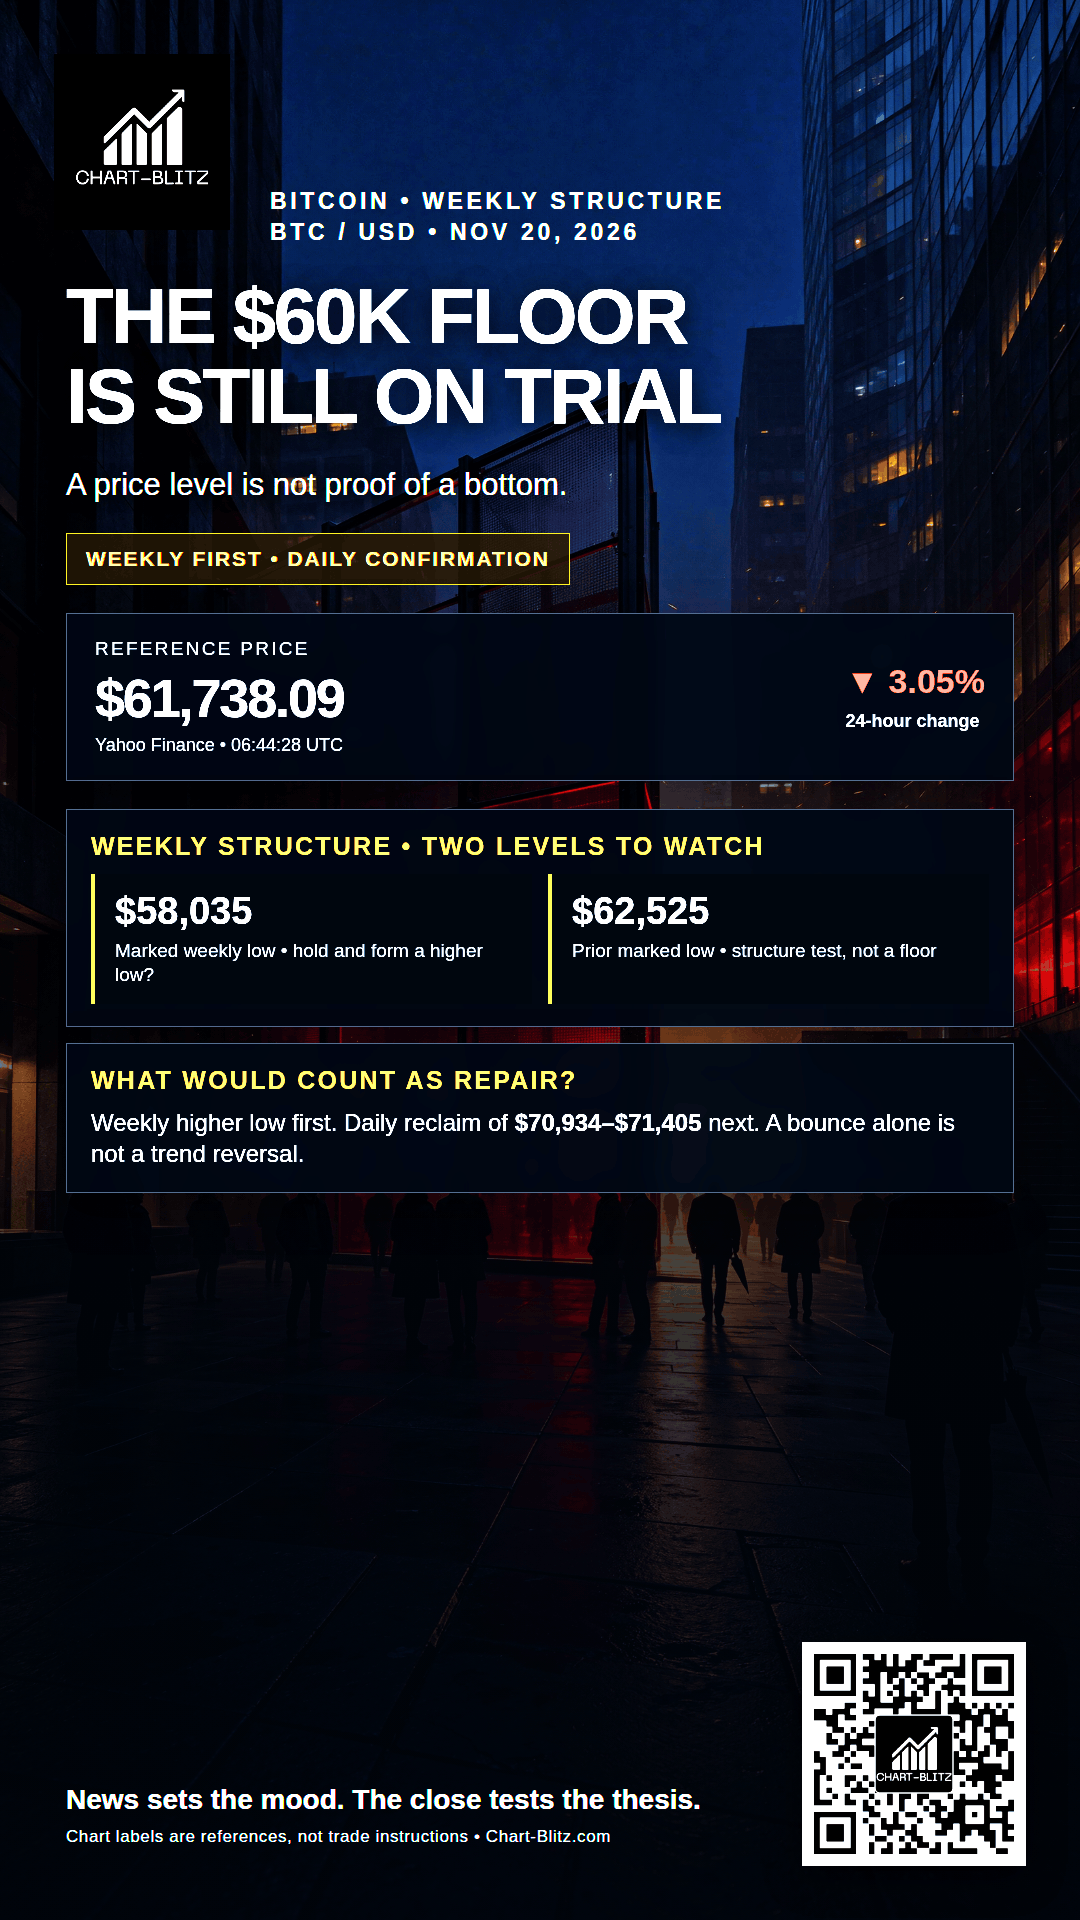
🚨A market does not issue a bottom certificate because the decline feels painful. Bitcoin can look “cheap” near $61,000 and remain structurally weak. The question is whether buyers defend a low, form a higher low, then reclaim the prior reaction area. Calling the first green candle a bottom resembles a bank relabeling an overdue loan a “temporary liquidity event”: calmer language does not remove risk.
🧭 Fear can be real while the popular conclusion is wrong
Retreating price, weaker ETF-demand headlines and traditional risk pressure can prompt exposure reviews, but cannot draw a confirmed bottom. A bank risk desk checks exposure, collateral and gaps; it does not assume the loudest headline explains the next trade.
“Capital behavior” means a reported ETF-flow fact or a labeled interpretation of price structure. A chart does not prove institutional accumulation, distribution, stop-hunting or coordination. No order-flow tape, participant positioning or intent data were supplied. Reported outflows and risk-off conditions fit a bearish narrative, but weekly structure is unrepaired and monthly price confirms neither reversal nor lower-band breakdown. Sentiment explains concern; closes show whether resistance changed sides.
【📊Analysis Baseline Statement】
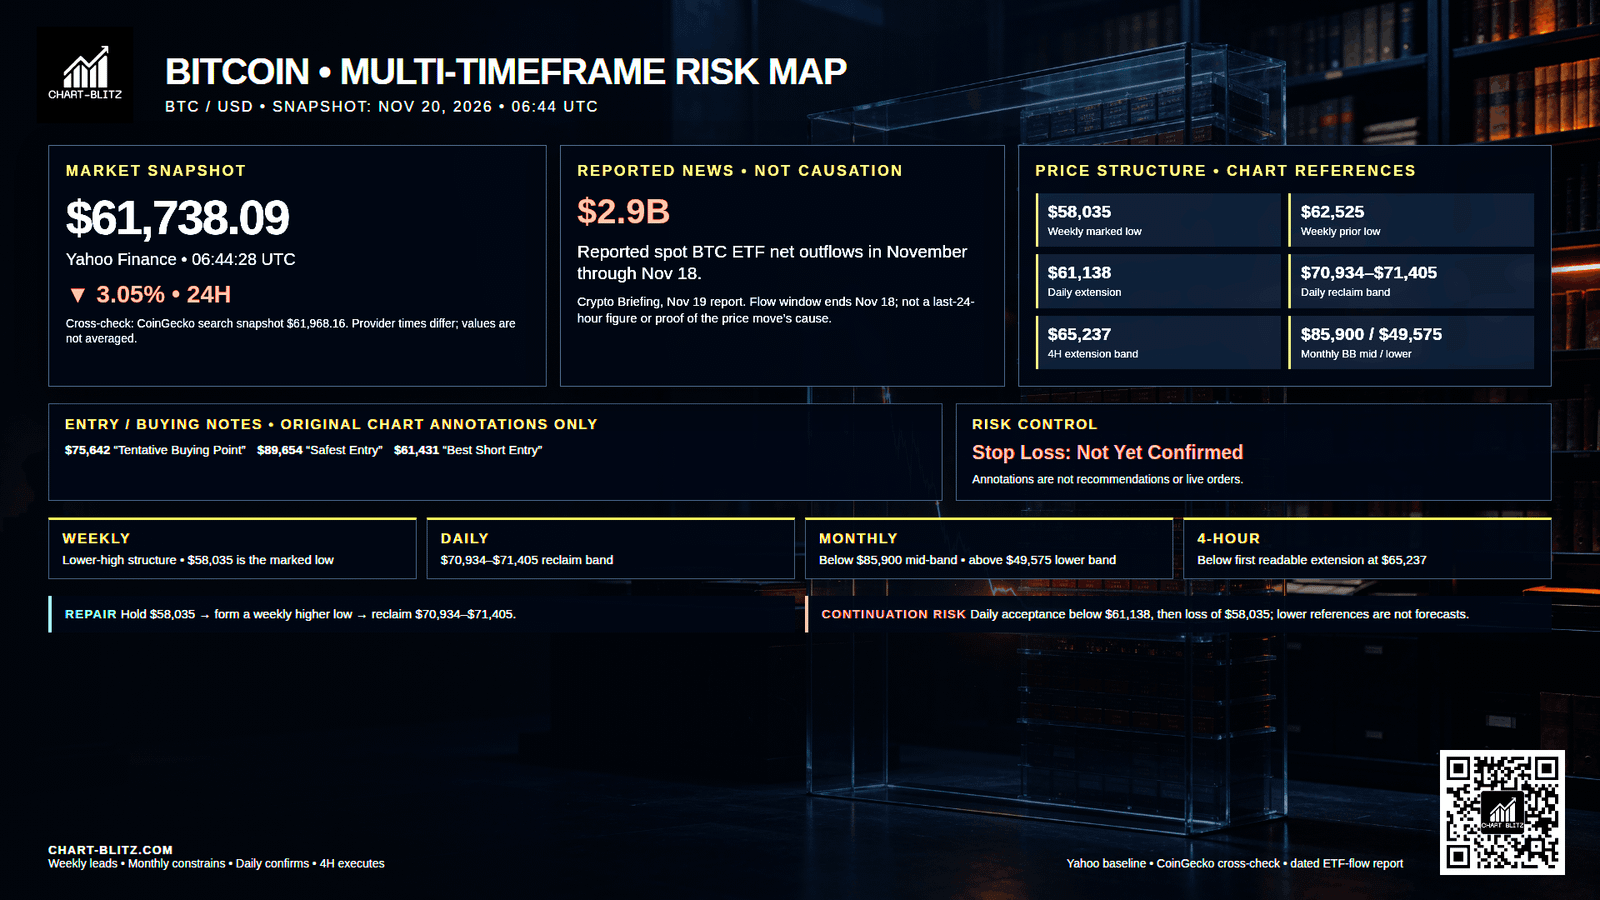
All technical analyses below are based on the price snapshot locked on November 20, 2026 (EST): 01:05 Bitcoin (BTC) = $61,761 USD. Please treat this report is an analytical map, not a live executable quote. Fragmented crypto venues can differ by a few dollars; every decision must be checked against the same venue and a completed candle before action is considered.
💡Four frames. One question: did it hold?
The Price and Timestamp above are the print this piece froze at the close of writing — not the tape now. Markets move; the copy does not. The only check that matters is whether that freeze still holds. Open Chart Grid: One name, Four frames, locked Weekly → Daily → Monthly → 4-Hour, the article’s print against the live chart. You do not pick timeframes, and you should not trust the headline. Hold or break: you decide.
📰 News analysis — ETF outflows are a pressure point, not a causal verdict
A Crypto Briefing report published Nov. 19 said U.S. spot Bitcoin ETFs had roughly $2.9 billion of net outflows in November through Nov. 18, including $239.9 million on Nov. 17 and $306.4–$306.5 million on Nov. 18. It said IBIT accounted for roughly 83%–87% of November outflows and aggregate ETF net assets were near $77.7 billion, a three-month low. The report also cited weak equities, rate-hike fears and asset sales by miners including Riot and MARA as they developed AI infrastructure. These figures and explanations are attributed to the report, not an independently verified live-flow feed.
“November through Nov. 18” is not “the last 24 hours” and cannot be added mechanically to a separate year-to-date figure. CoinDesk’s Nov. 19 Daybook likewise described nearly $2.9 billion in outflows this month versus about $500 million in October. It quoted Wintermute’s view that flows across ETFs, digital-asset treasuries, retail and institutions were flat to down, and said a 25-basis-point Federal Reserve rate increase the following month was widely expected. That is a newsletter’s account and analyst opinion—not an official Fed decision or proof of ETF causality.
Capital behavior: reports describe weakness in one demand channel over a stated period, not every seller or motive. Retail misread: “ETF outflows” becomes “every large holder is selling.” Institutional scenario: a risk desk might treat reports as one observation and seek spot depth, futures basis, funding and price-acceptance evidence before changing exposure. Those datasets are not supplied, so no confirmed institutional direction follows. The Anthropic IPO was described as competing for capital and attention; blaming Bitcoin’s entire move on it would be a headline, not a complete causal model.
📅 Weekly chart analysis — $58,035 is a structural test; $75,642 is not a return guarantee
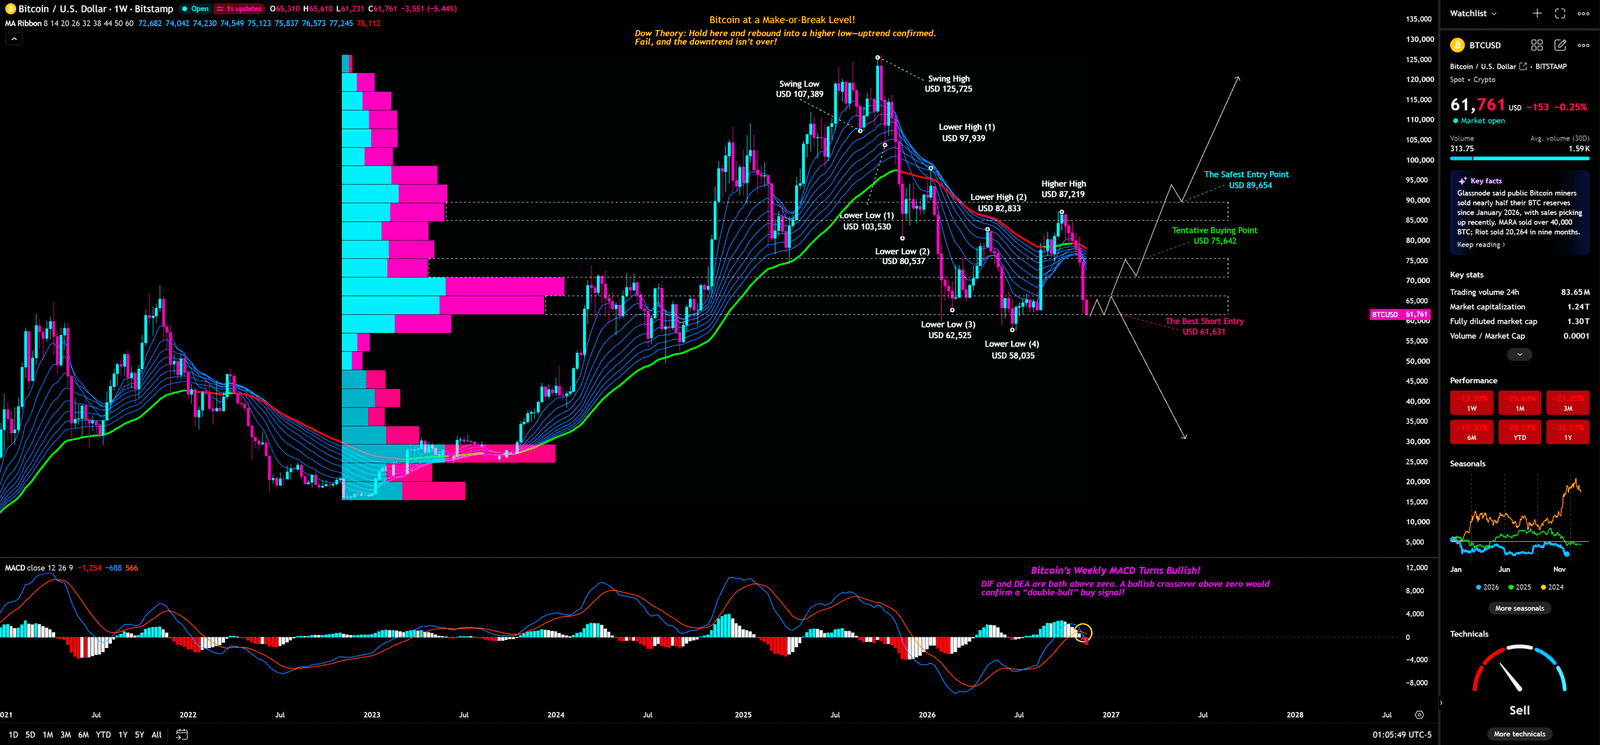
Dow Theory studies successive swing highs and lows: rising peaks and troughs support an uptrend; lower peaks and troughs support a downtrend. Manual labels show swing low $107,389, swing high $125,725, lower highs $97,939 and $82,833, a mark described as a higher high at $87,219, and lower lows $80,537, $62,525 and $58,035. No clean sequence proves reversal after $87,219. Holding and rebounding into a higher low would support confirmation; failing to hold means the downtrend is not over. A higher low is only a first gate; price must also be assessed against the prior reaction high.
Weekly Timeframe for BTC (Bitcoin)
Capital behavior: price tests supply and demand; accumulation is not observable. Retail misread: one sharp bounce means a new bull market. Institutional scenario: a larger risk desk might monitor $58,035 and the next reaction high for acceptance at higher levels; this is a framework, not evidence of intent.
An MA Ribbon groups moving averages to show slope, compression and dynamic friction; it is a zone, not a magic line. Weekly price is below and close to a ribbon still curling down, leaving overhead average-price areas to repair. Capital behavior: buyers have not proved they can turn it into support. Retail misread: one green candle is called a ribbon reversal. Institutional scenario: a risk manager might wait for a closing-price reclaim and retest rather than chase. Averages lag and whipsaw; they are a thermometer, not a judge.
A Fixed Range Volume Profile (VPFR) distributes activity horizontally by price over a selected range. High-volume nodes can show where price spent more time; low-volume nodes may mark faster-travel areas. The screenshot shows a profile, but no precise POC, VAH, VAL or readable LVN boundary is clear; no exact “vacuum-zone target” is defensible. Capital behavior: some bands attracted activity; this does not prove a live bid waits there. Retail misread: the longest bar is an invincible floor, or a sparse patch a guaranteed air pocket. Institutional scenario: a desk might observe acceptance or rejection near a legible node; positive news meeting supply could provide exit liquidity for holders, but does not prove a deliberate trap. Missing labels mean restraint, not invention.
MACD compares faster and slower exponential moving averages; DIF and DEA are read by crossover and position relative to zero. The annotation says both lines are above zero and a bullish crossover above zero would confirm a “double-bull” signal; no confirmed weekly MACD crossover is shown. Capital behavior: above-zero averages have not fully turned negative although price structure is weak. Retail misread: “potential double-bull” becomes “confirmed buy.” Institutional scenario: a portfolio manager might require a completed crossover plus price reclaim before upgrading the thesis. MACD lags and cannot overrule price. No exact Elliott Wave count is marked. If a proposed Wave 4 overlaps the Wave 1 top, that five-wave interpretation fails; an unmarked count is not evidence.
Three annotations are not instructions: $89,654, “The Safest Entry Point”; $75,642, “Tentative Buying Point”; $61,431, “The Best Short Entry.” They are author markings, not exchange orders, verified signals or recommendations. The $61,431 label is near the $61,738.09 baseline, but proximity is not confirmation. A chart label copied without a completed break and retest is not a signal..

📐 Daily chart analysis — The $61,138 extension is a test, not an automatic floor
Fibonacci retracement divides a selected swing into proportional references; a trend-based Fibonacci extension projects ratios beyond a selected move. The daily retracement spans approximately $18,682 to $126,390, marking $100,213 (0.236), $84,077 (0.382), $70,934 (0.5), $57,647 (0.618) and $39,214 (0.786). A separate extension uses a top anchor near $87,219 and marks $71,405 (0.236), $61,138 (0.382), $52,951 (0.5), $44,863 (0.618) and $33,349 (0.786). Different anchors/tools are not interchangeable support rungs.
Daily Timeframe for BTC (Bitcoin)
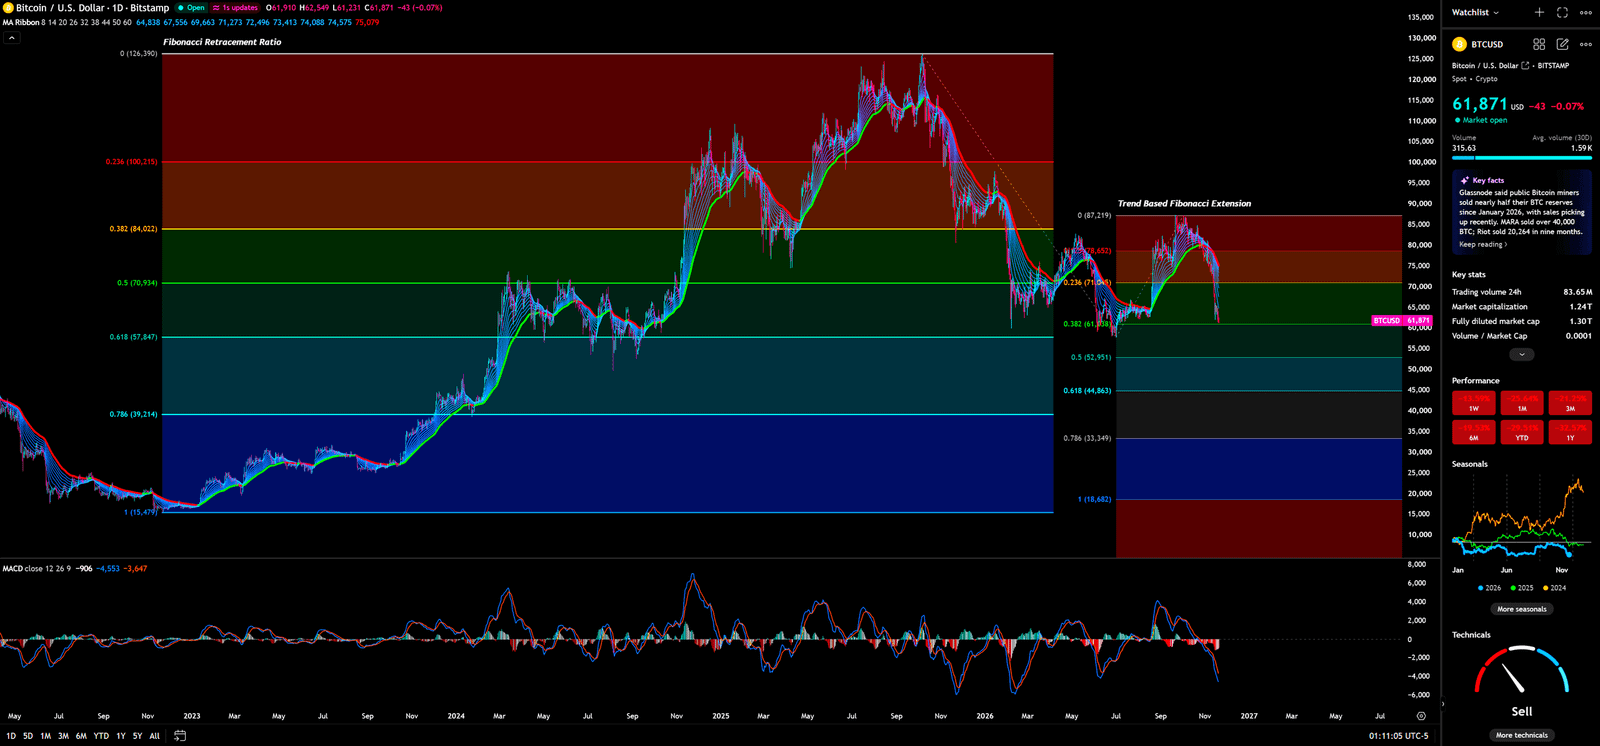
The daily snapshot near $61,871 is just above $61,138 and well below $70,934–$71,405. Fibonacci analysis asks whether a level aligns with swing structure, resistance, volume and closes; the supplied material has no daily volume sequence or completed closes proving $61,138 held. Capital behavior: price tests a lower extension. Retail misread: proximity means confirmed support. Institutional scenario: a risk desk might watch for acceptance above, or a close below followed by rejection on retest. That is an S/R flip, not the first touch. If $61,138 fails, $57,647 and $52,951 become references, not forecasts.
An EMA Ribbon displays dynamic resistance/support. Exact daily readings and alignment are unavailable; price remains below overhead friction. Daily MACD compares faster and slower average momentum; its right edge appears weak and tilted down, not a buy/sell button or proof of divergence. Capital behavior: EMA friction and weak MACD leave follow-through unproven. Retail misread: an oscillator turn means price has structurally turned. Institutional scenario: a manager might wait for reclaim, then test ribbon support and MACD follow-through. Exact EMA values are unavailable.
🌙 Monthly chart analysis — “Oversold” cannot overrule the long-term weather
Bollinger Bands use a moving-average middle line and upper/lower volatility bands to frame price against recent dispersion; touching the lower band does not mean “buy.” Monthly labels show middle SMA near $85,900, upper band around $122,226 and lower band around $49,575. The snapshot near $61,866 is below the mid-band and above the lower band. A declining channel runs from the 2025 peak toward 2026 lows. Structure is unrepaired, but there is no confirmed monthly close through the lower band. Capital behavior: price remains constrained beneath mid-band and channel. Retail misread: “near lower band” means “must bounce,” or a touch is an order. Institutional scenario: a risk manager might weigh completed monthly closes, follow-through and retests more than an intramonth wick.
Monthly Timeframe for BTC (Bitcoin)
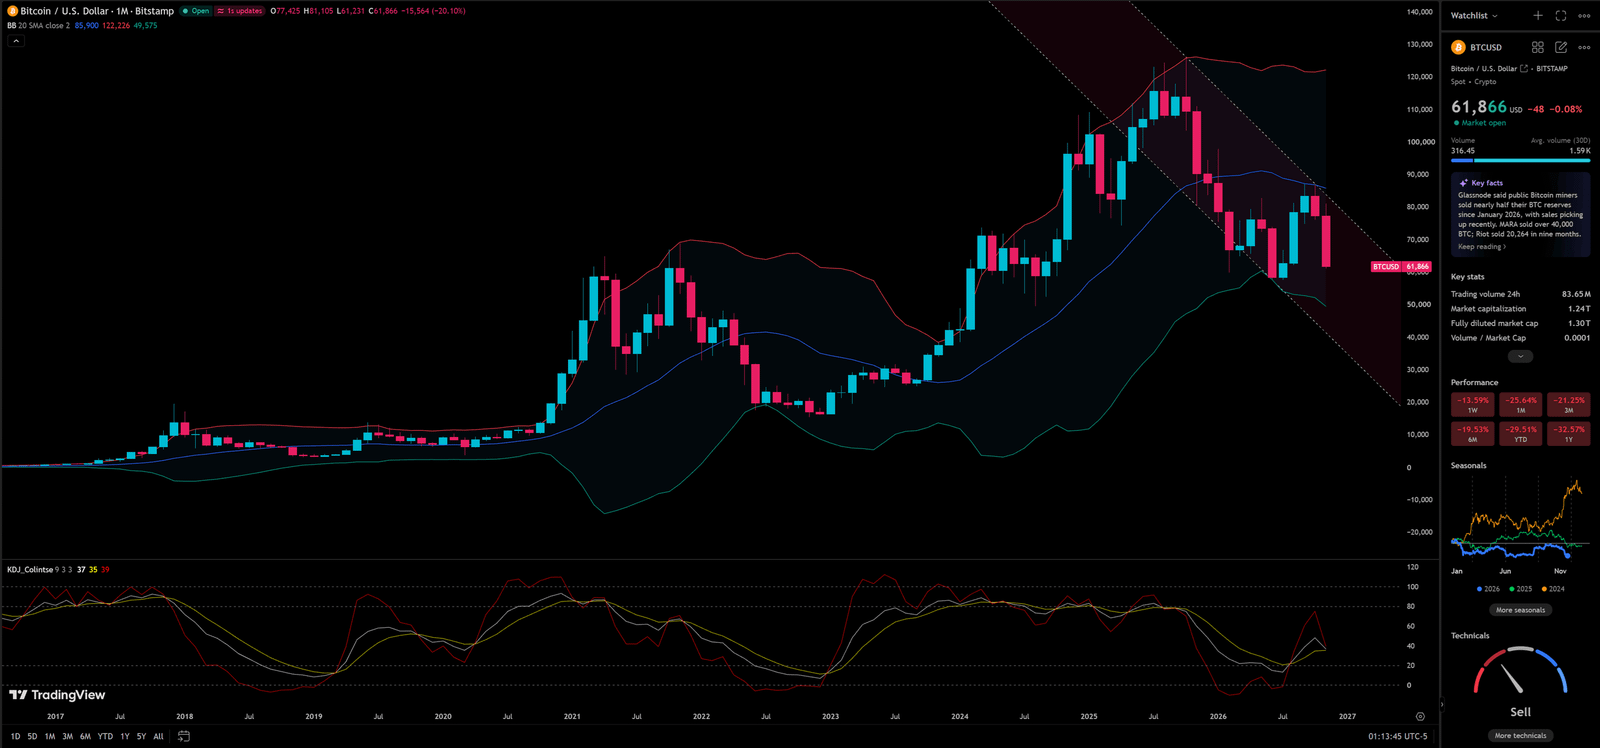
KDJ is a stochastic-style oscillator: K and D are smoothed measures of the close within a recent high-low range; J is more reactive. Tiny readings appear near K 37, D 35 and J 39, but are not fully legible and remain approximate and uncertain. They show no clearly established extreme or monthly reversal in supplied facts. Capital behavior: momentum may be consolidating in a lower range, not accelerating decisively higher. Retail misread: a KDJ turn becomes a confirmed bottom. Institutional scenario: a portfolio manager might require a price reclaim of long-term resistance and sustained oscillator improvement; a sharp J-line turn does not flip a multi-month cycle.
⏱️ Four-hour chart analysis — The descending fan is overhead; a bounce must clear the ceiling
A Gann Fan projects sloped guides from a selected swing point to examine price/time relationships. Its reading depends on anchors and chart scaling; it is a guide, not a precise forecast. The four-hour fan descends from a swing high near $87,000, framing overhead friction, though not every line is confirmed tested or rejected. Trend-based Fibonacci extensions project ratios from selected swing anchors; visible references are $65,237, $67,322, $68,787, $70,251 and $72,063. The snapshot near $61,850 is below these readable bands. Lower plotted zones appear around $62,000, $61,000 and $60,000, but some labels are hard to read and are not exact targets.
4-Hour Timeframe for BTC (Bitcoin)
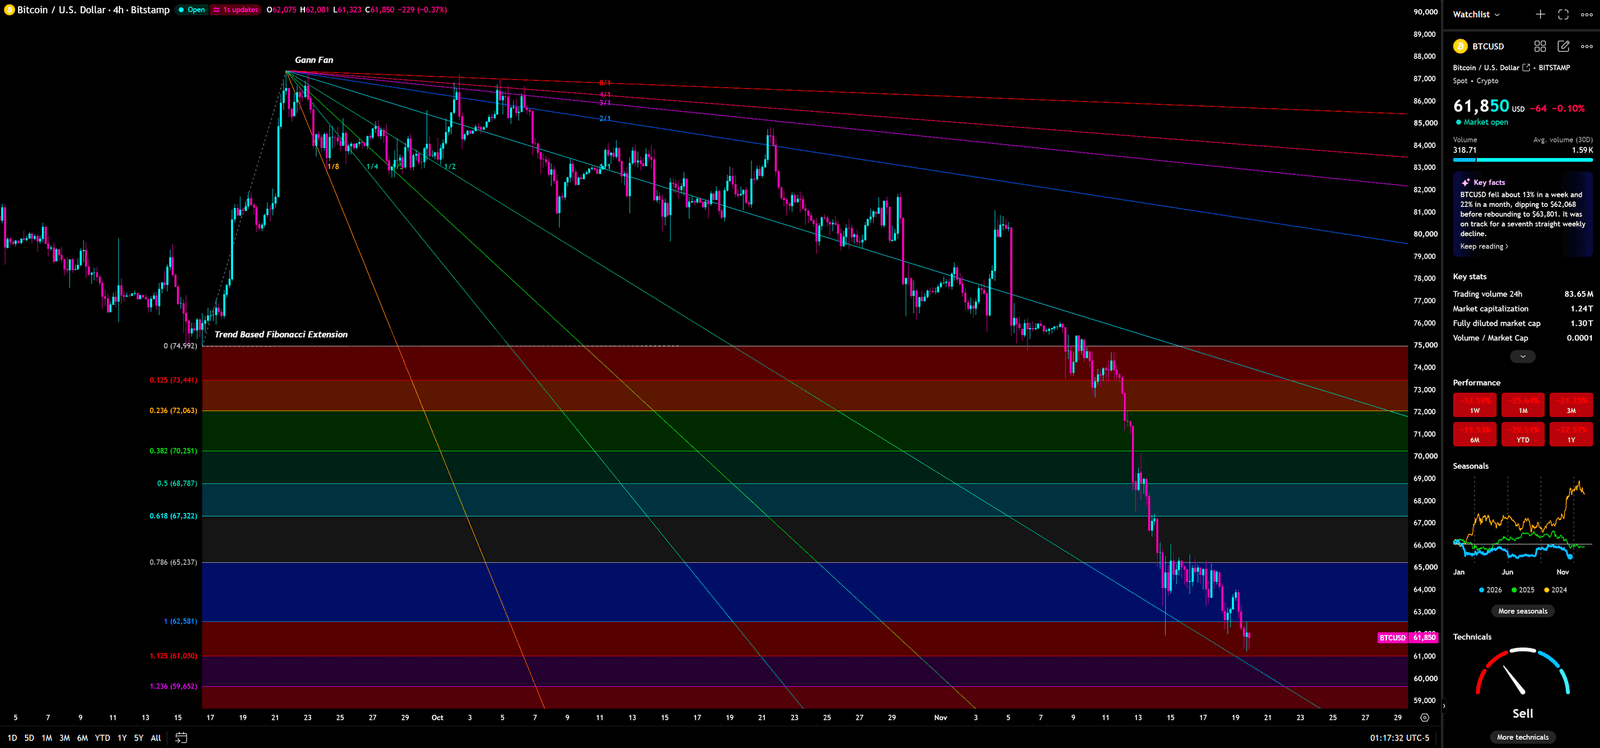
Capital behavior: price has not reclaimed the main readable extension area. Retail misread: a fan line or extension means reversal, or $60,000 is inevitable. Institutional scenario: an execution desk might ask whether a completed four-hour candle reclaims roughly $65,237 and a retest holds. A wick is not acceptance. Short-term timing remains subordinate to weekly lower highs and lower lows; a four-hour surge cannot erase them.
⚖️ Retail vs. institutions — Same candle, different risk question
A retail trader may ask, “It has fallen this far—how much lower can it go?” A risk committee may ask, “Which assumption failed? How much exposure can be carried? Did the close accept above resistance?” No institution has one universal position or can predict the future; ETF-flow reports describe one demand channel, not every investor’s motive.
Banking analogy: a credit committee does not erase repeated delinquency because one payment arrives on time; one green candle likewise does not cancel lower highs and lows. Price is no magic wall: closes must accept around an area before former resistance can function as support. This is a framework contrast, not a claim about actual positions.
🎭 Three scenarios — Draw the routes before price makes the decision
🟢 Scenario one — Repair first, reversal later
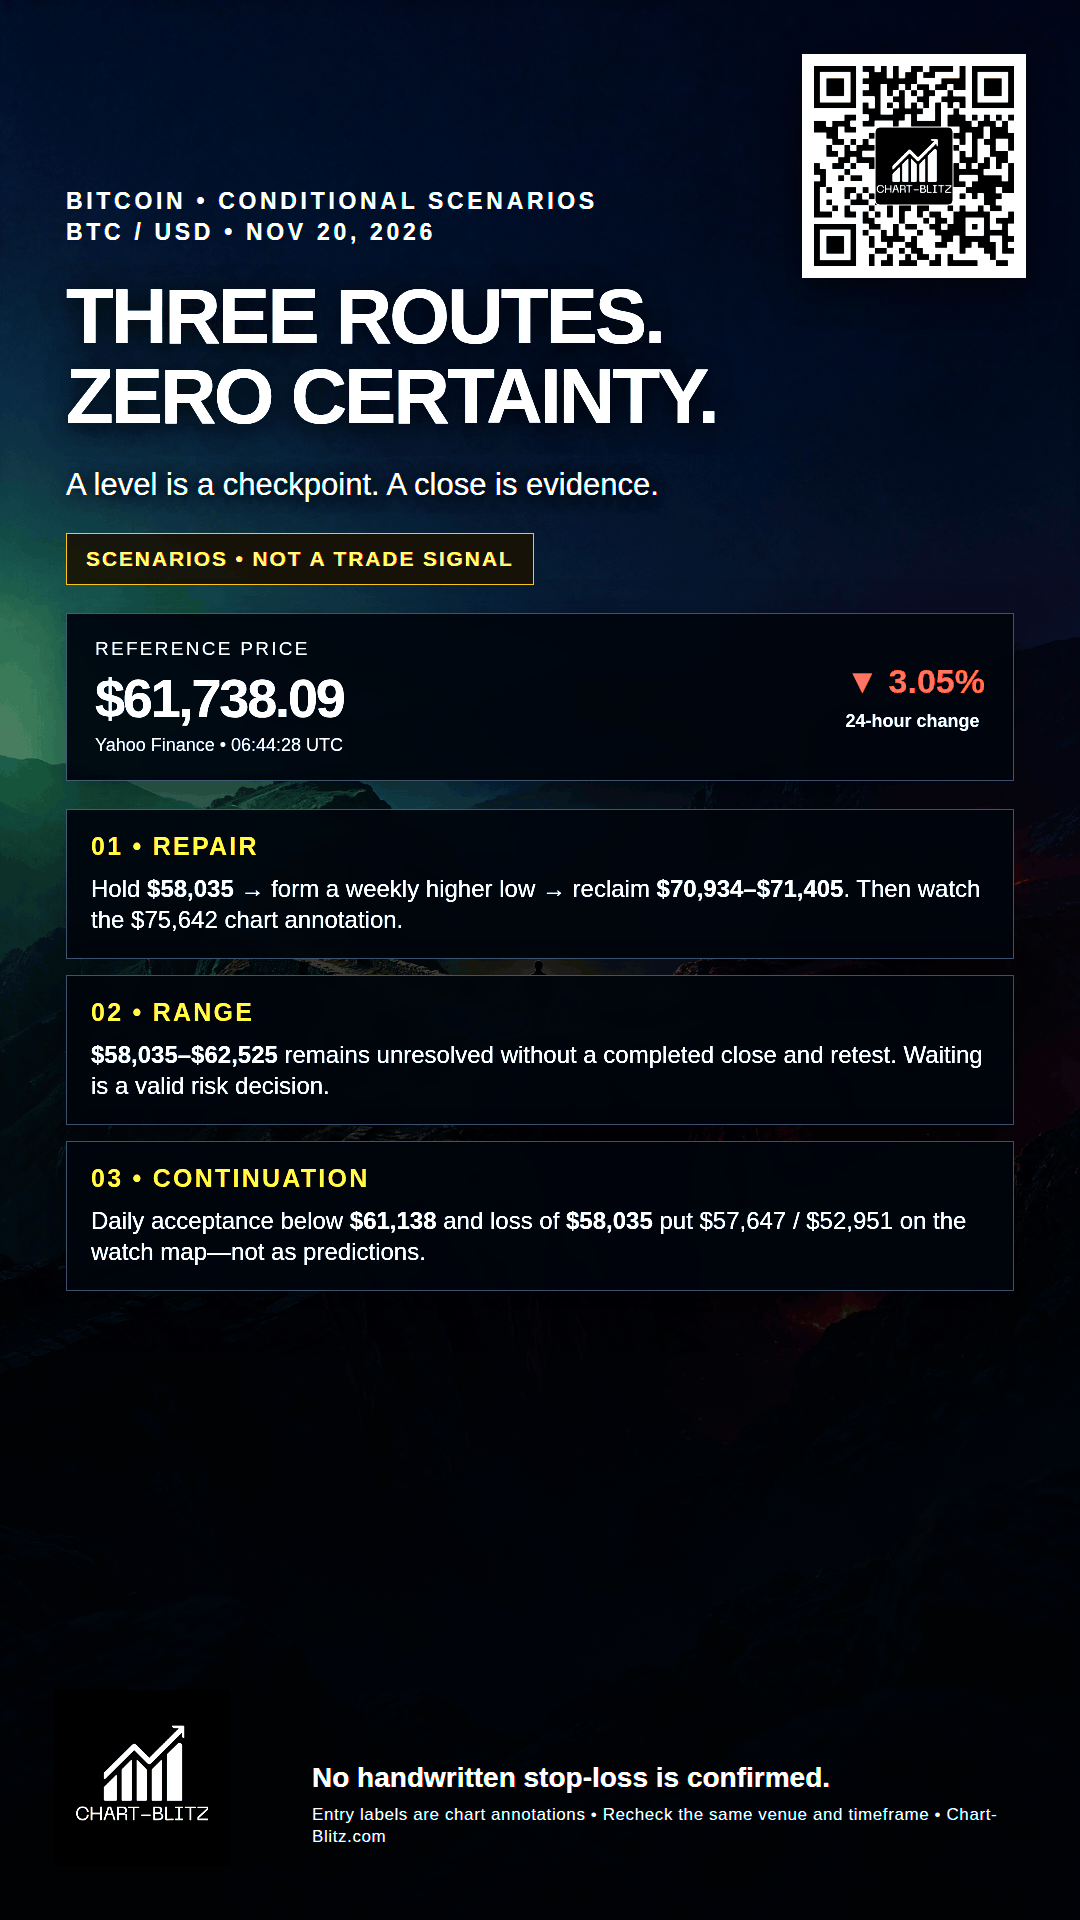
Trigger: weekly price avoids confirmed loss of $58,035 and begins a higher low. Daily price reclaims and holds $70,934–$71,405, then can test $75,642 “Tentative Buying Point.” A fuller reversal still faces $82,833 lower high and $87,219 marked high; until then call it a recovery attempt, not a new bull market.
Capital proxy: closes hold above resistance and retests find acceptance. Retail misread: FOMO chases the first vertical candle. Institutional scenario: a committee might wait for acceptance rather than vote on headlines; hypothetical, not observed. Invalidation: the higher low fails, or daily closes fall below $70,934 with persistent weakness. $89,654 “Safest Entry Point” is an annotation, not certified safe.
🟡 Scenario two — Chop between $58,035 and $62,525; wait rather than force a forecast
Trigger / continuation: price rotates around $58,035 and $62,525 without daily or weekly closes confirming exit. Wicks may tempt bottom calls or shorts on each bounce.
Capital behavior: no new zone is accepted; without readable VPFR POC/value-area labels, neither side is established. Retail misread: the range midpoint is called a “cheap entry.” Institutional scenario: a risk manager might wait for break, retest and acceptance. Invalidation: a completed directional close with follow-through makes neutrality obsolete. Waiting inside noise is a risk decision.
🔴 Scenario three — A fresh lower-structure test raises downside risk
Trigger: daily acceptance below $61,138, then loss of $58,035. $57,647 becomes a reference; below it, the next visible extension is $52,951. $44,863 is a distant map mark, not a prediction.
Capital proxy: breakdown, rejected rebound and daily closes unable to recover the broken area. Retail misread: lower price means oversold and must stop falling. Institutional scenario: risk budgets might stay defensive if price cannot reclaim the breakdown zone, but supplied facts do not show any institution acted. The chart calls $61,431 “The Best Short Entry”; it is not an instruction. At a $61,738 baseline, copying it as a market short is especially careless. Invalidation: rapid reclaim of $62,525 with sustained daily/weekly acceptance weakens continuation.
🧩 Trading plan / conditions — Do not invent the stop the chart did not mark
| State | Conditions to monitor | Chart references | Invalidation / risk discipline |
| Bullish repair | Daily close reclaims and holds $70,934–$71,405; higher low develops; price tests $75,642 | $75,642 “Tentative Buying Point”; $82,833 and $87,219 later tests | Before reclaim, do not call a bounce reversal. A close back below the confirmed area requires reassessment; $89,654 “Safest Entry” is no guarantee. |
| Neutral wait | Price rotates near $58,035–$62,525 without daily/weekly close and retest confirming exit | $62,525 and $58,035 structure references | Avoid the middle; require close outside range and retest. Missing the first move is preferable to repeatedly paying for noise. |
| Bearish continuation | Daily acceptance below $61,138, then loss of $58,035 | $57,647 and $52,951 lower references | $61,431 is a chart annotation, not instruction. Fast reclaim of $62,525 weakens the premise. |
The charts do not show a clearly legible, handwritten Stop Loss. An infographic should say “Not Yet Confirmed.” These invalidations are scenario boundaries, not personalized hard-stop orders. Leverage, position size, slippage, funding and exchange risk can make results diverge from the chart. Any actual stop must reflect the trader’s own limits and venue; do not move invalidation lower to avoid admitting a failed thesis.
Sequence matters: test weekly higher-low formation, then daily reclaim of $70,934–$71,405 into support, then four-hour acceptance/rejection near $65,237. Do not force weekly evidence to endorse a short-term emotion.
🧠Conclusion and recommendation — $60,000 is psychological; the close is evidence
At the locked reference, BTC was $61,738.09, with Yahoo showing −3.053% (hourly comparison −3.01% on its distinct window). Reported ETF outflows and weaker risk appetite frame the news. Weekly lower-high/lower-low structure is unrepaired; daily price is near $61,138 and below $70,934–$71,405; monthly price is under the Bollinger mid-band inside a declining channel; four-hour price is below readable extension bands. The read is weak, but future closes have not confirmed what comes next—neither certain collapse nor confirmed bottom.
Holding $58,035 and forming a higher low would improve the weekly case. Reclaiming $70,934–$71,405 begins daily repair; breaking $82,833 and $87,219 would be stronger higher-timeframe evidence. Losing $58,035 and failing to recover on daily/weekly closes makes $57,647 and $52,951 references to monitor, not predictions. Chart labels are not recommendations, institutional actions or promised outcomes.
I will continue to closely monitor the price action of this Crypto. As soon as a critical reversal signal appears on the charts, I will update my analysis and insights right here immediately. Remember to Bookmark this page and come back often to check for the latest updates!
Want to see our full, interactive chart breakdown? If you want to learn how to draw weekly VPFR, Fibonacci, EMA Ribbon, MACD, Supertrend, and S/R Flip frameworks designed for real trading decisions. Please browse the following『Further Reading』links. Fundamental news tells you what happened. Technical analysis predicts what will happen. To master the professional framework that separates market signal from noise, explore our exclusive models at https://www.chart-blitz.com/fxcx-app/omni-chart.html?symbol=BTC.
📚Further Reading:
To help everyone gain a deeper understanding of the various technical indicators mentioned in this article, we have specially prepared the following further reading materials. These cover key analytical tools found across the weekly, daily, monthly, and 4-hour charts.
- Decoding Fibonacci Retracement: The Perfect Blend of Natural Law and Market Psychology — Fibonacci Retracement is not just a set of magical numbers; it is a manifestation of market psychology. Learning how to correctly draw and interpret Fibonacci levels is a required course for every serious trader.
- Is a Major Move Hiding in Plain Sight? Dow Theory May Already Know the Answer — As retail traders continue to chase short-term signals, experienced market readers are looking deeper — into trend structure, volume behavior, and market phases that may expose the early clues of a coming breakout.
- Understanding VPFR: Finding the Hidden Footprints of Market Makers — The Volume Profile Fixed Range (VPFR) is a powerful tool that tells us where the most trading occurred within a specific price range. This helps us identify true support and resistance levels, as well as potential ‘Vacuum Zones’.
- S/R Flip Support and Resistance Swap Strategy — S/R Flip is one of the most powerful concepts in technical analysis. This article uses real cases to teach you how to use S/R Flip to capture the highest win-rate trading opportunities.
- MACD Momentum Indicator Momentum First — What Does the MACD Line Crossing Above Zero Mean? Golden Cross & Divergence Signals!
- Gann Fan Masterclass — Deep dive into W.D. Gann’s angle theory to identify the geometric relationship between time and price in the market.
- Strategies for EMA Ribbon Bearish Alignment: Dead Cat Bounce or Real Reversal — Deep dive into the EMA Ribbon to understand the battle between short-term and long-term capital.
- Bollinger Band: Long-Term Repricing Zone — The Ultimate Tool to Capture Massive Market Moves Tired of getting shaken out of winning trades too early? Or buying right before a trend reverses? An ex-banker reveals how to use the Bollinger Band to filter out market noise and ride the big waves.
- KDJ Stochastic Indicator Bottom Confirmation — What is the implication of a downward-curving KDJ? Understand in one article how to use dynamic indicators to catch market turning points.
【Disclaimer】 The content herein is for educational purposes and reflects the author’s personal opinion only; it is not investment advice. All financial investments, including cryptocurrencies, carry significant risk, and you could lose your entire capital. To support this site, this article may contain affiliate links. While we strive for accuracy, we cannot guarantee all information is complete or error-free. Please conduct your own research and be fully responsible for your own investment decisions.