Fetching Live Market Data...
When you make a trade, you should have a clear target of where you expect to get out
William Delbert Gann – 1949
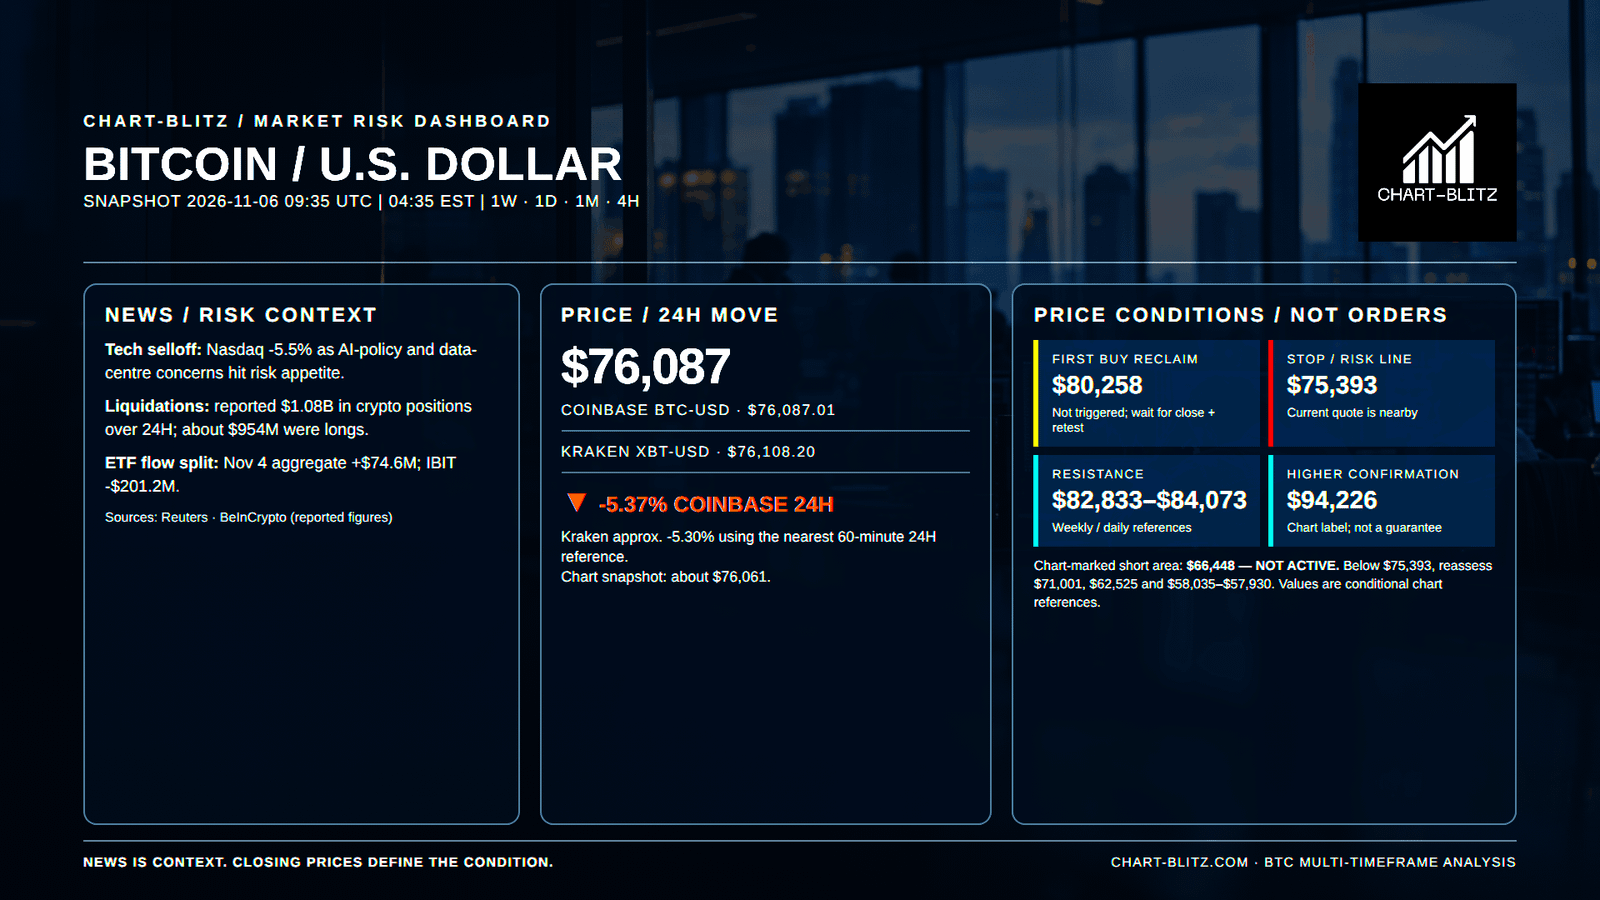
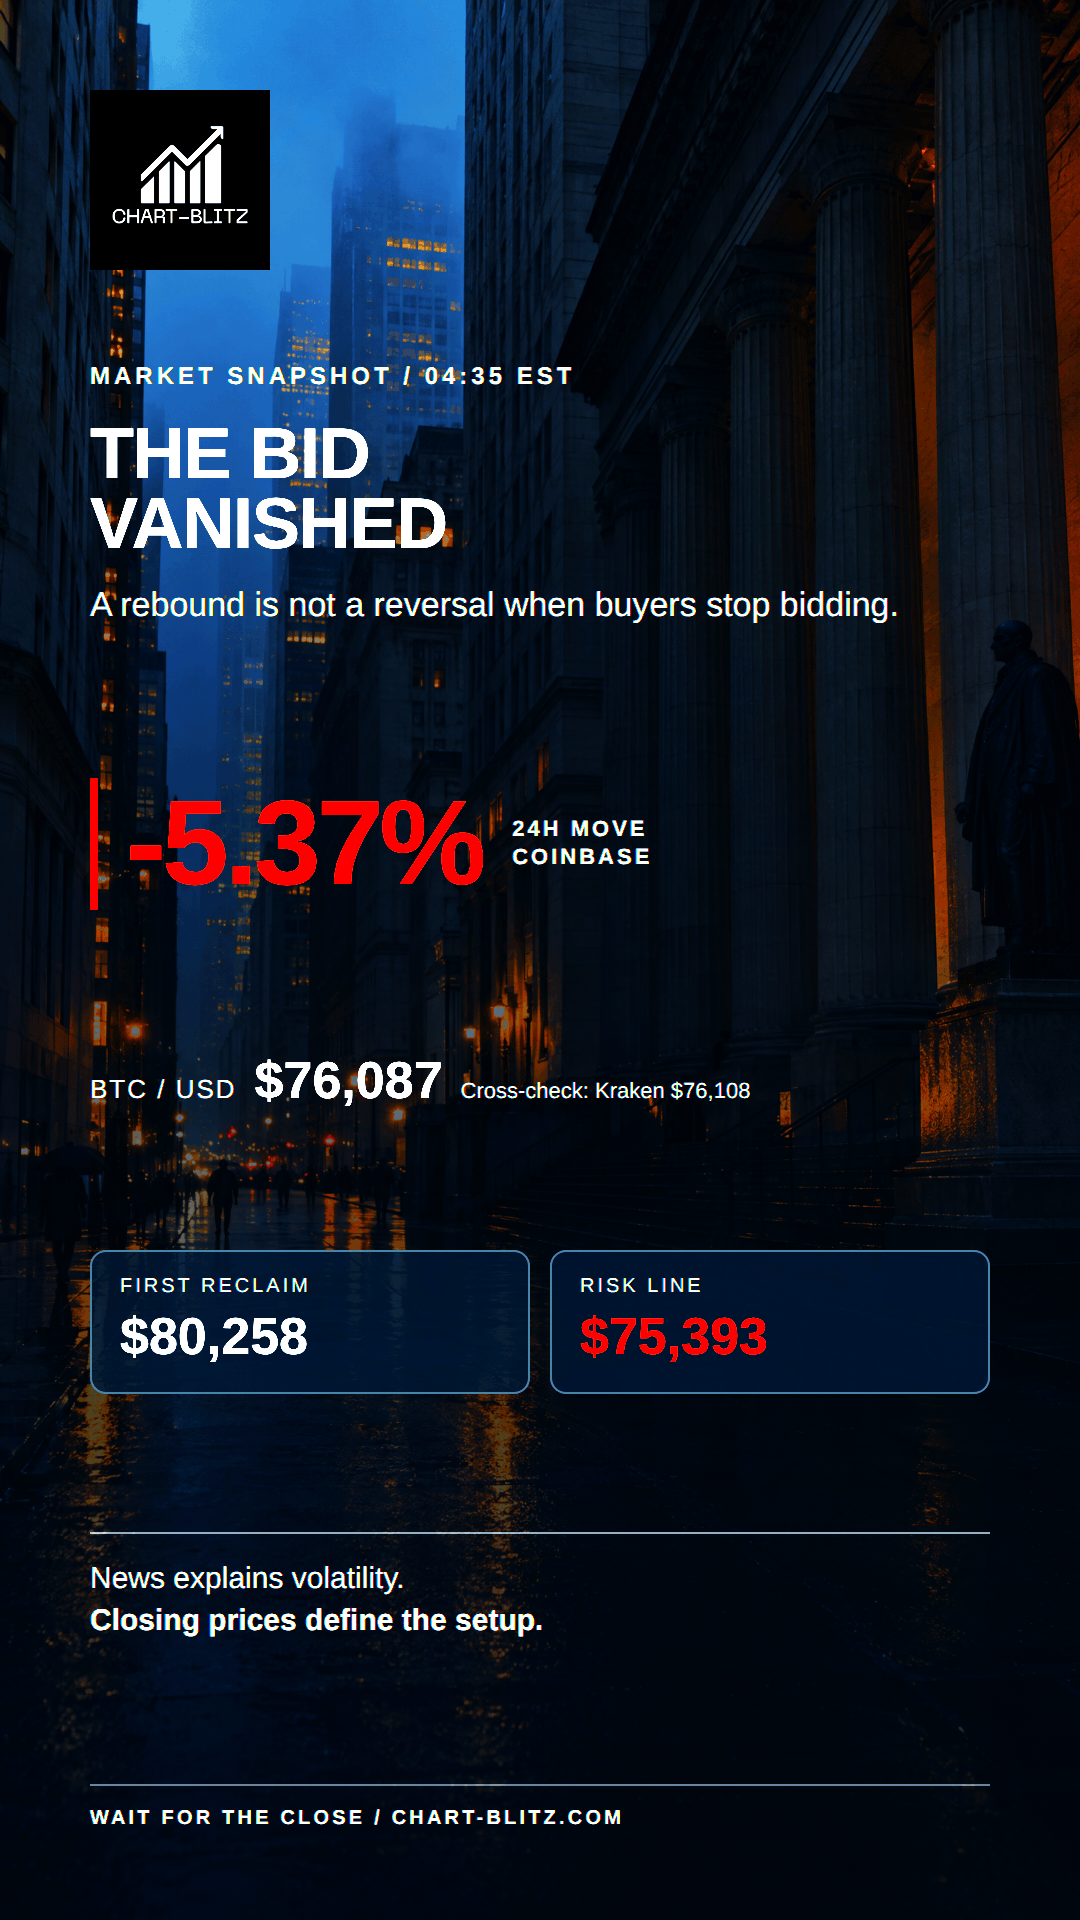
Latest Bitcoin Price Analysis: $75,393 Risk Line vs. $80,258 Reclaim. Bitcoin’s most dangerous rally is the one that persuades traders the low is in before buyers have proved it. BTC is near $76,000 after rallying above $80,800 following the US midterms and then retreating toward $75,500 on November 5. The immediate map is plain: $75,393 is the chart’s downside risk reference; $80,258 is its tentative buying marker. Neither is a guaranteed turning point, and neither should be traded as a command. The weekly structure remains the core of this analysis; lower timeframes refine the conditions but do not overrule it.
⚡ A rebound tests belief, not just a price line
A dangerous rebound can rise far enough to persuade traders the worst is over, then find that buyers will not continue bidding. Bitcoin briefly traded above $80,800 after the US midterms before a technology-share selloff and leveraged closures helped pull it toward $75,500 on November 5.
Separate catalyst from evidence. A headline may explain volatility, but cannot prove a trend reversal. A chart cannot identify a secret institutional actor; it can show where price was accepted or rejected. “AI shares are falling, so Bitcoin must fall” is as careless as treating one day of ETF inflows as a guarantee BTC must rise. The useful tests are whether $75,393 holds on a close and whether BTC reclaims $80,258 and resistance above it.
On a bank trading desk, the headline is weather; the position limit is the route. A captain does not assume a reef has vanished because the sky cleared. Likewise, one green candle does not repair a weekly decline. At this snapshot Bitcoin is near a fragile balance above an annotated risk line, not at an obvious low-risk long entry. Traders who missed the first bounce do not have to chase its next candle. Waiting for a defined close and retest is a decision, not a failure to act.
The market is asking for evidence, not confidence. A wick through resistance may reverse; a close above it followed by a defended retest is more informative. A breakdown can fail too. Price must demonstrate acceptance, and any position needs a point at which its thesis is wrong. On a dealing desk, a trade without an exit condition is not a plan; it is an open-ended argument with the market..
【📊Analysis Baseline Statement】
All technical analyses below are based on the price snapshot locked on November 06, 2026 (EST): 04:14 Bitcoin (BTC) = $76,011 USD. Please treat this report is an analytical map, not a live executable quote. Fragmented crypto venues can differ by a few dollars; every decision must be checked against the same venue and a completed candle before action is considered.
💡Four frames. One question: did it hold?
The Price and Timestamp above are the print this piece froze at the close of writing — not the tape now. Markets move; the copy does not. The only check that matters is whether that freeze still holds. Open Chart Grid: One name, Four frames, locked Weekly → Daily → Monthly → 4-Hour, the article’s print against the live chart. You do not pick timeframes, and you should not trust the headline. Hold or break: you decide.
🗞️ Background and news: the catalyst is real; the conspiracy is not evidence
Bitcoin’s rebound was encouraged by post-election positioning, then challenged by repricing in technology and risk assets. Reuters reported a sharp technology-share selloff in Asia on November 6 amid concern that the US midterm result might bring more AI-policy scrutiny and slow data-centre construction. The Nasdaq fell 5.5%, with major Asian technology markets also under pressure. This cross-asset risk reduction is sufficient context; no hidden-actor theory is needed.
BeInCrypto reported BTC briefly above $80,800 after the election before retreating toward $75,500 on November 5. It cited about $1.08 billion in 24-hour crypto liquidations, including $954 million in longs, and described renewed spot selling with falling perpetual-futures open interest. These figures are consistent with spot sales and leveraged exits amplifying the move, but do not prove who initiated it.
ETF flows were mixed. BeInCrypto reported about $74.6 million in aggregate US spot Bitcoin ETF inflows on November 4, while IBIT alone saw approximately $201.2 million in outflows, partly offset by other products. Aggregate-only or single-fund readings each miss part of the picture. Flows inform positioning; they do not forecast the next candle.
The late-October Binance security incident and withdrawal concerns formed part of the wider backdrop. 21Shares’ November outlook supplies only broader context and predates these 24-hour reports. It would be too neat to blame every move on one event. The rebound struggled to persist during favourable headlines and retreated as technology risk deteriorated. News may be the spark; price structure shows whether the move spreads. Does BTC accept prices above $80,258 on a close?.
🧭 Weekly analysis: the larger swing structure remains the central test
The weekly chart is core because it filters daily noise and shows multi-month acceptance or rejection. Visible swing labels: $126,085 Swing High, $107,079 Swing Low, Lower Highs around $97,979 and $82,833, and Lower Lows around $80,537, $62,525, and $58,035. The sequence descends; rebounds have not returned to the earlier high zone. In Dow terms, the larger decline remains unresolved until relevant prior swings are reclaimed. That does not mean every rally must fail, but a new bull trend needs confirmation.
Weekly Timeframe for BTC (Bitcoin)
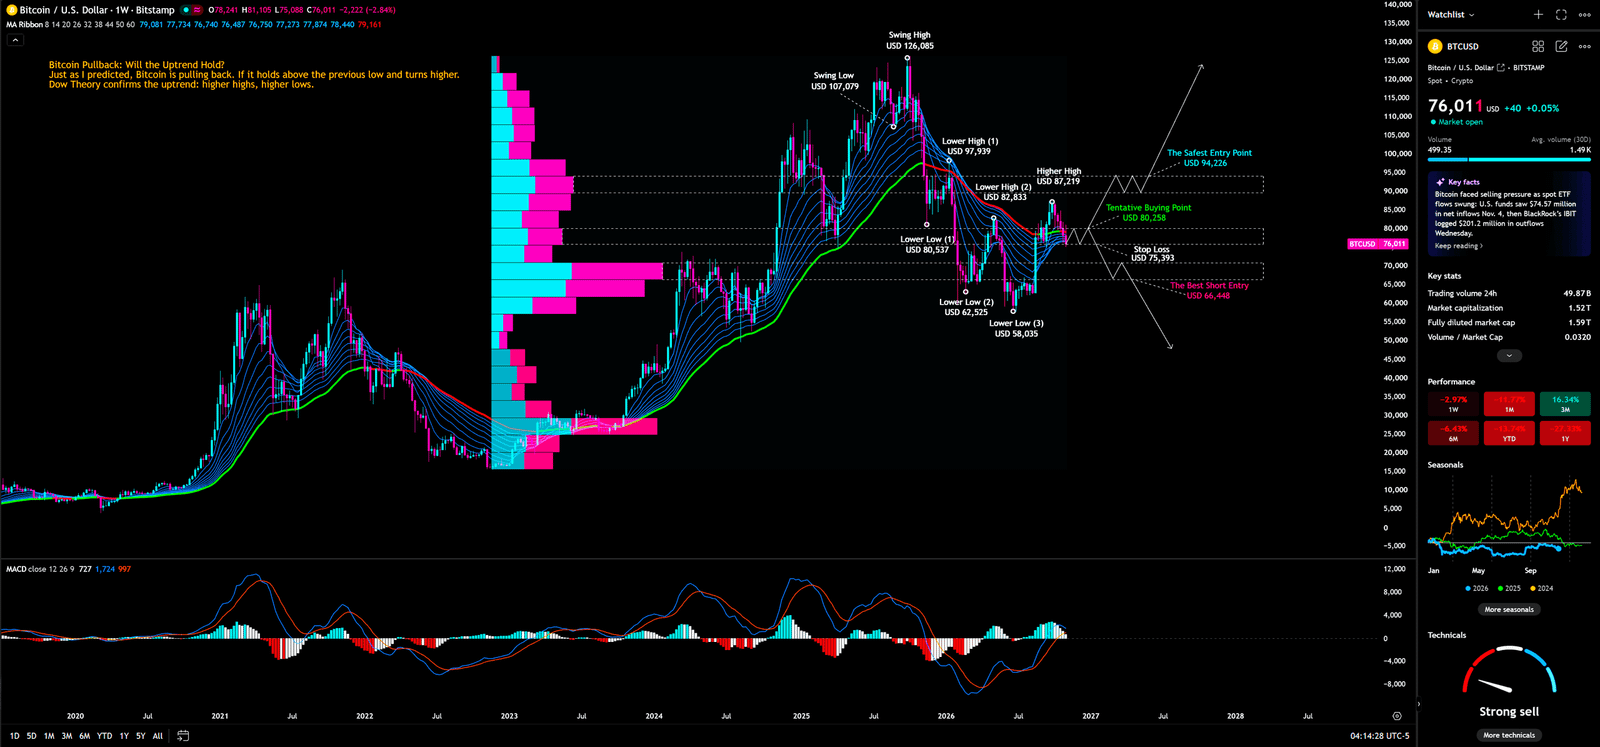
The annotations conflict: “Lower High (2) $82,833” and “Higher High $82,719.” Since $82,719 is numerically below $82,833, they cannot be successive highs in one uninterrupted sequence. They may mark different pivots or reflect inconsistent labelling. Without a time anchor, do not resolve this or treat it as a confirmed Dow signal. Sound analysis does not invent a story to rescue conflicting labels.
📈 Weekly EMA Ribbon: a bundle of averages is a test, not a wall
An EMA Ribbon groups exponential moving averages from different periods; its ordering and slope help assess trend and compression/expansion. Watch whether price reclaims the group rather than trading every touch. Weekly, it can distinguish a short-covering bounce from improved medium-term average-cost structure.
BTC near $76,000 is below the higher moving-average area and $80,258 tentative buying marker. Rejection at the ribbon suggests overhead supply; weekly closes reclaiming and holding it may turn it into support. The test is sustained demand, not one candle. Retail may mistake a touch for a breakout; a desk asks whether the close and retest hold. A weekly reclaim is the trigger; losing it again is failure.
🧱 Weekly VPFR: no readable POC, no invented vacuum
A Visible Range or Fixed Range Volume Profile (VPFR) distributes volume across price levels in a selected range. Its Point of Control (POC) is commonly the price with the most volume. A thin area may permit faster movement, but a “vacuum” claim needs a defined range, readable POC, and profile covering those prices. It maps past participation; it is not a forecast.
The weekly screenshot shows bars but no clearly labelled current-zone POC; the profile appears concentrated in an older region, not mapped cleanly around $76,000. It proves neither a current vacuum nor an institutional exit-liquidity trap. A refreshed, clearly ranged profile might add evidence; for now, closes around $75,393 and $80,258 are more observable. Retail may treat a bar as guaranteed support; professionals treat it as history. If the POC is unreadable, do not invent one.
🔀 Dow swings and S/R Flip: watch acceptance at $75,393 and $80,258
Dow swing analysis reads meaningful highs and lows: advancing trends generally form higher highs/lows; declines form lower highs/lows. An S/R Flip is when broken resistance may become support after a reclaim, or broken support resistance after a failed retest. Weekly labels lean bearish, subject to the $82,833/$82,719 conflict. The question is whether price accepts a reclaimed level.
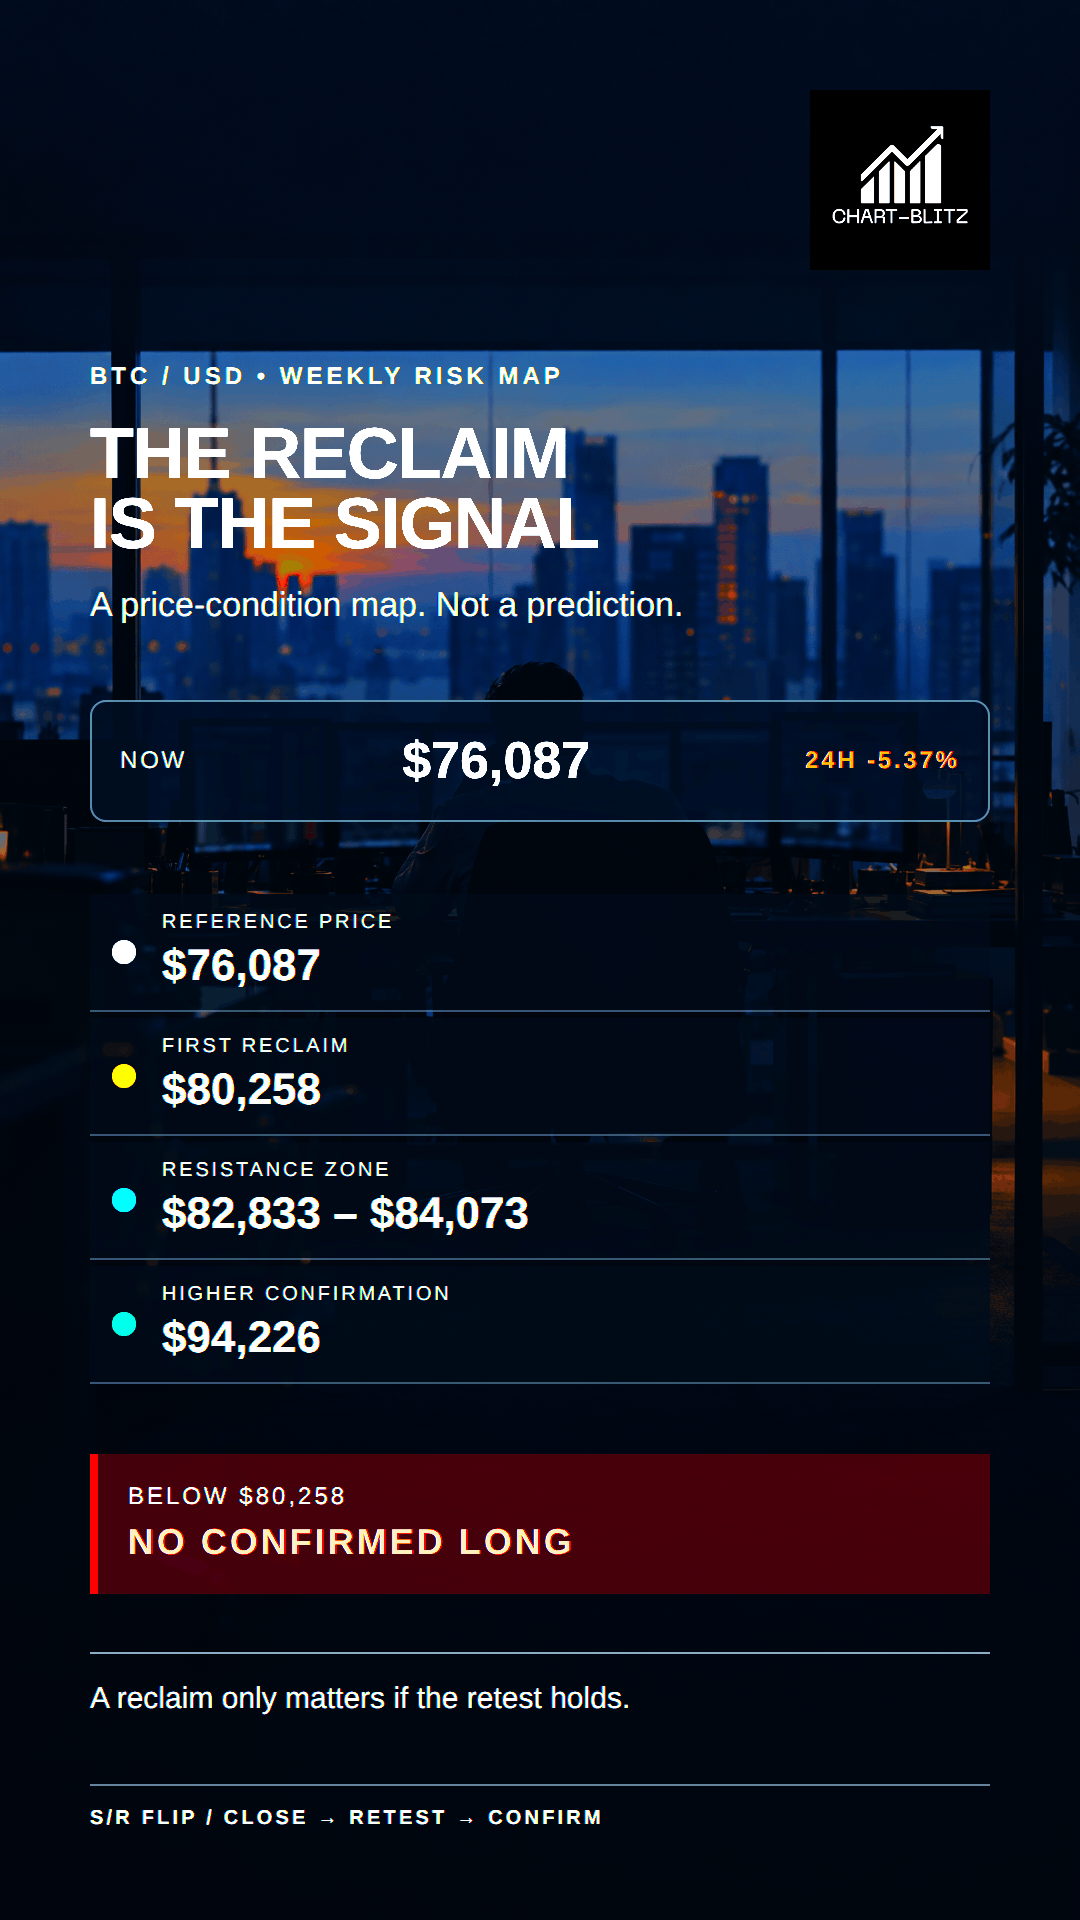
The chart labels Tentative Buying Point $80,258, “Safest Entry Point” $94,226, Stop Loss $75,393, and “Best Short Entry” $66,448. These are chart annotations, not automatic signals or instructions. Below $75,393, higher buy zones are not an active long setup. A reclaim and defended retest may justify evaluating a trade against personal risk limits; exit if the level fails or a preselected stop is reached rather than widening it to avoid being wrong.
Weekly MACD (Moving Average Convergence Divergence) compares moving averages via a difference line, signal line, and histogram to track momentum. Crossover, zero-line, or divergence claims require readable values and comparable pivots. The screenshot is too limited to confirm the latest crossover, zero-line position, or divergence. Treat MACD as something to monitor, not proof of reversal. Price must repair structure; the relevant invalidation is the response to $75,393, not an illegible indicator.
Weekly takeaway: BTC is less than 1% above the $75,393 annotation and below $80,258. Bulls must reclaim $80,258, then address $82,719–$82,833; $94,226 is a higher reference, not a nearby target. Bears need a loss of $75,393 and failed reclaim. Between them, standing aside can preserve risk budget.
🧮 Daily analysis: Fibonacci references bracket the price, but none is automatic support
🧮 Fibonacci Retracement: Reaction Zones, Not Obligations
The daily view translates weekly structure into a shorter path. Fibonacci retracement divides a selected swing into proportional references; compare them with actual swings and closes, not as prices that compel reversals. Visible levels: 0 $126,390; 0.236 $101,247; 0.382 $84,073; 0.5 $71,001; 0.618 $57,930; 0.786 $39,319; 1 $15,616.
Daily Timeframe for BTC (Bitcoin)
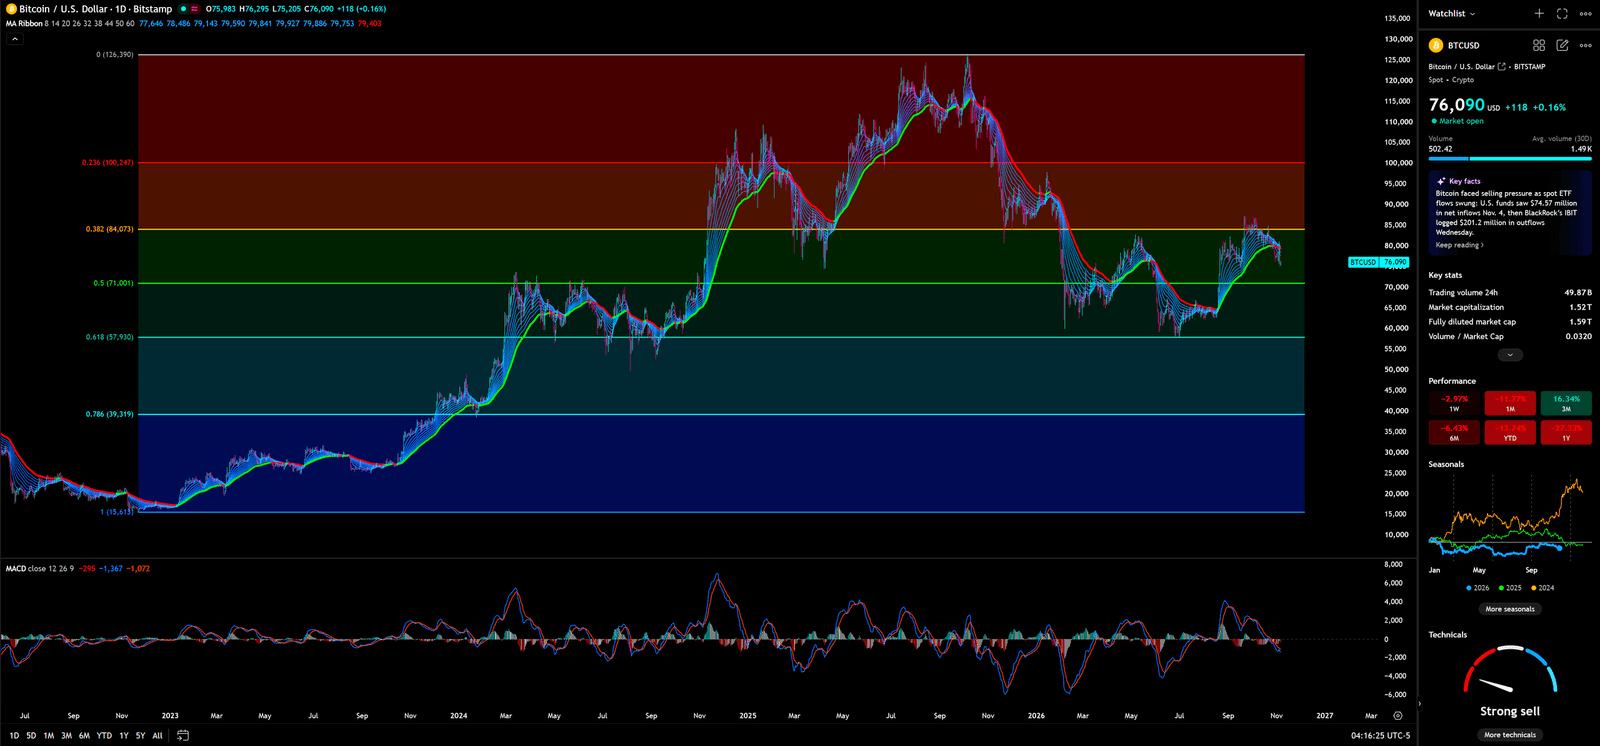
At $76,087 BTC lies between $71,001 and $84,073, not close enough for a Fibonacci-only entry and not in the 0.5–0.618 “golden pocket.” A daily reclaim of $80,258 and break of $82,833 would test $84,073 supply. Losing $75,393 puts $71,001 and $62,525–$57,930 in view. Require sustained acceptance, not a wick: Fibonacci is a ruler, not a talisman.
🧵 Daily EMA Ribbon and MACD: close, retest, follow-through
The daily EMA Ribbon groups exponential moving averages; compression can accompany weakening trend momentum and expansion a stronger directional move. It tests whether the bounce from the low-$60,000s to low-$80,000s has overcome supply. Exact line values are unreadable, so no average price is invented.
Daily MACD compares moving averages through a difference line, signal line, and histogram to frame momentum; the latest crossover and values are illegible, so it is not standalone evidence. BTC rallied from the low-$60,000s into the low-$80,000s, then retreated toward $76,000. Daily closes reclaiming $80,258 and holding on retest could turn resistance into support; rejection remains consistent with a countertrend bounce. Larger participants seek closes and retests, not just a green day. Trigger: reclaim, retest, follow-through—not chase.
Daily paths are breakout, range, or failure. Bullish: close above $80,258, test $82,833–$84,073, then hold a break for higher reference $94,226. Bearish: rejection below $80,258 and daily close under $75,393; reassess $71,001, $62,525, and $57,930. Neutral: range between $75,393 and $80,258, where wicks can repeatedly stop traders. Each path needs closing confirmation; a quickly reversed intraday move confirms neither breakout nor breakdown.
🌙 Monthly analysis: volatility is elevated; an oversold bounce is not a long-cycle bottom
The monthly chart frames short-term fear in the larger cycle and displays Bollinger Bands and KDJ. Bollinger Bands use a moving-average middle band and standard-deviation upper/lower bands; width reflects volatility. Assess width, closes relative to the middle band, and close direction. Touching the lower band alone does not prove a rebound.
Monthly Timeframe for BTC (Bitcoin)
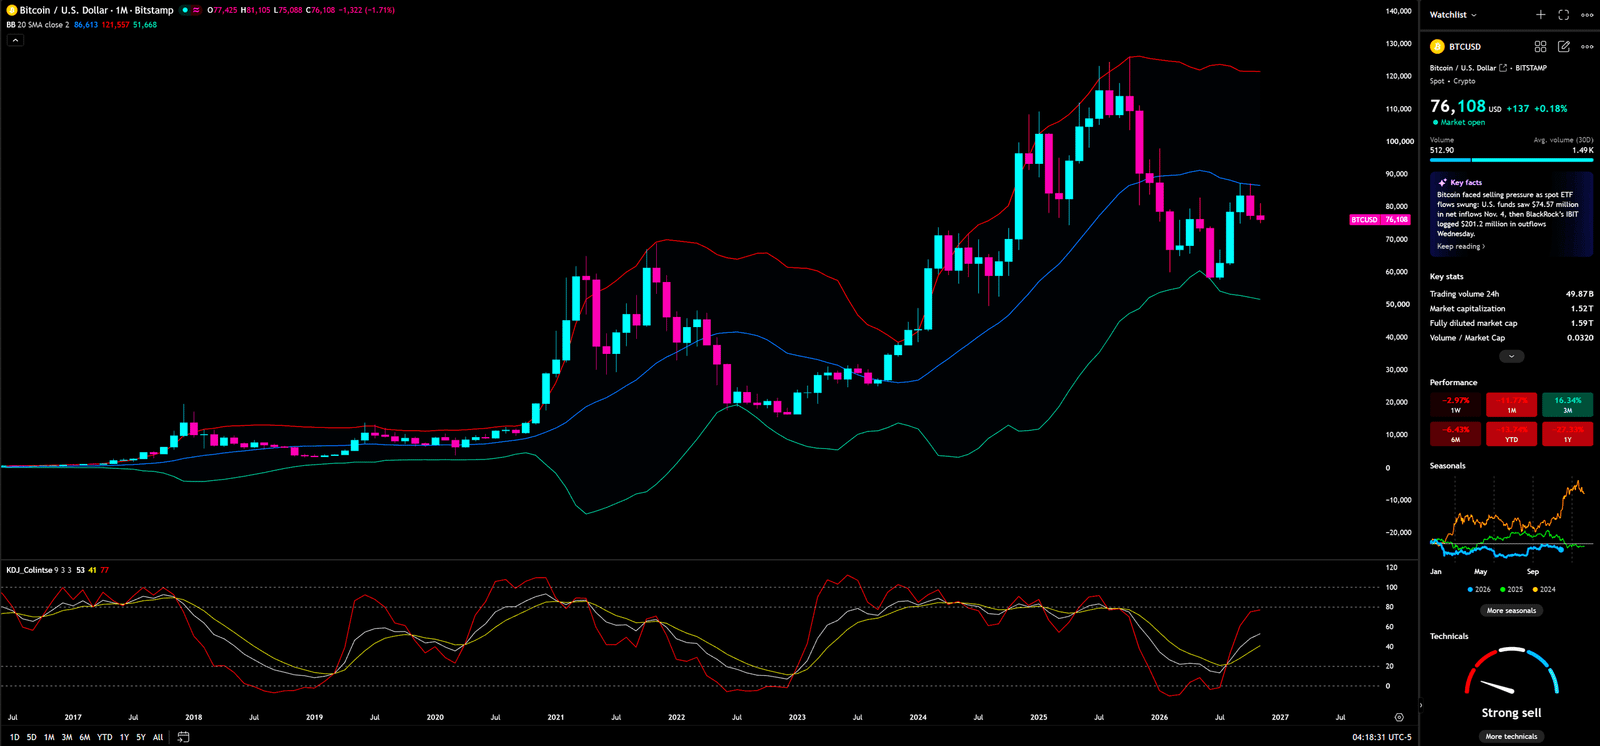
Near $76,000, BTC appears between monthly middle and lower bands after a large retreat. Continued closes below the middle band may require longer-term capital to rebuild cost and confidence. A sustained reclaim would make this a candidate for long-cycle strengthening, not confirm it. Ask whether band width and closes improve and demand persists; a daily headline is not monthly confirmation.
KDJ measures a close within a recent high-low range: K and D are smoother; J is more responsive. Overbought/oversold zones describe momentum, not an immediate reversal. Monthly KDJ helps assess whether a longer decline is slowing, not predict tomorrow’s candle.
Visible KDJ lines lift from a recent low, but exact values are unreadable. This suggests possible momentum recovery, while price still needs the middle Bollinger Band and weekly resistance. Rising KDJ below $75,393 may only mean the decline is slowing. A monthly close through lower support keeps risk alive. An indicator can warm while structure stays cold.
📐 Four-hour analysis: Gann Fan angles map pressure, not a liquidation bottom
The four-hour chart shows rays from a swing origin labelled 1/8, 1/4, 1/3, and 1/2, consistent with a Gann Fan. This price-time angle tool can mark dynamic support/resistance, but depends on origin and chart scale; it maps possible pressure, not destiny.
4-Hour Timeframe for BTC (Bitcoin)
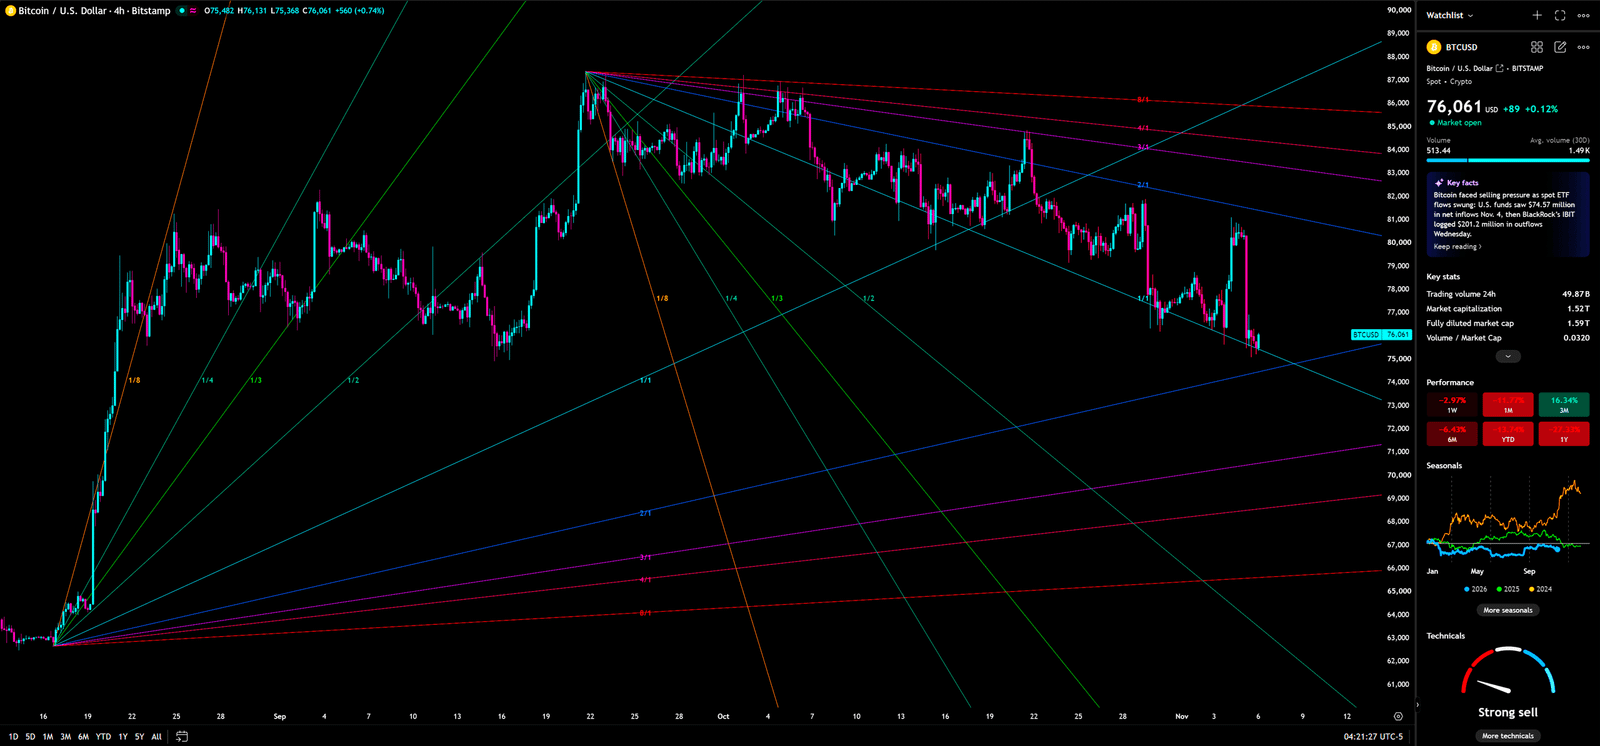
BTC is around $76,061 at the right edge, below nearby declining angles. Overlapping lines lack exact price labels, so no dollar targets can be assigned. A four-hour close over $80,258 and defended retest would improve the short-term picture; losing $75,393 and failing to recover favours pressure. Capital is revealed by whether bids persist; retail may chase one green candle, while a desk waits for the retest and sizes against invalidation. One four-hour candle can change pace, not cancel the weekly trend.
No verifiable Elliott Wave 1–5 count appears clearly on the four-hour image, so no count is imposed. Any future standard five-wave impulse interpretation would still need to respect the core rule that wave four cannot overlap the price territory of wave one’s top. If it does, that standard impulse hypothesis fails and a different or larger corrective interpretation may be needed. The present image does not permit a reliable count or overlap test. Elliott Wave remains a hypothesis to verify, not a trigger to trade.
⚖️ Retail versus institutions: the same headline, different questions
A retail trader may ask whether election uncertainty has ended and BTC can bounce. A desk risk manager asks how much to reduce if $75,393 fails and what evidence is required to restore exposure after $80,258 is reclaimed. The first treats headlines as direction; the second lets price govern risk. ETF assessment should include aggregate and fund-level flows, spot and derivatives participation, and whether demand persists.
This does not mean institutions manipulate every market or all retail traders make the same mistake. The distinction is process: limits, hedges, and execution plans separate being right from controlling the cost of being wrong. A trader without a risk ceiling may chase shorts in a selloff and longs in a bounce, paying volatility twice. No conspiracy is needed; volatility is enough.
🎭 Three scenarios: state the conditions, then let the market disprove them
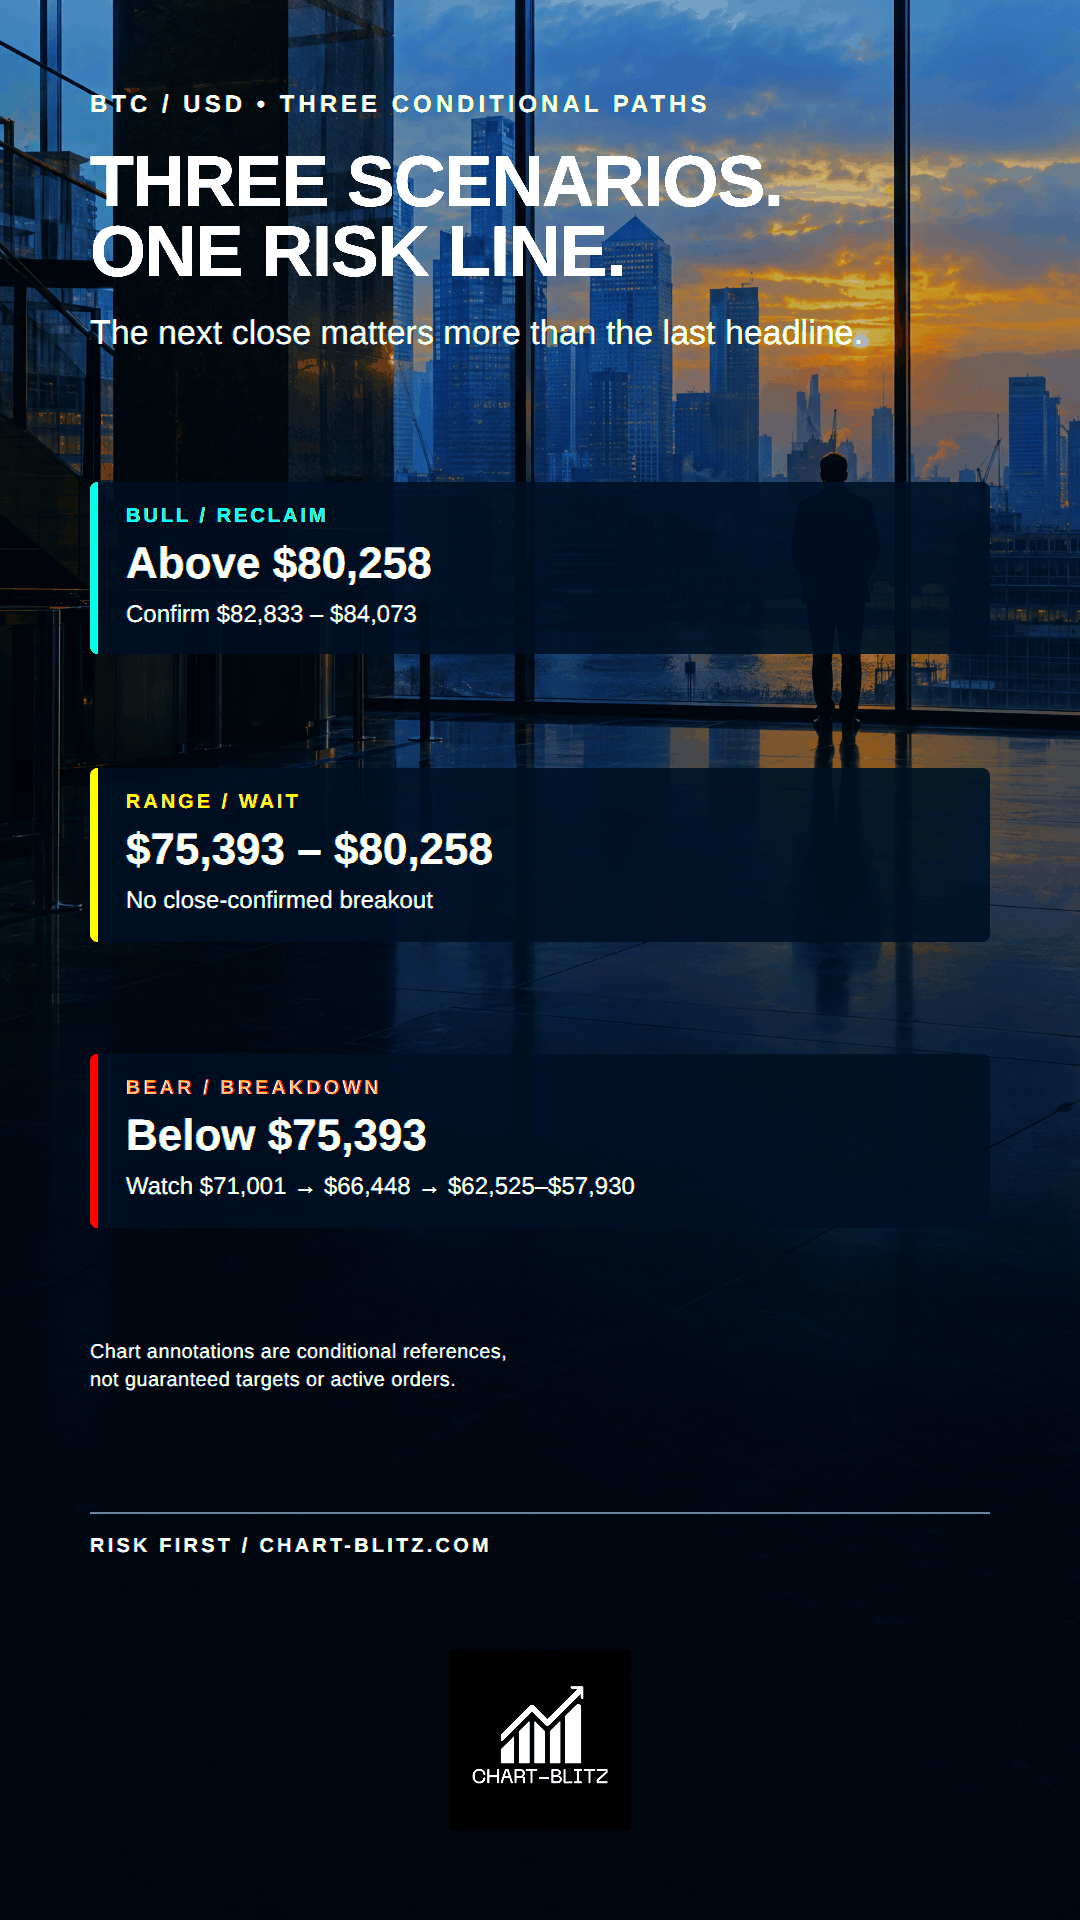
🟢 Bull case: reclaim $80,258, confirm through $82,833–$84,073
Trigger: four-hour reclaim of $80,258, confirmed by a daily close and a successful retest. A break through $82,833–$84,073 strengthens repair; $94,226 is a higher reference, not a guaranteed destination. Invalidated by a fall back below $80,258 after breakout or a weekly close below $75,393. Buyers must defend the retest; wait for confirmation rather than FOMO.
🟡 Neutral case: range from $75,393 to $80,258
If BTC holds above $75,393 but cannot reclaim $80,258, it may churn inside the range. The trigger is sustained trading there, not a wick. Avoid chasing the middle; reassess boundary closes and follow-through. A weekly close out of range with confirmation invalidates neutrality. For limited funds, avoiding a low-quality trade can beat guessing one candle.
🔴 Bear case: lose $75,393; monitor $71,001, $66,448, then lower references
Trigger: daily or weekly close below $75,393, followed by a failed reclaim. First reference $71,001; if selling persists, monitor chart annotation $66,448, weekly $62,525 and $58,035, and daily $57,930. None is guaranteed or an automatic short. Do not chase a straight fall toward $66,448; wait for a breakdown and rejected retest. A quick reclaim of $75,393 withdraws the bearish thesis. News may catalyse; the close and failed retest confirm. Do not mistake a stop run for a finished decline.
🧾 Trading and re-entry plan: manage risk before managing pride
At $76,087 BTC is about $694, or less than 1%, above the $75,393 chart annotation; $80,258 is roughly 5.5% higher. Opening before that buying condition leaves ordinary noise room to hit a narrow stop. This is not a margin of safety, and an annotation is not a personal risk limit.
Long plan: Wait for a four-hour close above $80,258 and daily confirmation. Assess whether a $80,258–$82,833 retest holds before any small, pre-risked conditional trade. A break and hold above $84,073 is more conservative; $94,226 is a higher-timeframe resistance reference. Set stops to entry structure and risk budget; $75,393 is not automatically suitable. If $80,258 fails, cancel the chase rather than widening the stop.
Short plan: Wait for a clear failure of $75,393, preferably on a daily or weekly close, then see whether a rebound turns it into resistance. $66,448 is a candidate zone, not a current short signal. Do not chase a fall into support; reassess $71,001, $62,525, and $58,035/$57,930 in sequence. A sustained reclaim of $75,393 weakens the short; reclaiming $80,258 requires reviewing the broader bearish thesis.
Re-entry rule: After a stop, pause. Wait for a new four-hour close and check daily alignment. Record trigger, invalidation, and maximum loss before re-entry. After a >5% 24-hour move, volatility can hit fixed-distance stops; control exposure with position size, not an ever-wider stop. Leverage can magnify losses; limited-capital readers should not borrow or increase leverage because of this article. Levels are annotations, not advice or guaranteed targets; this is not individualized financial advice.
✅ Conclusion: the headlines explain the shock; the close decides the next move
The decline came amid a technology-stock rout, softer risk appetite, reported spot selling, and leveraged liquidations. These help explain acceleration, not prove a durable low. Weekly structure remains concerning; daily BTC near $76,000 lies between $71,001 and $84,073; monthly volatility has not confirmed a cycle reversal; four-hour price faces descending angles and $80,258. Upside needs that reclaim; downside risk centres on $75,393 closes. Between them, no trade may be best.
The lasting lesson from a bank trading desk is not “always predict correctly.” It is knowing what evidence would justify taking more risk. Do not let a headline place the trade for you; do not let a beautiful indicator line exempt you from a stop.
I will continue to closely monitor the price action of this Crypto. As soon as a critical reversal signal appears on the charts, I will update my analysis and insights right here immediately. Remember to Bookmark this page and come back often to check for the latest updates!
Want to see our full, interactive chart breakdown? If you want to learn how to draw weekly VPFR, Fibonacci, EMA Ribbon, MACD, Supertrend, and S/R Flip frameworks designed for real trading decisions. Please browse the following『Further Reading』links. Fundamental news tells you what happened. Technical analysis predicts what will happen. To master the professional framework that separates market signal from noise, explore our exclusive models at https://www.chart-blitz.com/fxcx-app/omni-chart.html?symbol=BTC.
📚Further Reading:
To help everyone gain a deeper understanding of the various technical indicators mentioned in this article, we have specially prepared the following further reading materials. These cover key analytical tools found across the weekly, daily, monthly, and 4-hour charts.
- Decoding Fibonacci Retracement: The Perfect Blend of Natural Law and Market Psychology — Fibonacci Retracement is not just a set of magical numbers; it is a manifestation of market psychology. Learning how to correctly draw and interpret Fibonacci levels is a required course for every serious trader.
- Is a Major Move Hiding in Plain Sight? Dow Theory May Already Know the Answer — As retail traders continue to chase short-term signals, experienced market readers are looking deeper — into trend structure, volume behavior, and market phases that may expose the early clues of a coming breakout.
- Understanding VPFR: Finding the Hidden Footprints of Market Makers — The Volume Profile Fixed Range (VPFR) is a powerful tool that tells us where the most trading occurred within a specific price range. This helps us identify true support and resistance levels, as well as potential ‘Vacuum Zones’.
- S/R Flip Support and Resistance Swap Strategy — S/R Flip is one of the most powerful concepts in technical analysis. This article uses real cases to teach you how to use S/R Flip to capture the highest win-rate trading opportunities.
- MACD Momentum Indicator Momentum First — What Does the MACD Line Crossing Above Zero Mean? Golden Cross & Divergence Signals!
- Gann Fan Masterclass — Deep dive into W.D. Gann’s angle theory to identify the geometric relationship between time and price in the market.
- Strategies for EMA Ribbon Bearish Alignment: Dead Cat Bounce or Real Reversal — Deep dive into the EMA Ribbon to understand the battle between short-term and long-term capital.
- Bollinger Band: Long-Term Repricing Zone — The Ultimate Tool to Capture Massive Market Moves Tired of getting shaken out of winning trades too early? Or buying right before a trend reverses? An ex-banker reveals how to use the Bollinger Band to filter out market noise and ride the big waves.
- KDJ Stochastic Indicator Bottom Confirmation — What is the implication of a downward-curving KDJ? Understand in one article how to use dynamic indicators to catch market turning points.
【Disclaimer】 The content herein is for educational purposes and reflects the author’s personal opinion only; it is not investment advice. All financial investments, including cryptocurrencies, carry significant risk, and you could lose your entire capital. To support this site, this article may contain affiliate links. While we strive for accuracy, we cannot guarantee all information is complete or error-free. Please conduct your own research and be fully responsible for your own investment decisions.