Fetching Live Market Data...
When you make a trade, you should have a clear target of where you expect to get out
William Delbert Gann – 1949
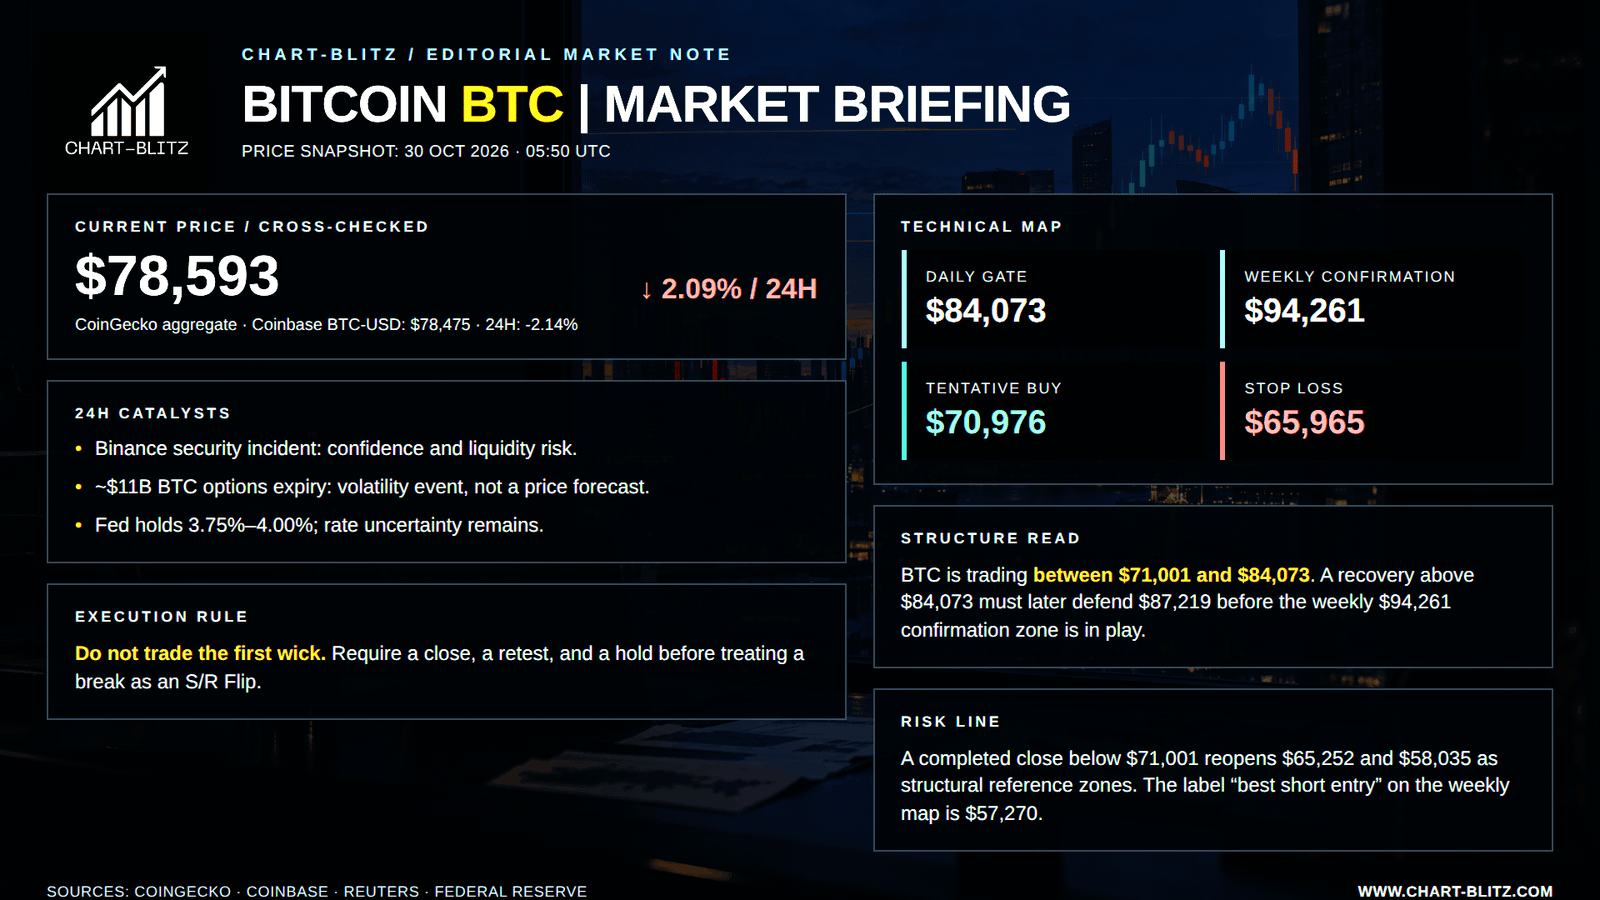
A Security Shock Does Not Override the Chart. A Bitcoin bounce is not a reversal; it is an invitation to prove that sellers have lost control. BTC/USD was $78,593 at the analysis baseline, down 2.09% in 24 hours on CoinGecko at 05:50:07 UTC on 30 October 2026. Coinbase BTC-USD was $78,475.09, down 2.14%; that small difference reflects normal venue and aggregation dispersion, not a signal.
Reuters reported that Binance disclosed a security breach with an estimated $6.3 billion impact, while roughly $3 billion had been located or frozen. Deposits and withdrawals were temporarily suspended during wallet-infrastructure checks. Binance said user funds remained safe and it would cover hacking losses; that is the company’s statement, not an independently completed loss audit. Reuters said Bitcoin fell more than 3% to a six-week low of $76,368 in early Asian trade.
A headline this charged can make every green candle look heroic. On a former bank dealing-room floor, a headline is a fire alarm in a crowded station: it makes everybody run, but does not reveal which exit is open. The useful questions are where stops sit, where trapped longs may sell into a bounce, where shorts must cover, and—above all—where the completed candle closes. News creates the object of analysis; price structure determines timing and method.
🗺️ $78K Is a Location, Not a Verdict
BTC trades between the daily $71,001 Fibonacci 0.500 level and $84,073 Fibonacci 0.382 level. It is inside an unresolved range, not above a confirmed support after a clean breakout. A rebound from a six-week low can be tradable without becoming a weekly reversal.
Strategy’s third-quarter release said it held 848,517 BTC as of 25 October at an average cost near $75,446. CoinDesk cited Glassnode’s estimate that U.S. spot Bitcoin ETF buyers paid about $81,500 on average. Those figures may shape defence, disappointment, de-risking, or relief; they are not live support or resistance. Calling a corporate cost basis “support” is like calling a bank’s mortgage book a guarantee that every house price must rise: an exposure is not a promise. Only price acceptance confirms trend.
【📊Analysis Baseline Statement】
All technical analyses below are based on the price snapshot locked on October 30, 2026 (EST): 01:29 Bitcoin (BTC) = $78,486 USD. Please treat this report is an analytical map, not a live executable quote. Fragmented crypto venues can differ by a few dollars; every decision must be checked against the same venue and a completed candle before action is considered.
💡Four frames. One question: did it hold?
The Price and Timestamp above are the print this piece froze at the close of writing — not the tape now. Markets move; the copy does not. The only check that matters is whether that freeze still holds. Open Chart Grid: One name, Four frames, locked Weekly → Daily → Monthly → 4-Hour, the article’s print against the live chart. You do not pick timeframes, and you should not trust the headline. Hold or break: you decide.
📰 News Analysis: Catalysts Create Volatility, Not a Target
The Binance incident is a confidence and liquidity catalyst that can widen spreads, alter exchange-risk perceptions, and accelerate forced risk reduction. The public record supports a qualified description—estimated impact, temporarily located or frozen assets, operational checks, and a company assurance—not certainty about final losses or recovery. 3
A second same-day event requires the same discipline. Bloomberg reported roughly $11 billion of Bitcoin options due to expire on Deribit on 30 October. Decrypt reported about 135,000 BTC in contracts and stressed that $11 billion is notional or face value, not cash that must automatically trade in spot markets. 6 7 Expiry can affect hedging, liquidity, and realised volatility; it does not forecast direction, guarantee a pin, or create a target.
The macro backdrop is mixed. The Federal Open Market Committee kept its target range at 3.75%–4.00%, said inflation remained elevated, and recorded two votes for a 25-basis-point increase. Reuters described risk-off technology shares alongside the Binance shock while Treasury yields fell. 9 Falling yields and weak risk appetite can coexist. The relevant question is not whether news sounds bullish or bearish, but whether it produces acceptance above $84,073 or below $71,001.
🧭 Weekly Analysis: $87,219 Is a Counterattack; $94,261 Is the Examination
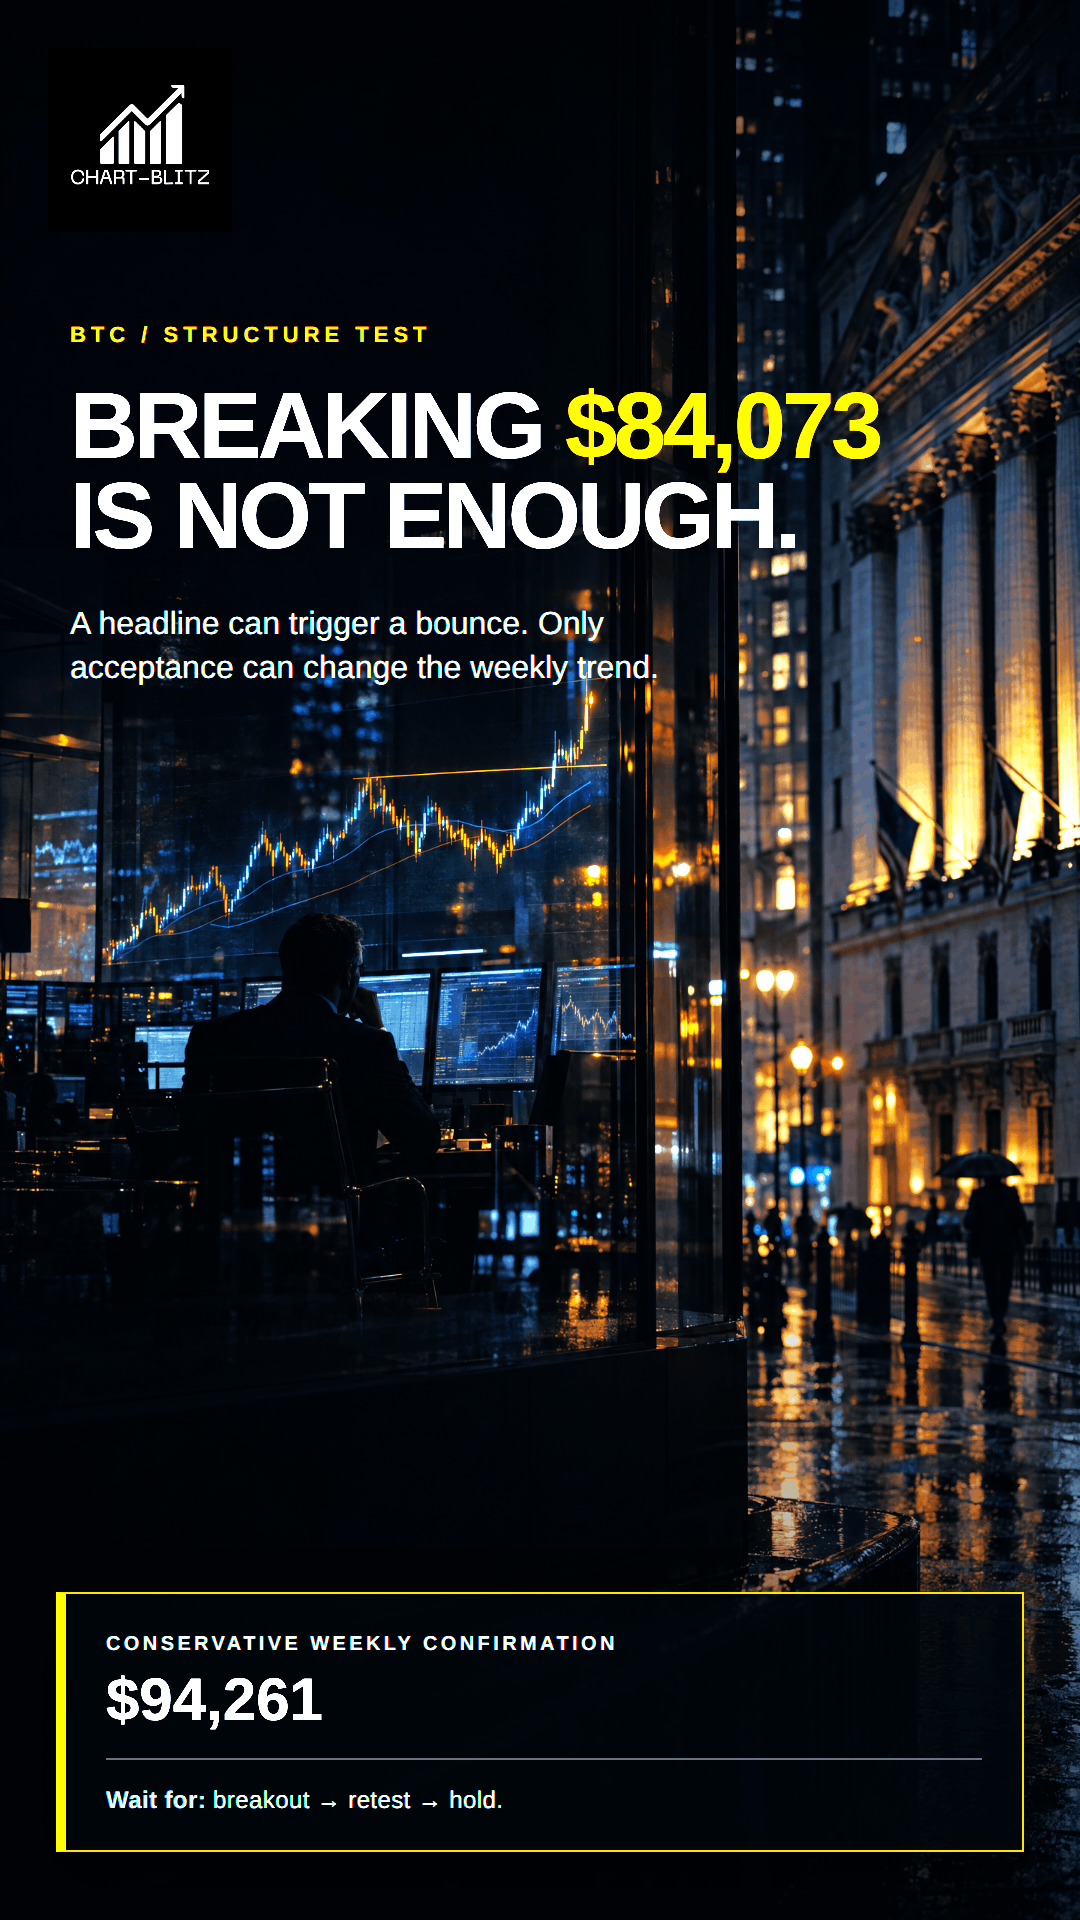
🧱 Dow Theory: One Higher High Does Not Repair a Downtrend Dow Theory asks whether swings form lower highs and lower lows or higher highs and higher lows. The weekly sequence is explicit: Swing High $125,725; Swing Low $107,389; Lower High (1) $97,939; Lower Low (1) $80,537; Lower High (2) $82,833; Lower Low (2) $65,252; and Lower Low (3) $58,035. The later Higher High at $87,219 broke above the $82,833 Lower High, a meaningful counterattack.
Weekly Timeframe for BTC (Bitcoin)
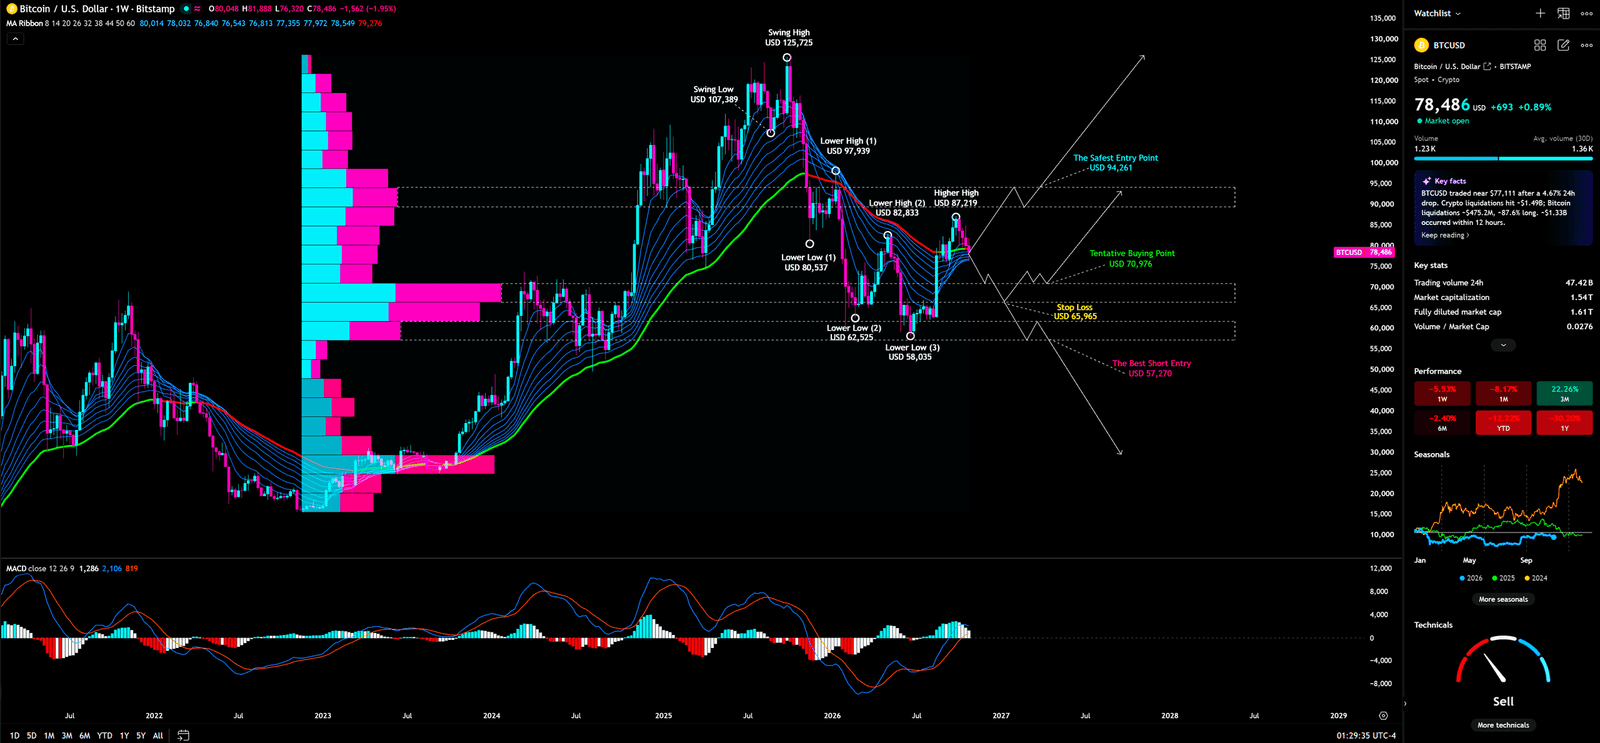
It is not a complete uptrend until price forms and defends a Higher Low. Retaking one street is not the same as holding a city. Between $82,833 and $87,219, short covering can coexist with genuine buying. Retail may call the first fast candle a breakout; disciplined capital asks whether the pullback is shallow, the next low is defended, and value can later be accepted above resistance. A Higher High shows pressure; a defended Higher Low shows control.
🌊 EMA Ribbon: A Trend Thermometer, Not an Entry Button
An EMA Ribbon combines exponential moving averages from several periods into a dynamic band. It helps reveal trend slope, compression, expansion, and a broad cost area; it is not a magical crossing. A wide, upward-fanning ribbon suggests directional consensus, while a compressed, tangled, or repeatedly penetrated ribbon signals indecision or re-pricing.
The weekly ribbon near recent price action is compressed, not a fresh bullish fan. Price must reclaim and hold the band as a zone; a touch only tests it. Retail can mistake clearance of one fast average for repair. Institutions watch whether a retest of the full band survives and whether it turns and fans upward. A weekly close back through the ribbon after a rally means the move supplied liquidity, not confirmation.
🧲 VPFR: A High-Volume Shelf Is Friction, Not a Safety Net
Volume Profile Fixed Range (VPFR) allocates volume by price rather than time. Its longest horizontal bar is usually the Point of Control, or the selected range’s greatest activity. High-volume nodes are accepted areas where price often slows; low-volume nodes are relatively rejected areas where price can travel quickly toward the next node.
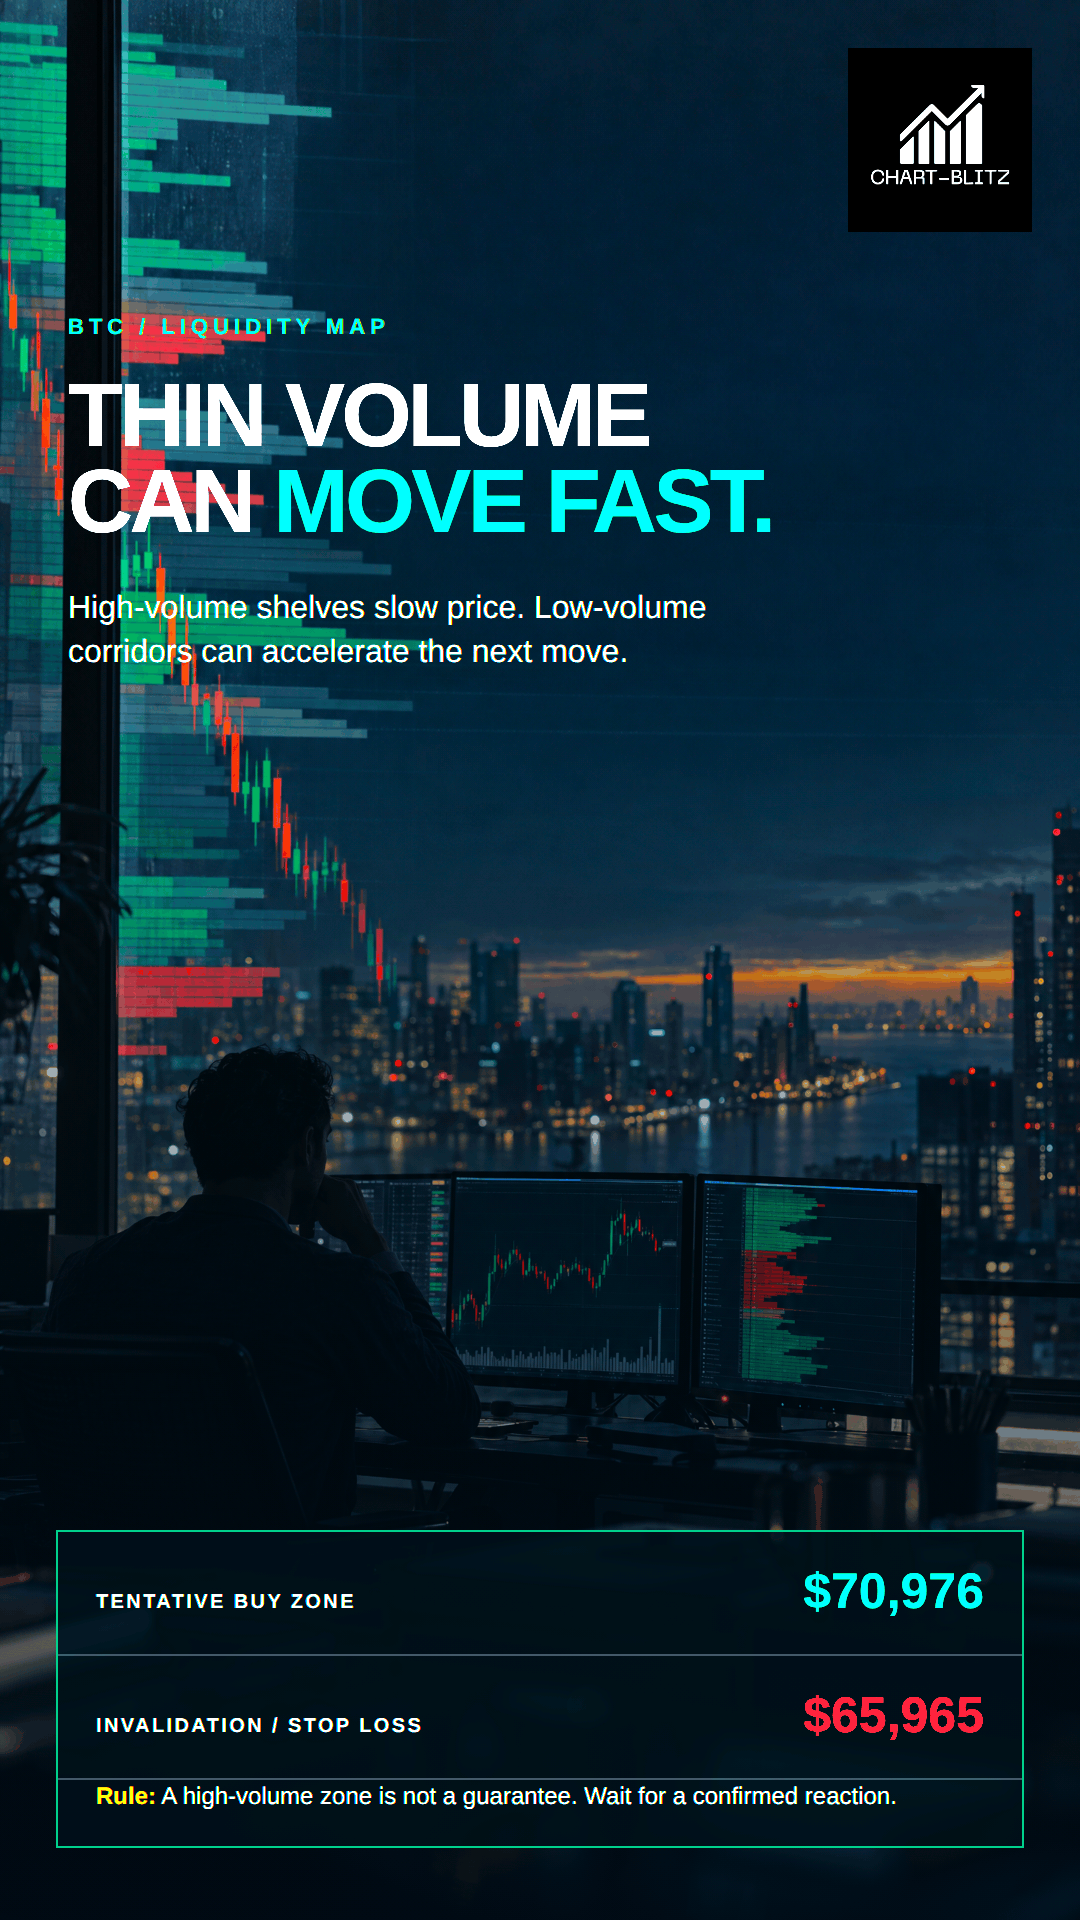
The weekly profile has no readable numeric POC, VAH, or VAL label, so none should be invented. Its broad low-to-mid-$60K high-volume shelf aligns with the $65,965 stop-loss annotation and must be treated as a zone, not a decimal-perfect defence line. A shelf can absorb selling and encourage rebalancing. If price closes decisively below it, expected buyers can become overhead supply on the next bounce.
Think of a bank vault corridor during a run: a crowded corridor slows traffic because participants collide, but does not lock the door. If flow breaks into a thin corridor, speed can increase. That is a VPFR Vacuum Zone—not an inevitable crash, but less local traded-volume friction if acceptance below the node develops. $65,965 is the invalidation of the tentative long-side thesis.
📉 MACD: Less Downward Momentum Is Not an Uptrend
MACD measures the gap between a fast and slow exponential moving average. Its signal line smooths that gap, and its histogram shows the distance between them. Weekly histogram bars have improved to small positive readings and the lines appear to turn higher, showing that downside momentum has cooled.
That does not prove a mature bull trend or sustained expansion far above the zero line. It can reflect short covering, bargain hunting, or the first stage of recovery. The decision test is whether improving momentum is confirmed by price reclaiming and holding resistance. Retail often uses an early MACD turn to front-run reversal; institutions use it to test overhead supply. MACD is a brake-distance gauge, not a steering wheel.
🛑 Weekly Verdict The downtrend remains the default until invalidated. $84,073 is the first daily validation gate, $87,219 is the weekly counterattack level, and $94,261—the chart’s “The Safest Entry Point”—is the conservative weekly confirmation zone. It is not a promise of upside; it is where buyers begin to replace stories with structure. Enter only after accepted S/R Flip conditions; exit if the stop condition is reached.

📐 Daily Analysis: Until $84,073 Is Reclaimed, $71,001 Is the Centre of Gravity
🧮 Fibonacci Retracement: Reaction Zones, Not Obligations
A Fibonacci retracement maps watched proportions of a completed swing—0.236, 0.382, 0.500, 0.618, and 0.786. It is a market-psychology map because participants anchor orders and expectations around familiar levels, not a compulsory reversal formula.
Daily Timeframe for BTC (Bitcoin)
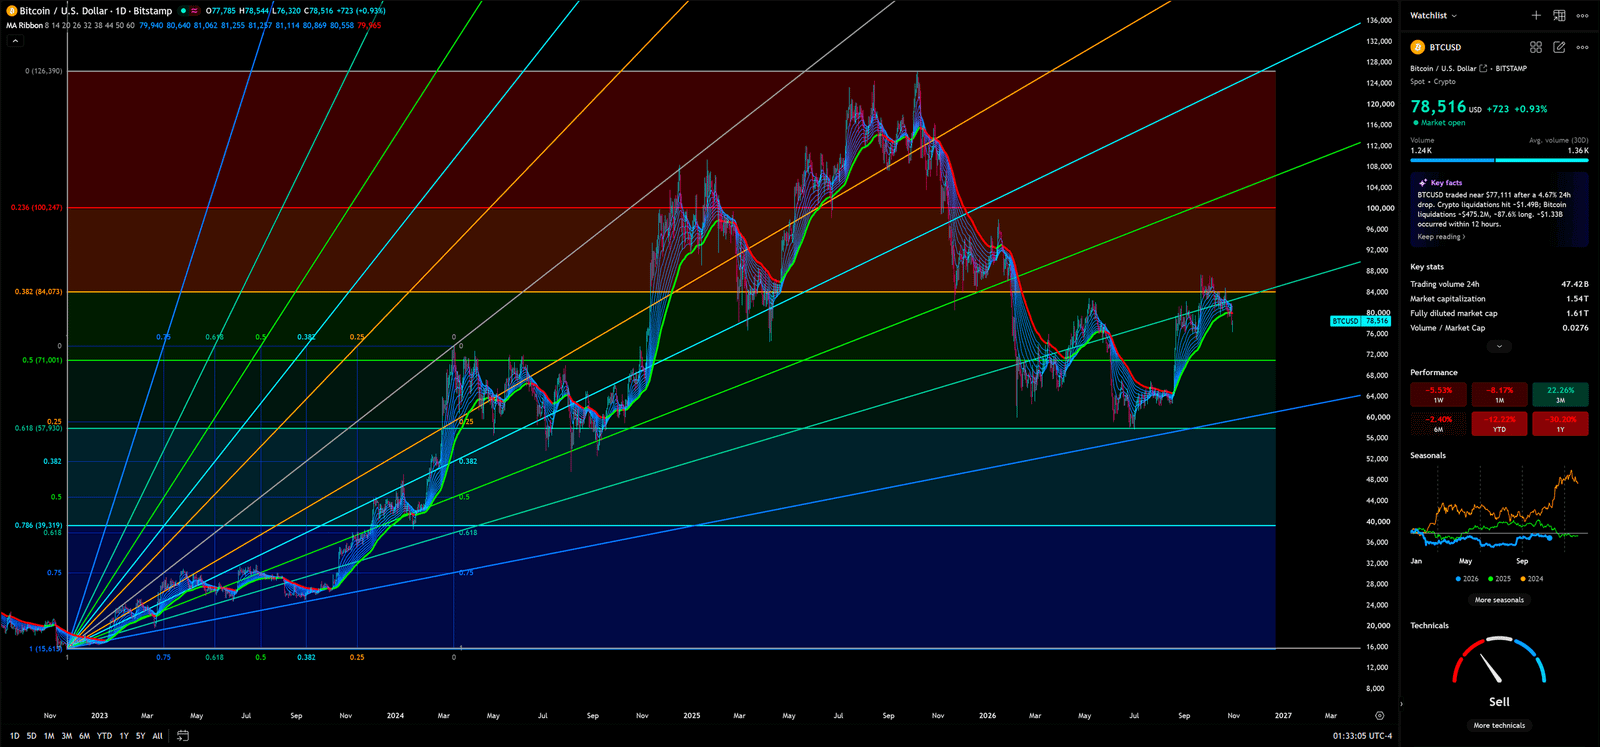
The daily grid marks $126,390 at 1.000, $102,147 at 0.236, $84,073 at 0.382, $71,001 at 0.500, $57,930 at 0.618, and $39,191 at 0.786. BTC is between 0.500 and 0.382: a decision range, not a clean long zone. The constructive sequence is a daily body close above $84,073 followed by a retest that holds as support. Only then does $102,147 become relevant. $84,073 is the first door; $71,001 is a midpoint, not an automatic dip-buy command.
📏 Gann Fan: Dynamic Geometry Needs Price Confirmation
Gann angles relate price movement to time and function as dynamic support and resistance paths. Their anchor and chart scale matter, so they are never self-validating. Here, the fan matters only as confluence: when a diagonal, Fibonacci level, and price structure meet near $71,001 or $84,073, the area warrants attention rather than a blind order.
The valid sequence is close through, retest, then continuation. Capital tests depth at confluence; retail often trades the first touch. A push through a line can trigger clustered stops before price returns to judge whether participants defend it. The only Gann signal worth trading is acceptance, not a touched line.
🧵 Daily EMA Ribbon: Treat a Cost Area as an Area
The daily EMA Ribbon is a medium-term trend filter. Crossing a few short averages says little about whether the wider participant base has shifted. The valuable event is compression turning into expansion while price holds above the whole ribbon through a retest. BTC remains below the $84,073 resistance gate. A daily close above it, successful retest, and turning ribbon would make recovery tradeable; rejection below it means lower value remains accepted. Hold $84,073 before discussing $102,147; lose $71,001 and downside structure must be retested.
🌙 Monthly Analysis: A Large Cycle Has Not Issued Permission to Chase
🎈Bollinger Bands: Volatility Measures Stretch, Not Direction Bollinger Bands place a moving-average centreline between upper and lower bands that expand or contract with volatility. A squeeze indicates compression, not future direction. In a strong trend, price can walk an outer band longer than a counter-trend trade can tolerate.
Monthly Timeframe for BTC (Bitcoin)
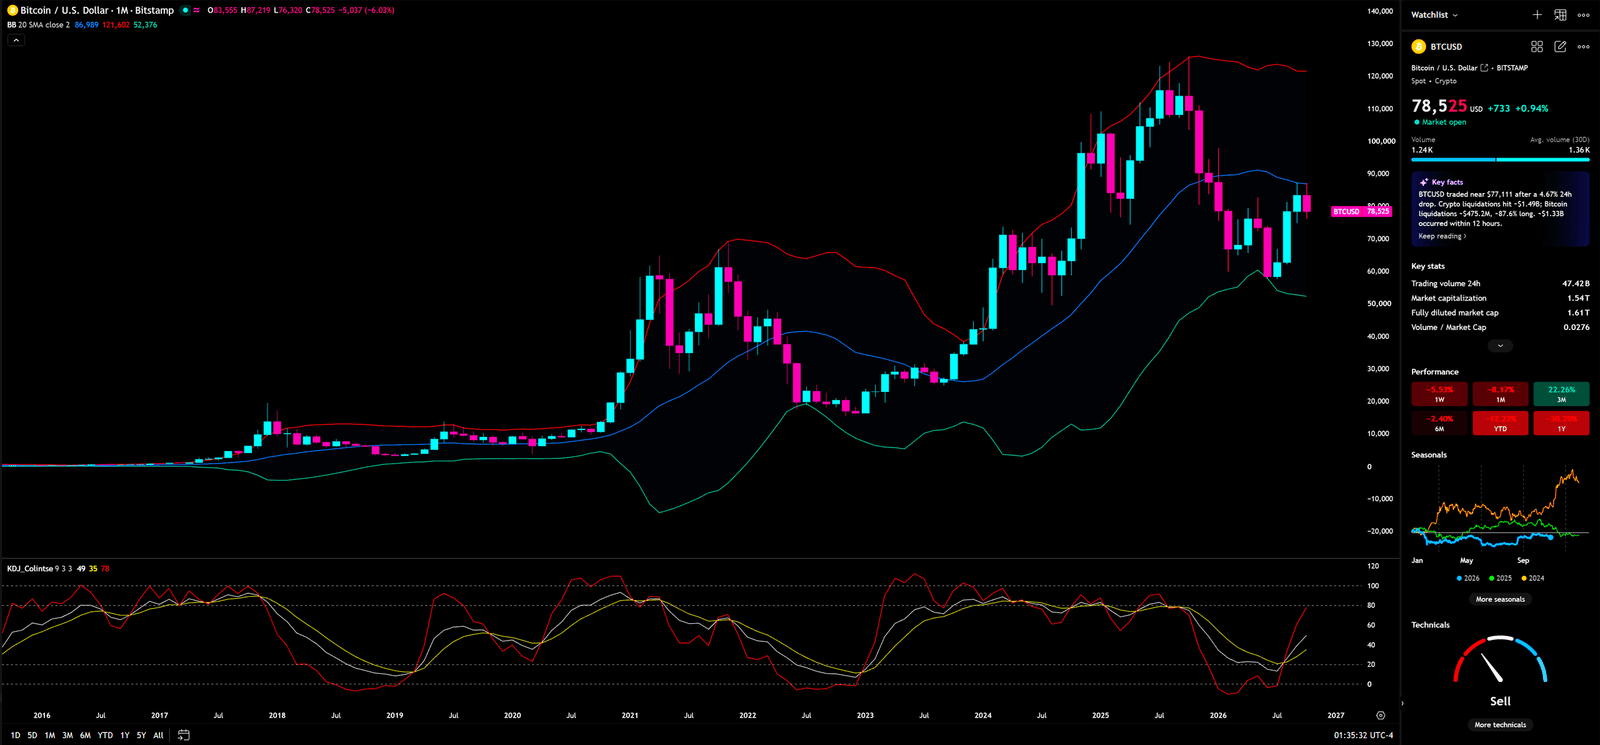
BTC is below the monthly middle-band region and above the lower band. That does not complete a long-cycle recovery; it shows that the centre of the volatility range has not been reclaimed. Retail may read proximity to the lower band as “oversold equals buy.” Institutional capital knows that price can keep pressing an outer band while distribution or de-risking continues. Without a middle-region reclaim or higher-timeframe structural confirmation, a short-term bounce is a trade, not a belief system.
⚙️ KDJ: The J Line Turns First—and Can Mislead First
KDJ tracks where the close sits within a recent high-low range through K, D, and the more sensitive J line. J normally turns first, making it an early warning and a noise risk. The monthly panel rises from a depressed area with the responsive line leading, warning against assuming downside momentum is permanently one-way.
It does not authorise a full long position. An oscillator can recover briefly before rolling over. The flow could be gradual accumulation, short covering, or slowing liquidation. Monthly KDJ is early warning; weekly and daily price grant entry approval
🧩 Four-Hour Analysis: An Execution Trigger, Not a Weapon Against the Weekly Chart
The four-hour panel shows a radiating price-time grid, 0.25 and 0.382 guide markings, and repeated interactions with dynamic lines. Its message is not that the next candle must rise or fall; single penetrations are especially vulnerable to false-break interpretation.
4-Hour Timeframe for BTC (Bitcoin)
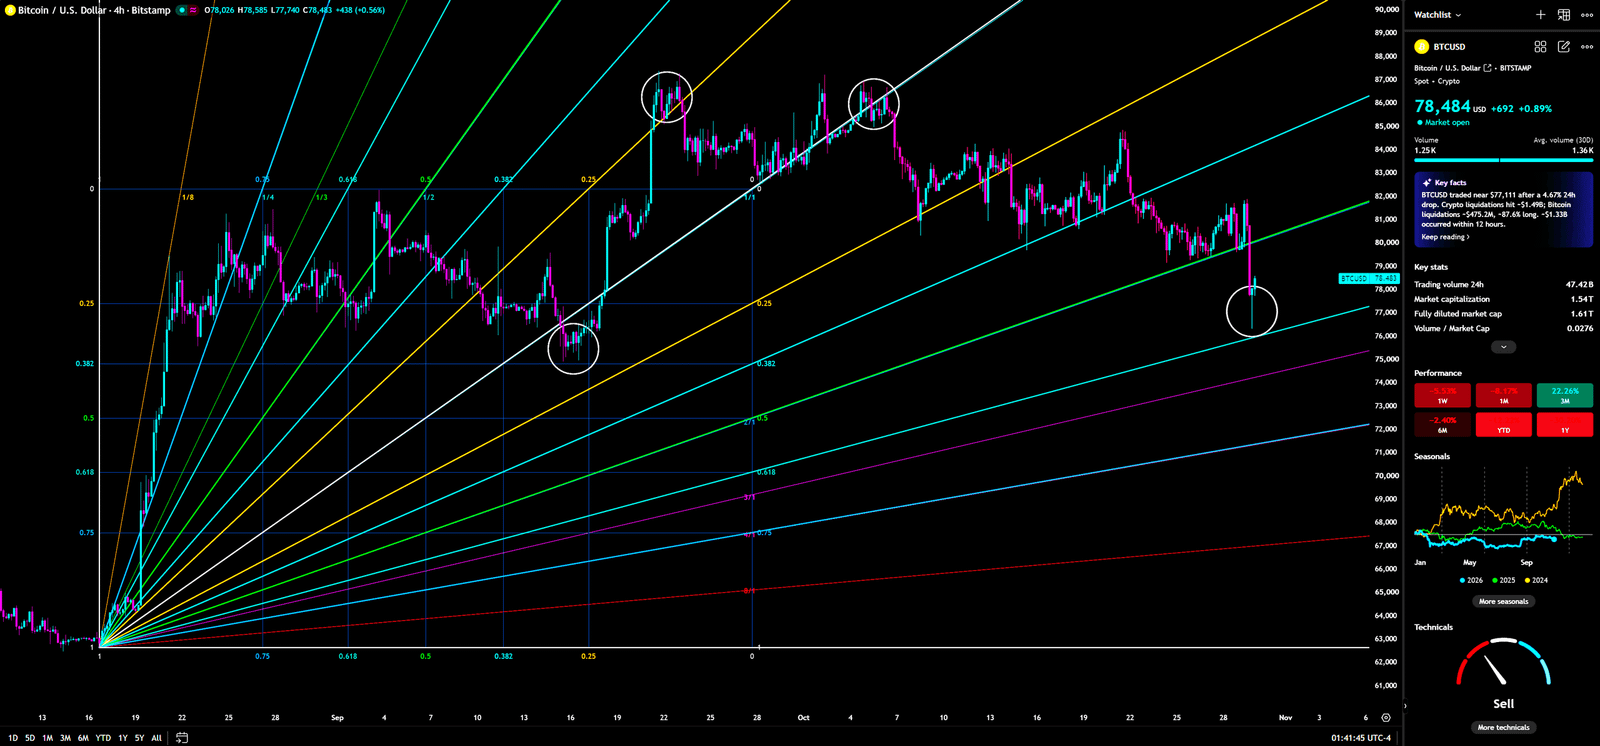
Use the frame only near a higher-timeframe condition: $84,073, $71,001, or $70,976. Require a completed four-hour close through a local obstacle, a retest that holds, and a continuation candle aligned with the daily and weekly map. A reversal against intact weekly resistance is a tactical bounce, not a position to marry. Fast traders may sweep a stop cluster and create urgency; the retest reveals who controls the level. The four-hour chart does not predict; it prevents paying the most expensive price for a valid idea.
🎭 Retail vs. Institutions: Same Price, Different Questions
Retail sees a security headline, a sharp decline, rising KDJ, and a bounce around $78K, then asks whether buying now avoids missing the move. Institutional participants ask whether $84,073 becomes a daily accepted price, whether $87,219 survives a pullback as a weekly structure point, whether $94,261 flips into support, and whether supply is absorbed near $70,976 or heading for $65,965.
This is process, not mystical access. On a former bank FX desk, a large order is managed around liquidity, risk limits, known stop zones, and the probability that a level holds after execution—not merely someone’s bullish opinion. Retail trades the story; institutions trade acceptance or rejection of the story. Converting possibility into certainty before the close arrives is costly tuition.
🔮 Three Scenarios: Pre-Write the Response
🟢 Scenario One: Buyers Regain Control
Trigger: BTC records a daily body close above $84,073, clears and successfully retests the weekly $87,219 Higher High, and, for the conservative add-on, accepts above $94,261. The four-hour chart must show breakout, retest, and continuation rather than an extended wick.
References and invalidation: $94,261 is confirmation, not an assumed destination. Above it, $102,147 is the next Fibonacci reference and $126,390 a more distant structural reference. Invalidate the long case if price breaks $84,073 but closes back below it and cannot reclaim it, or decisively loses $71,001. The S/R Flip then failed.
🔴 Scenario Two: The Downtrend Resumes
Trigger: BTC closes below $71,001 daily and the weekly frame accepts below the $70,976 tentative-buy annotation. A completed close below $65,965 invalidates the recovery thesis around the high-volume shelf.
References and invalidation: First references are $65,252 and $58,035. The $57,270 “The best Short Entry” label is a printed structural observation zone, not a promise of arrival or short instruction. Invalidate the break if BTC rapidly reclaims $71,001 and builds a confirmed four-hour S/R Flip above it; downgrade it as a likely failed move and remap.
🟡 Scenario Three: The Range Grinds Both Sides
Trigger: Price remains between $71,001 and $84,073, the daily ribbon stays compressed, and four-hour false breaks recur at both edges.
Response: Do not trade the middle. Wait for an edge to close through, retest, and hold. Capital is rebalancing; the range centre is a liquidity pool, not an advantage. No trend does not require inventing a trade.
🛡️ Trading Plan and Conditions: Replace Desire With Rules That Can Fail
Conservative long plan: Do not chase $78K because the narrative improved. Require daily reclaim of $84,073, weekly validation above $87,219, and recovery plus retest of $94,261 for the strongest long-side setup. $102,147 is the first measurable reference after confirmation; reassess rather than assuming $126,390 is owed. If the S/R Flip fails, exit; do not add risk to defend an opinion.
Aggressive but controlled pullback plan: $70,976 is a Tentative Buying Point, not an order ticket. A small-risk attempt requires a four-hour local-resistance break, a held retest, and a daily candle that remains above or quickly reclaims $71,001. The invalidation is $65,965. If price travels directly toward that level, do not average down or move the stop farther away.
Defensive or short-side framework: After a daily close below $71,001, do not chase the first liquidation candle. Seek a pullback that fails to reclaim the level; use $65,252 and $58,035 as structural references. $57,270 is not certain. Spot holders may use the framework to reduce risk, not as a derivatives-execution recommendation.
Elliott Wave risk filter: The technical map has no readable Elliott labels, so no live 1–2–3–4–5 count is imposed. If a future impulse count is proposed, Wave 4 must never overlap Wave 1’s top. Overlap invalidates the impulse thesis and may indicate a larger A–B–C correction. This is a risk discipline, not a prediction.
✅ Conclusion: Let the Market Submit Its Work Before You Grade It
BTC has not proved strength, but it offers an unusually clear map. Upside tests are $84,073, $87,219, then $94,261; downside defences are $71,001, $70,976, then $65,965. That conditional map is more valuable than an all-in slogan because it turns emotion into auditable decisions.
The bounce is not invalid; it is unconfirmed. Preserve capital for a close, retest, and defined invalidation. Market theatre can be entertaining and occasionally profitable, but it is never a reason to abandon risk discipline.
I will continue to closely monitor the price action of this Crypto. As soon as a critical reversal signal appears on the charts, I will update my analysis and insights right here immediately. Remember to Bookmark this page and come back often to check for the latest updates!
Want to see our full, interactive chart breakdown? If you want to learn how to draw weekly VPFR, Fibonacci, EMA Ribbon, MACD, Supertrend, and S/R Flip frameworks designed for real trading decisions. Please browse the following『Further Reading』links. Fundamental news tells you what happened. Technical analysis predicts what will happen. To master the professional framework that separates market signal from noise, explore our exclusive models at https://www.chart-blitz.com/fxcx-app/omni-chart.html?symbol=BTC.
📚Further Reading:
To help everyone gain a deeper understanding of the various technical indicators mentioned in this article, we have specially prepared the following further reading materials. These cover key analytical tools found across the weekly, daily, monthly, and 4-hour charts.
- Decoding Fibonacci Retracement: The Perfect Blend of Natural Law and Market Psychology — Fibonacci Retracement is not just a set of magical numbers; it is a manifestation of market psychology. Learning how to correctly draw and interpret Fibonacci levels is a required course for every serious trader.
- Is a Major Move Hiding in Plain Sight? Dow Theory May Already Know the Answer — As retail traders continue to chase short-term signals, experienced market readers are looking deeper — into trend structure, volume behavior, and market phases that may expose the early clues of a coming breakout.
- Understanding VPFR: Finding the Hidden Footprints of Market Makers — The Volume Profile Fixed Range (VPFR) is a powerful tool that tells us where the most trading occurred within a specific price range. This helps us identify true support and resistance levels, as well as potential ‘Vacuum Zones’.
- S/R Flip Support and Resistance Swap Strategy — S/R Flip is one of the most powerful concepts in technical analysis. This article uses real cases to teach you how to use S/R Flip to capture the highest win-rate trading opportunities.
- MACD Momentum Indicator Momentum First — What Does the MACD Line Crossing Above Zero Mean? Golden Cross & Divergence Signals!
- Gann Fan Masterclass — Deep dive into W.D. Gann’s angle theory to identify the geometric relationship between time and price in the market.
- Strategies for EMA Ribbon Bearish Alignment: Dead Cat Bounce or Real Reversal — Deep dive into the EMA Ribbon to understand the battle between short-term and long-term capital.
- Bollinger Band: Long-Term Repricing Zone — The Ultimate Tool to Capture Massive Market Moves Tired of getting shaken out of winning trades too early? Or buying right before a trend reverses? An ex-banker reveals how to use the Bollinger Band to filter out market noise and ride the big waves.
- KDJ Stochastic Indicator Bottom Confirmation — What is the implication of a downward-curving KDJ? Understand in one article how to use dynamic indicators to catch market turning points.
【Disclaimer】 The content herein is for educational purposes and reflects the author’s personal opinion only; it is not investment advice. All financial investments, including cryptocurrencies, carry significant risk, and you could lose your entire capital. To support this site, this article may contain affiliate links. While we strive for accuracy, we cannot guarantee all information is complete or error-free. Please conduct your own research and be fully responsible for your own investment decisions.