Fetching Live Market Data...
When you make a trade, you should have a clear target of where you expect to get out
William Delbert Gann – 1949
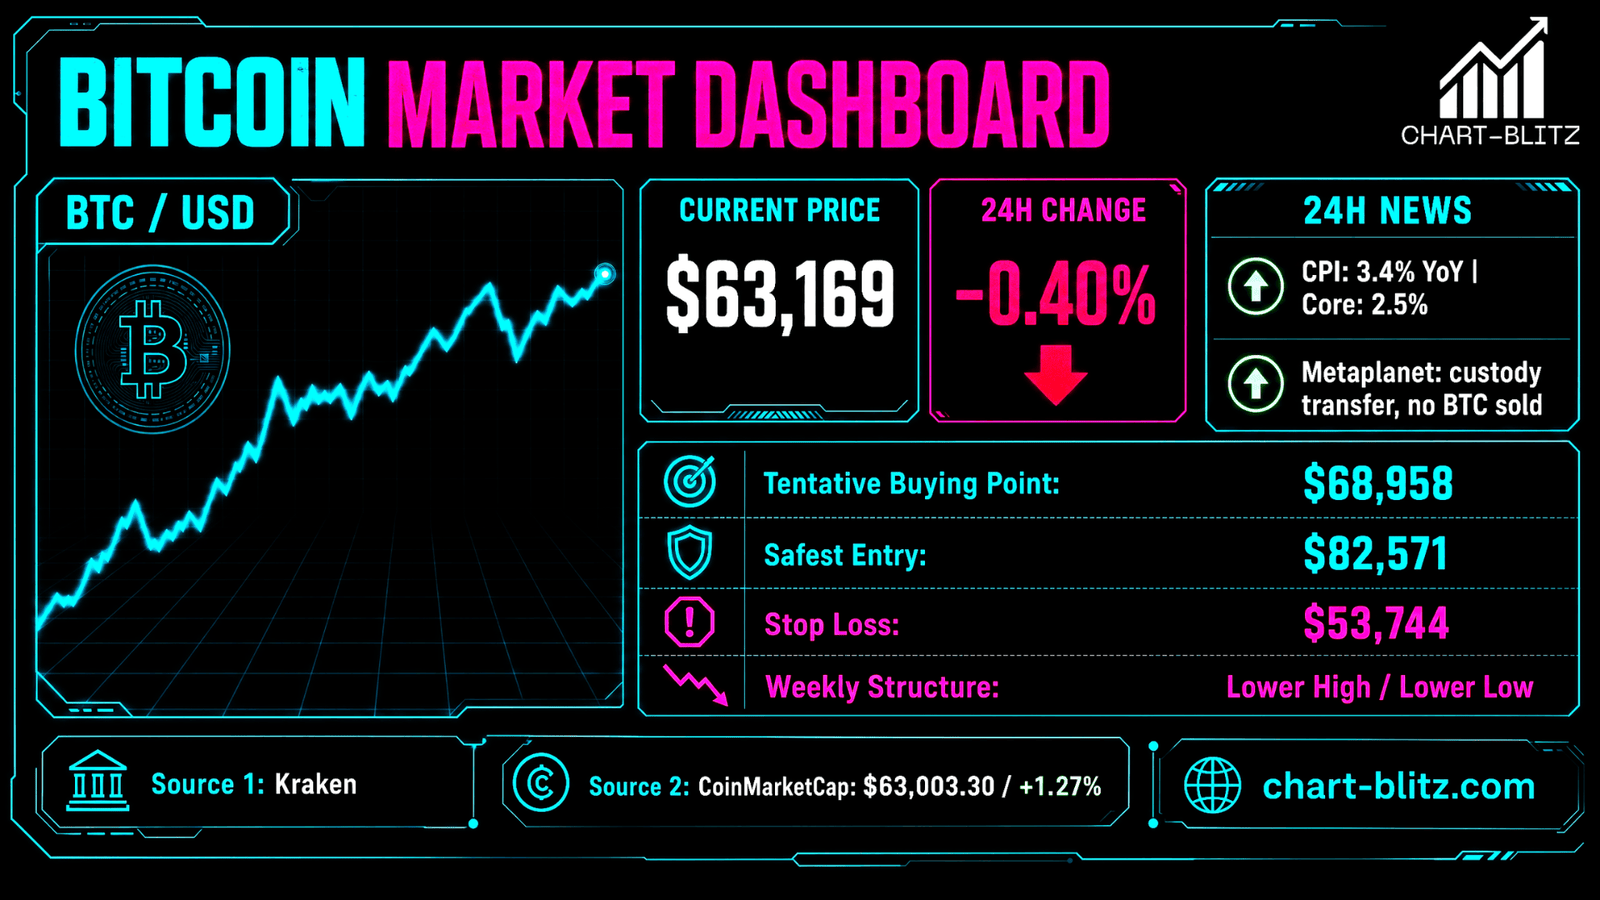
Bitcoin is currently behaving like a bank vault with the warning light on while impatient traders keep pressing the elevator button. The headline backdrop has not been hostile. July U.S. CPI printed at 3.4% year over year, core CPI eased to 2.5%, and Metaplanet said a 5,014-BTC transfer was a routine custody operation rather than a sale. Under the retail playbook, that combination should have pushed BTC cleanly through $64,000. Instead, the market stalled, the breakout failed, and volume softened.
That is the conflict that matters. News supplies the narrative; price supplies the verdict. CoinDesk described a low-volatility holding pattern near $63,600. TradingView cited a 19% decline in 24-hour BTC volume, roughly $212 million of crypto liquidations, and a 0.68% decline in Bitcoin open interest, while retail and whale derivatives traders remained net long. If the bid is truly confident, why can it not sustain acceptance above $64,000?
【📊Analysis Baseline Statement】
All technical analyses below are based on the price snapshot locked on August 14, 2026 (EST): 02:48 Bitcoin (BTC) = $63,139 USD. Please treat this report as an “analytical map” rather than a real-time quote.
📈 Weekly structure: the market still speaks in Lower Highs and Lower Lows
Dow Theory defines a trend through the sequence of swings. A sustainable uptrend needs Higher Highs and Higher Lows. A downtrend is characterized by Lower Highs and Lower Lows. The weekly structure is explicit: after the marked $125,725 swing high, BTC printed Lower High 1 near $97,939 and Lower High 2 near $82,833. The marked downside sequence extends through $80,537, $62,525 and $58,053. Until Bitcoin reclaims a meaningful Lower High and then builds a higher low, the weekly chart remains a damaged advance inside an active corrective structure
Weekly Timeframe for BTC (Bitcoin)
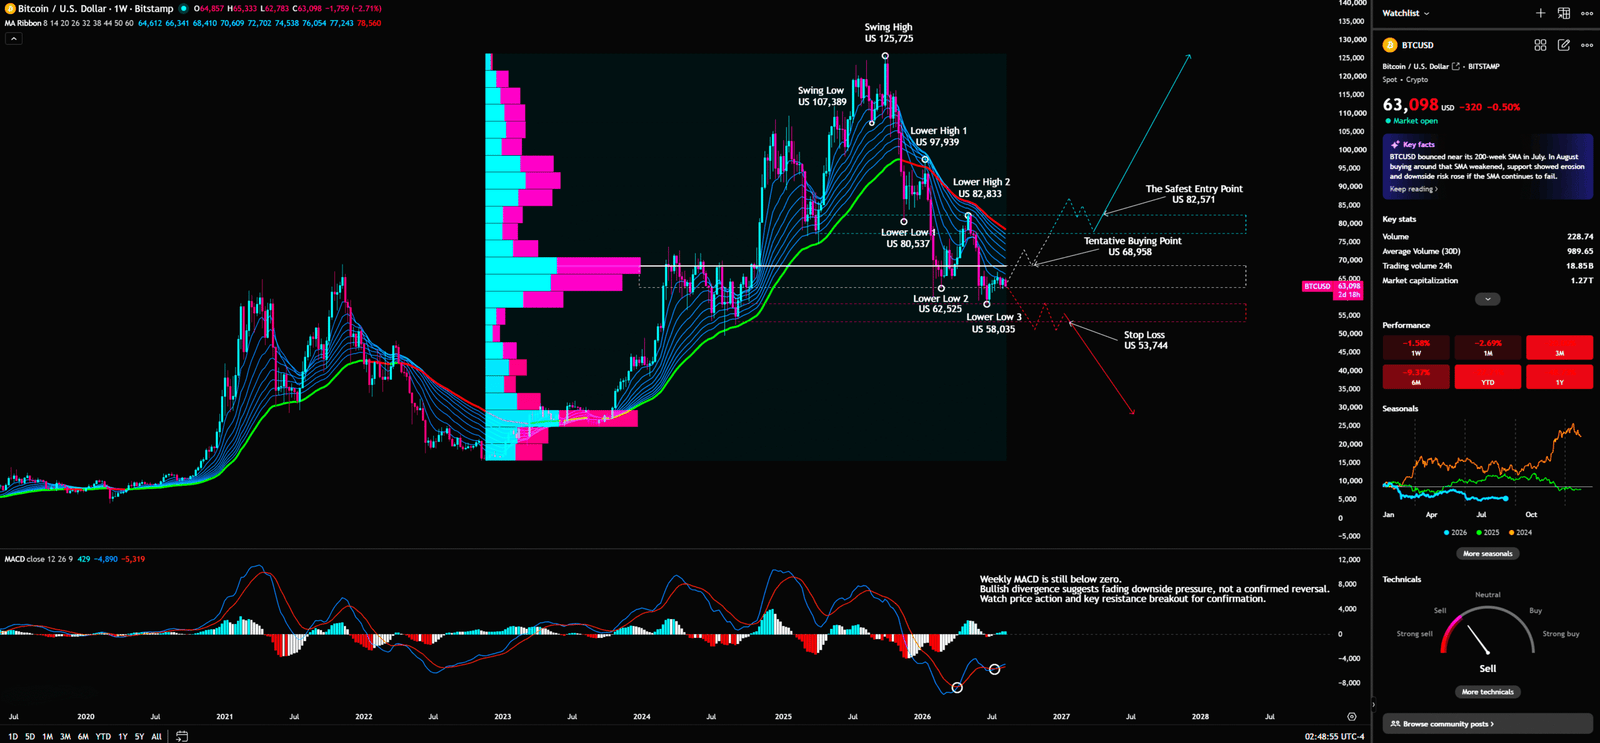
The weekly EMA ribbon is rolling over, and price remains below the broader ribbon. Weekly MACD is below zero, although momentum has recovered from its deepest negative readings. That is an easing of downside acceleration, not confirmation of a new bull phase. A trading desk would describe this as a lender removing the emergency escalation, not approving a new credit facility.
A reversal is not a smaller decline. A reversal is a rewritten market structure.
VPFR: the mid-$60,000s are a decision zone, not an automatic buy zone
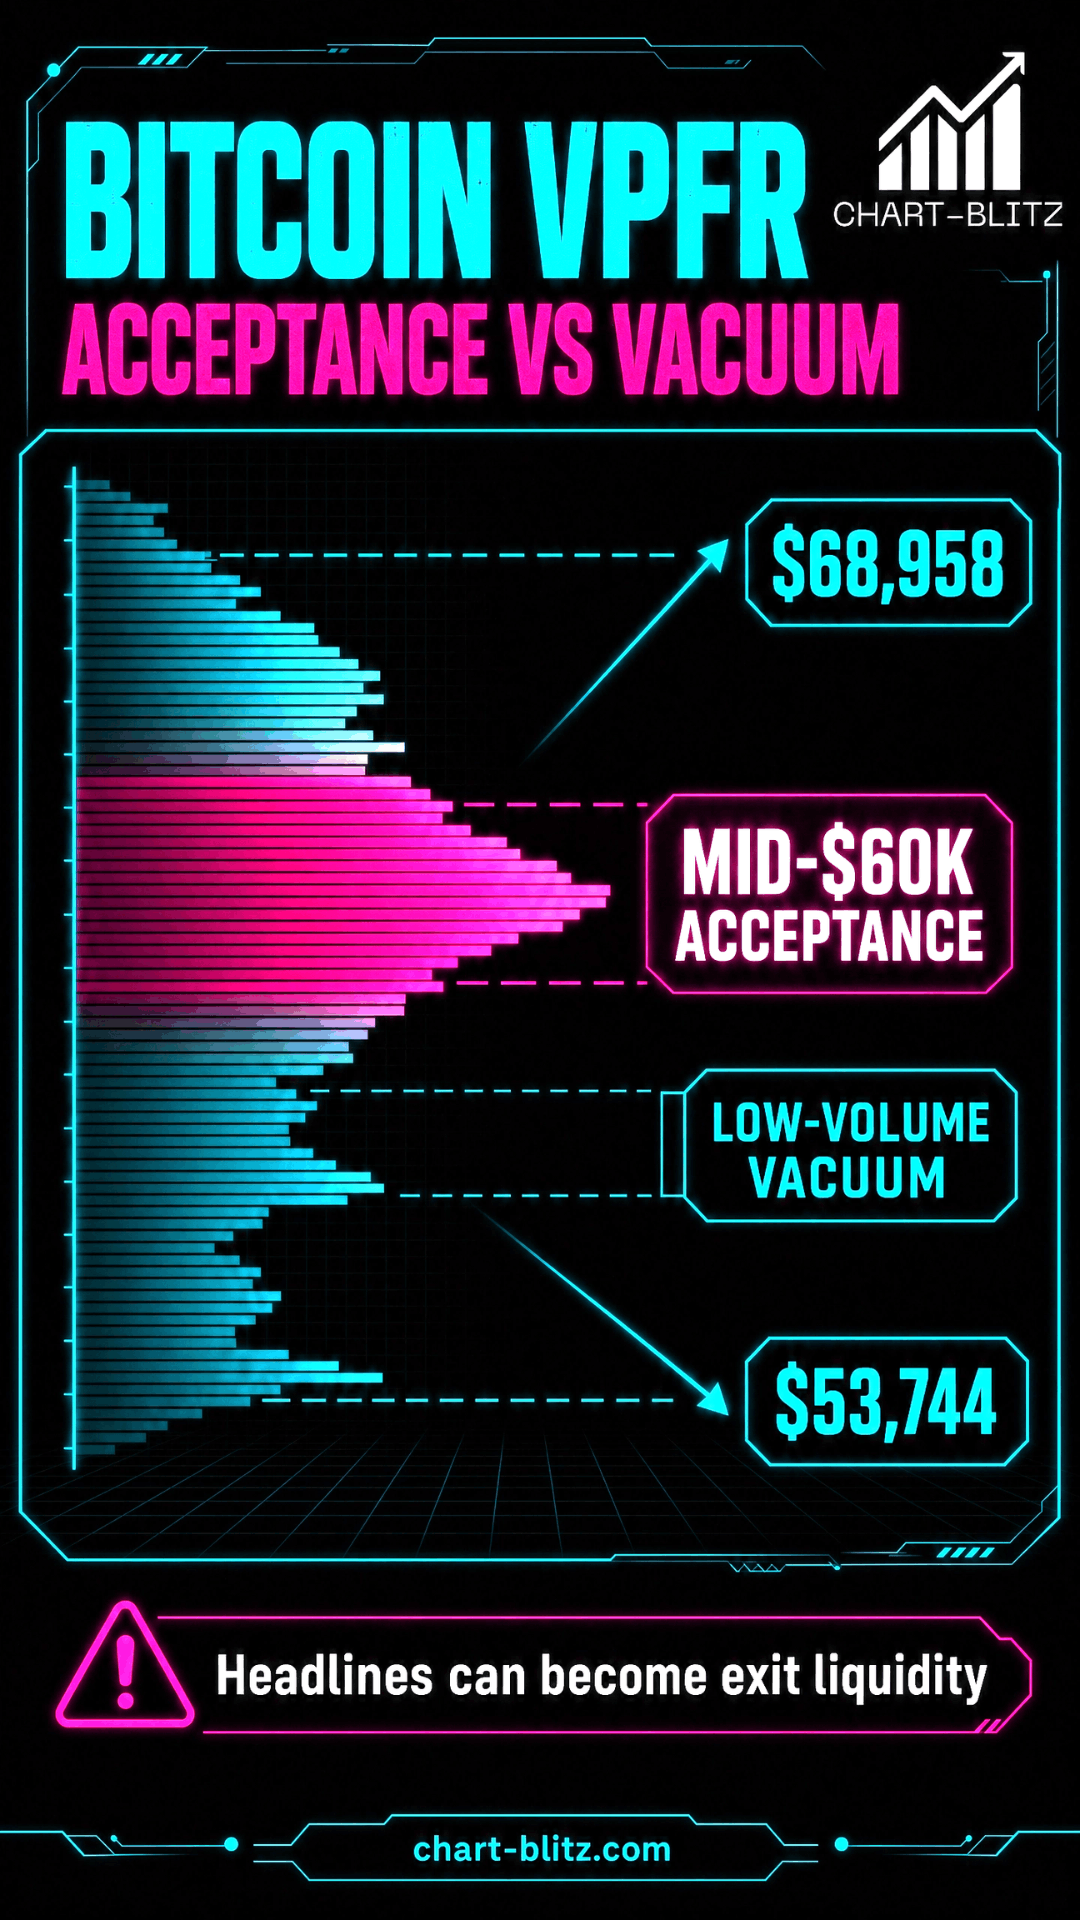
Volume Profile Fixed Range distributes traded volume by price. The Point of Control and High-Volume Nodes identify areas where the market accepted and exchanged inventory; Low-Volume Nodes behave more like vacuum corridors where price can travel quickly. This is why VPFR is useful on the weekly chart: it reveals where participants were forced to agree, disagree, or liquidate.
The visible weekly profile places its densest activity broadly around the mid-$60,000 area, close to spot. The exact POC label is not readable enough to justify false precision, so the mid-$60,000s should be treated as an approximate acceptance zone. Above it, the $68,958 and $82,571 levels form layered supply. A confirmed reclaim of $68,958 could allow price to move more quickly through thinner historical participation. A breakdown through the $57,875–$58,053 defense could create the opposite vacuum toward the marked $53,744 stop-loss zone.
Retail uses volume profile as a vending machine: touch POC, buy. Institutions ask a harder question: how much selling was absorbed, and where are forced orders likely to appear? Positive headlines that produce only a brief breakout can become exit liquidity rather than a genuine trend catalyst.
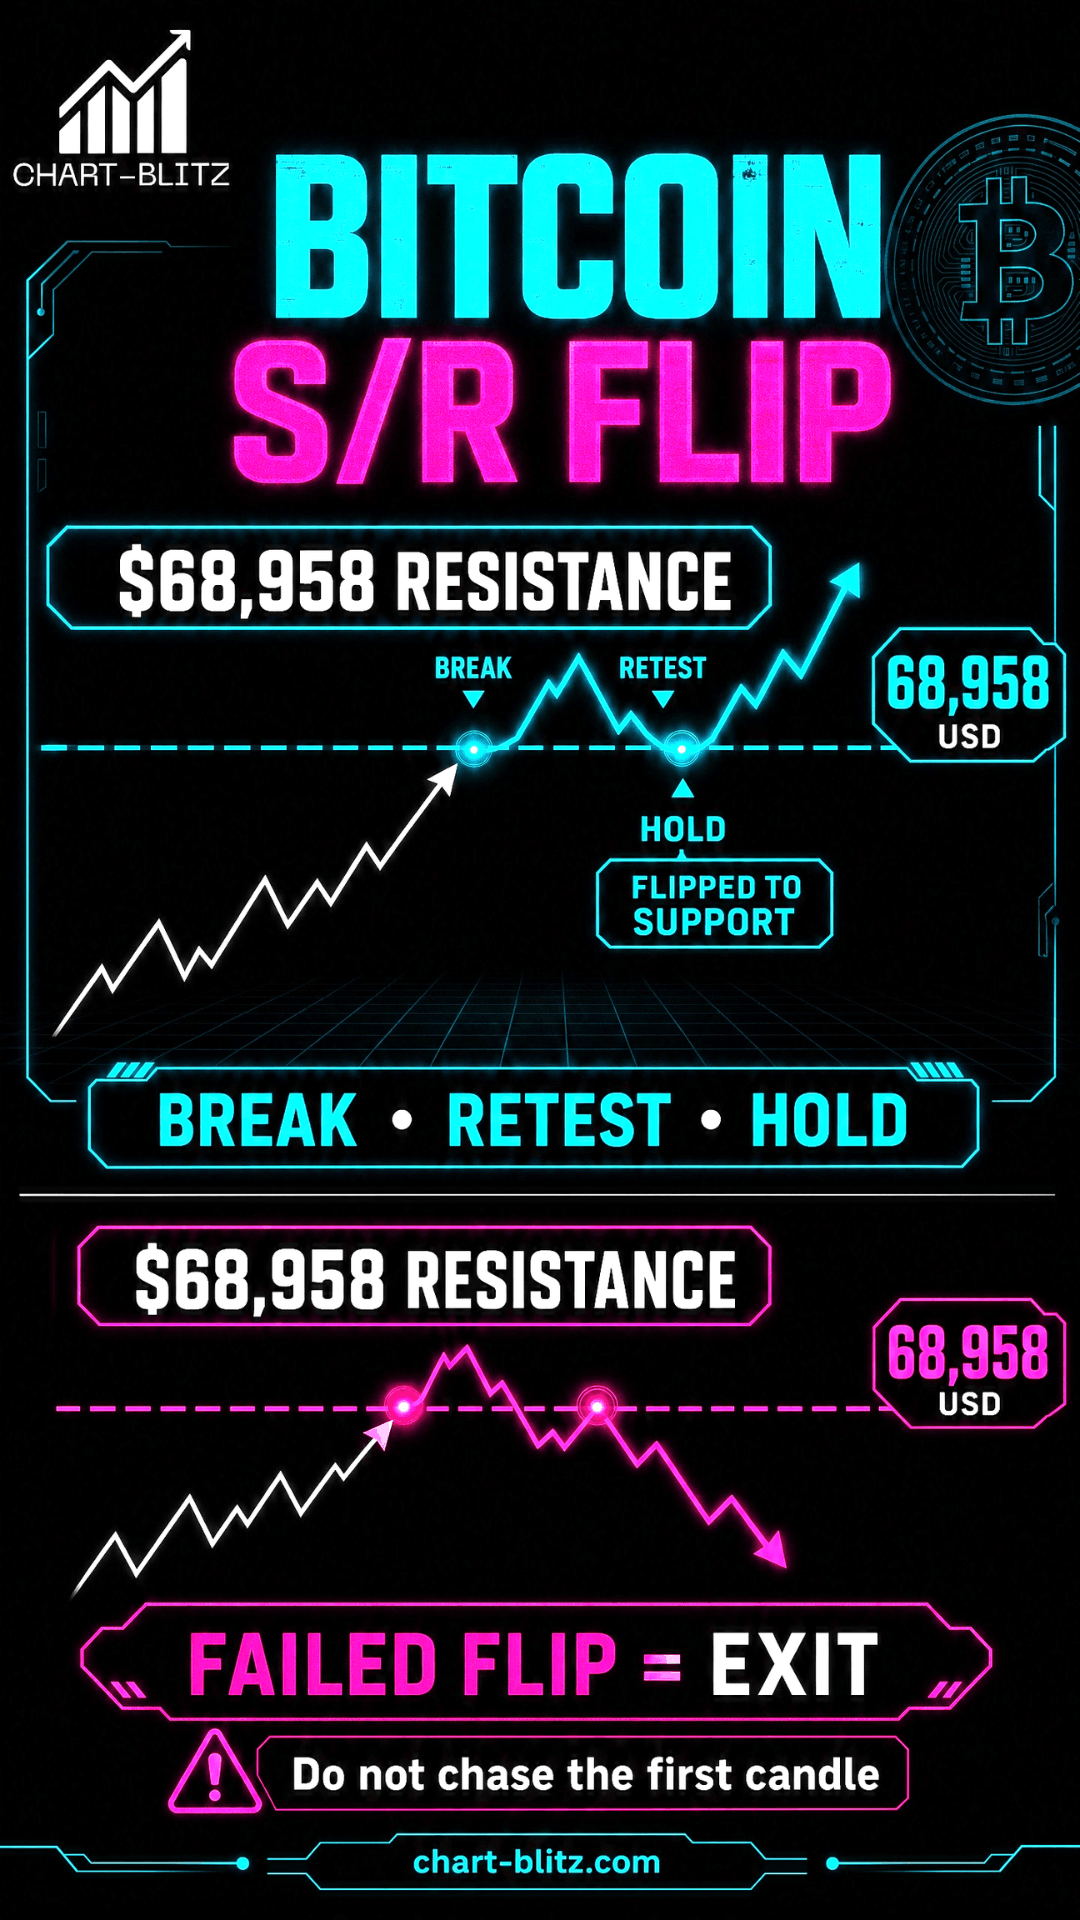
S/R Flip: $68,958 is the first gate; $82,571 is the stronger confirmation
A support/resistance flip is confirmed only when a resistance zone is decisively broken, retested, and defended. A wick above a line is not acceptance. The chart marks a Tentative Buying Point near $68,958 and a Safest Entry Point near $82,571. At approximately $63,169, BTC is below both levels, so the market has not confirmed an immediate long entry.
An aggressive plan waits for a close above $68,958 and a successful retest. A conservative plan waits for acceptance above $82,571, where overhead supply would have been more thoroughly cleared. If BTC breaks out and immediately falls back below the zone, the flip has failed; trapped breakout buyers become supply. The question is not whether BTC can bounce. It is whether buyers have enough capital to convert old resistance into a new floor.
📊 Daily Fibonacci and EMA ribbon: the grey zone between 0.5 and 0.618
Fibonacci retracement measures the depth of a prior swing correction. The visible daily levels place 0.5 around $70,955 and 0.618 around $57,875. With spot near $63,169, Bitcoin is between those decision levels. It has not reclaimed the midpoint and has not yet decisively lost the deeper retracement defense.
Daily Timeframe for BTC (Bitcoin)
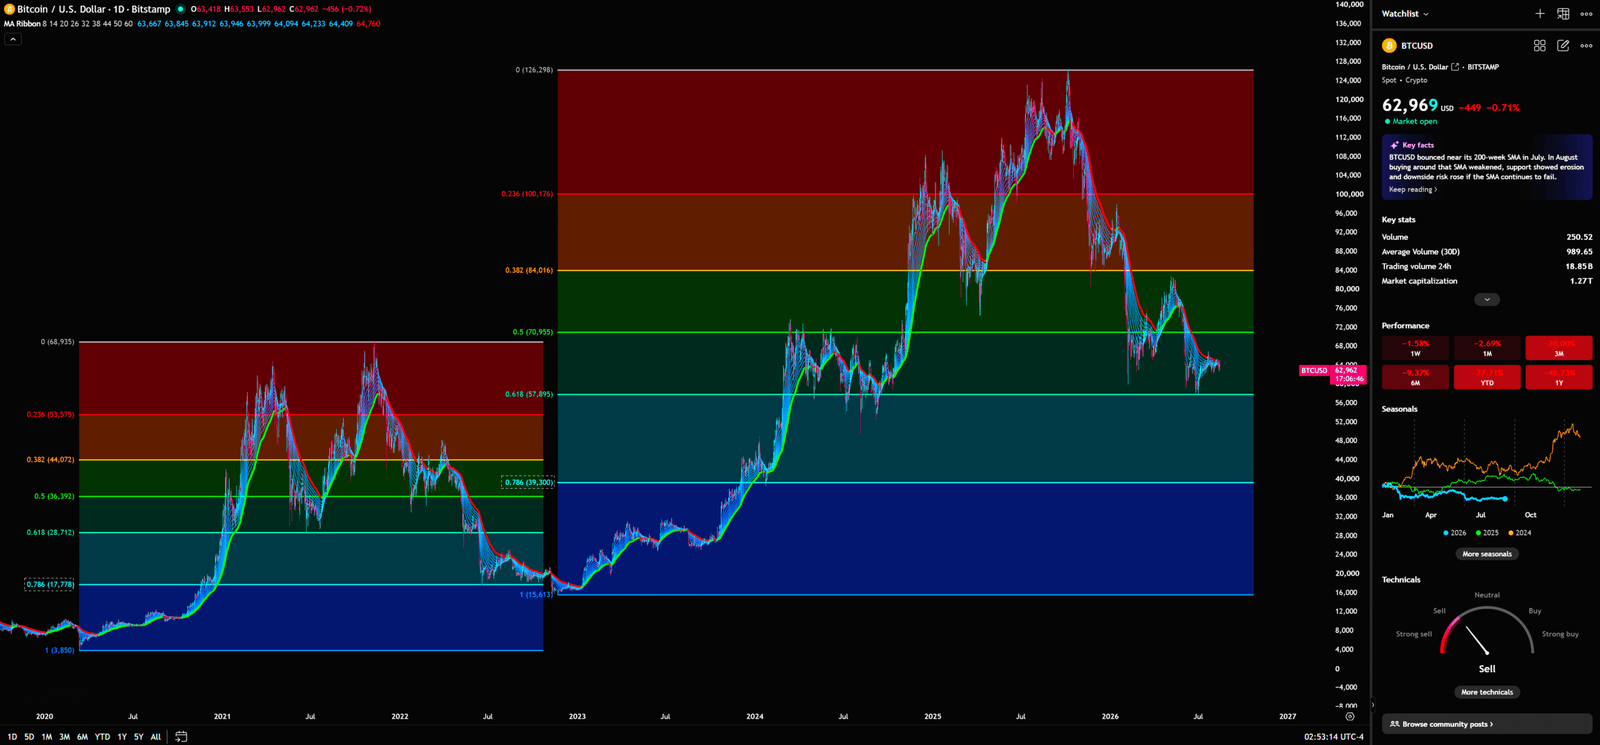
The daily EMA ribbon is weakening, with price below the upper ribbon structure. Its value is not a single crossover; it is whether several average-cost speeds begin supporting price at once. Retail sees a discount. Institutions see an unproven retracement until BTC reclaims $70,955 and survives the retest..
📉 Monthly Bollinger Bands and KDJ: repair candidate, not completed bottom
Bollinger Bands frame volatility around a moving average. A retreat from the upper band toward the lower half indicates that long-cycle momentum has cooled; the band itself is not a buy signal. Monthly BTC has retreated from the upper-band region toward the lower half of the structure, consistent with a mature correction
Monthly Timeframe for BTC (Bitcoin)
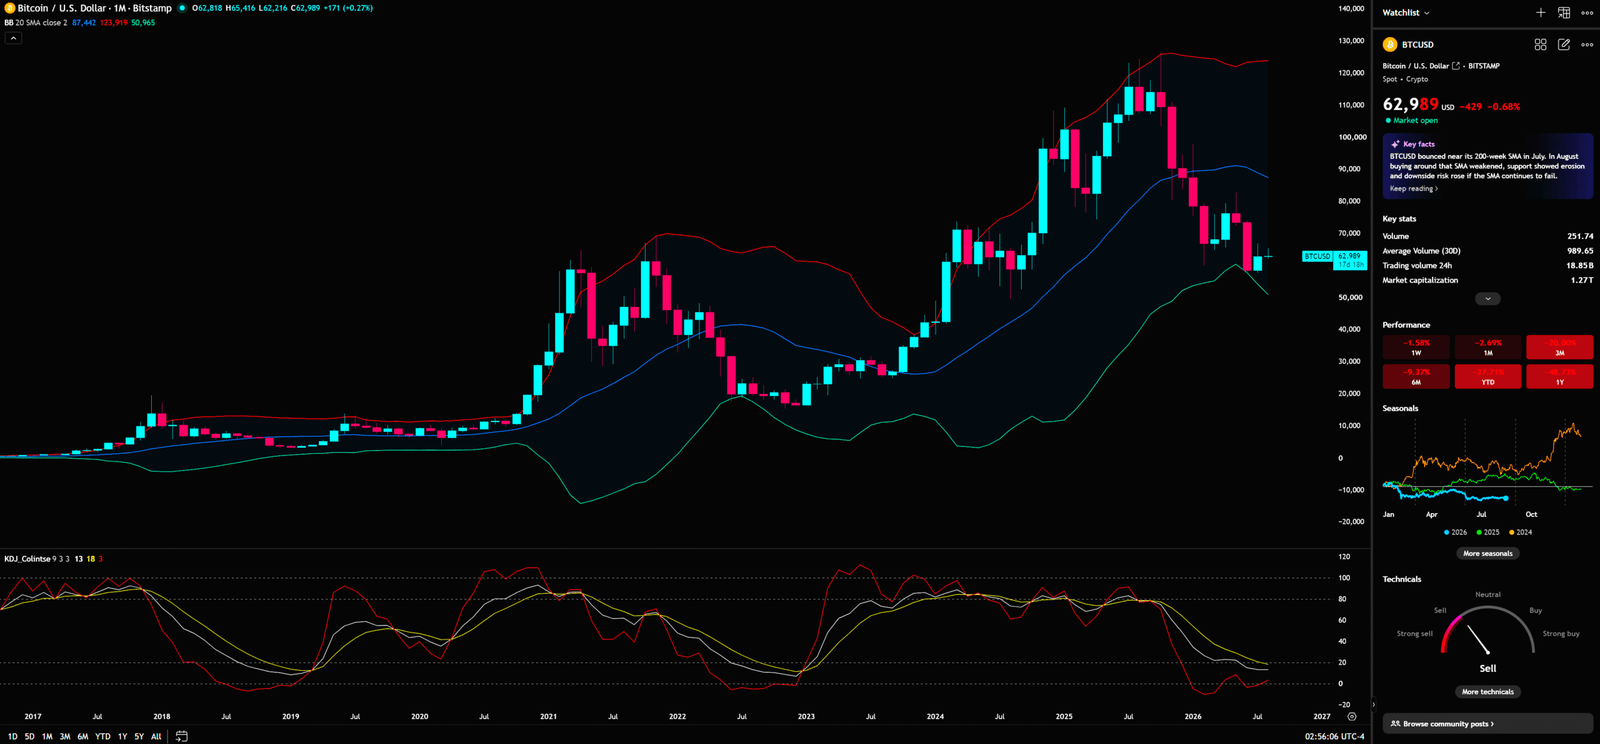
KDJ estimates momentum by measuring the close within a recent range. Low readings can signal crowded selling, but a meaningful recovery normally requires an upward cross together with price reclaiming a key mean. The monthly lines remain compressed in a weak lower zone without a clearly readable bullish cross. If KDJ turns higher while price reclaims the Bollinger midline, the repair case strengthens. If $57,875 fails, the weekly bearish structure remains in control
📐 4-Hour Analysis: measure speed, do not worship geometry
Gann angles relate price movement to time and slope. In practical trading, their value is to show whether price remains below a repeatedly respected descending speed line and whether a break is accepted on a retest. The 4H chart shows multiple Gann-style rays and a moving-average ribbon; price remains beneath a descending overhead cluster. That keeps the immediate path capped
4-Hour Timeframe for BTC (Bitcoin)
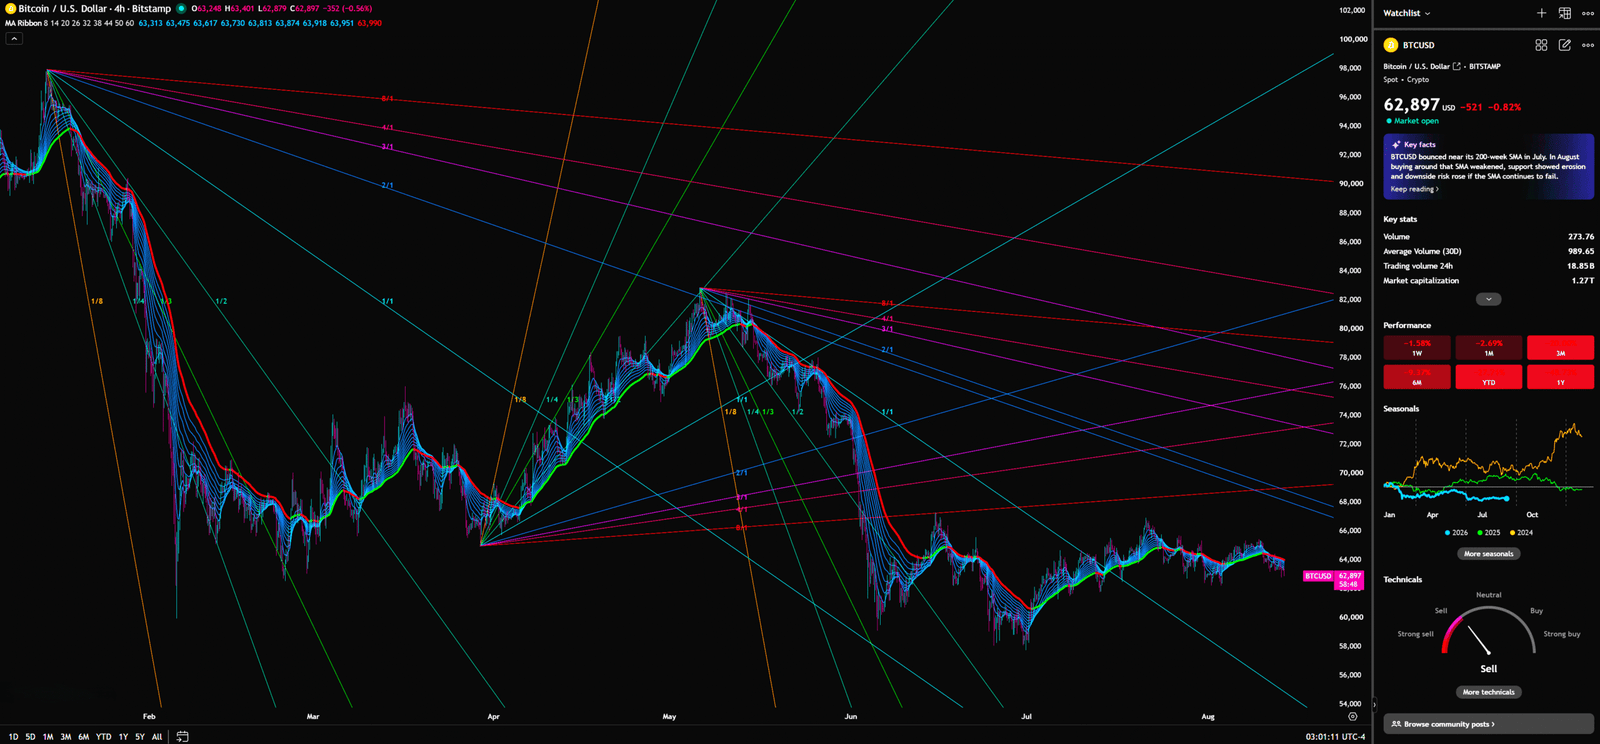
Gann analysis is sensitive to anchor selection and chart scaling, so it should operate as a speed filter rather than a standalone signal. When 4H slope and weekly LH/LL point in the same direction, a bounce is more likely to test liquidity than to launch a reversal. A sustained reclaim followed by a higher low would show that market speed has changed..
🎯 Multi-Scenario Projections & Professional Trading Plan
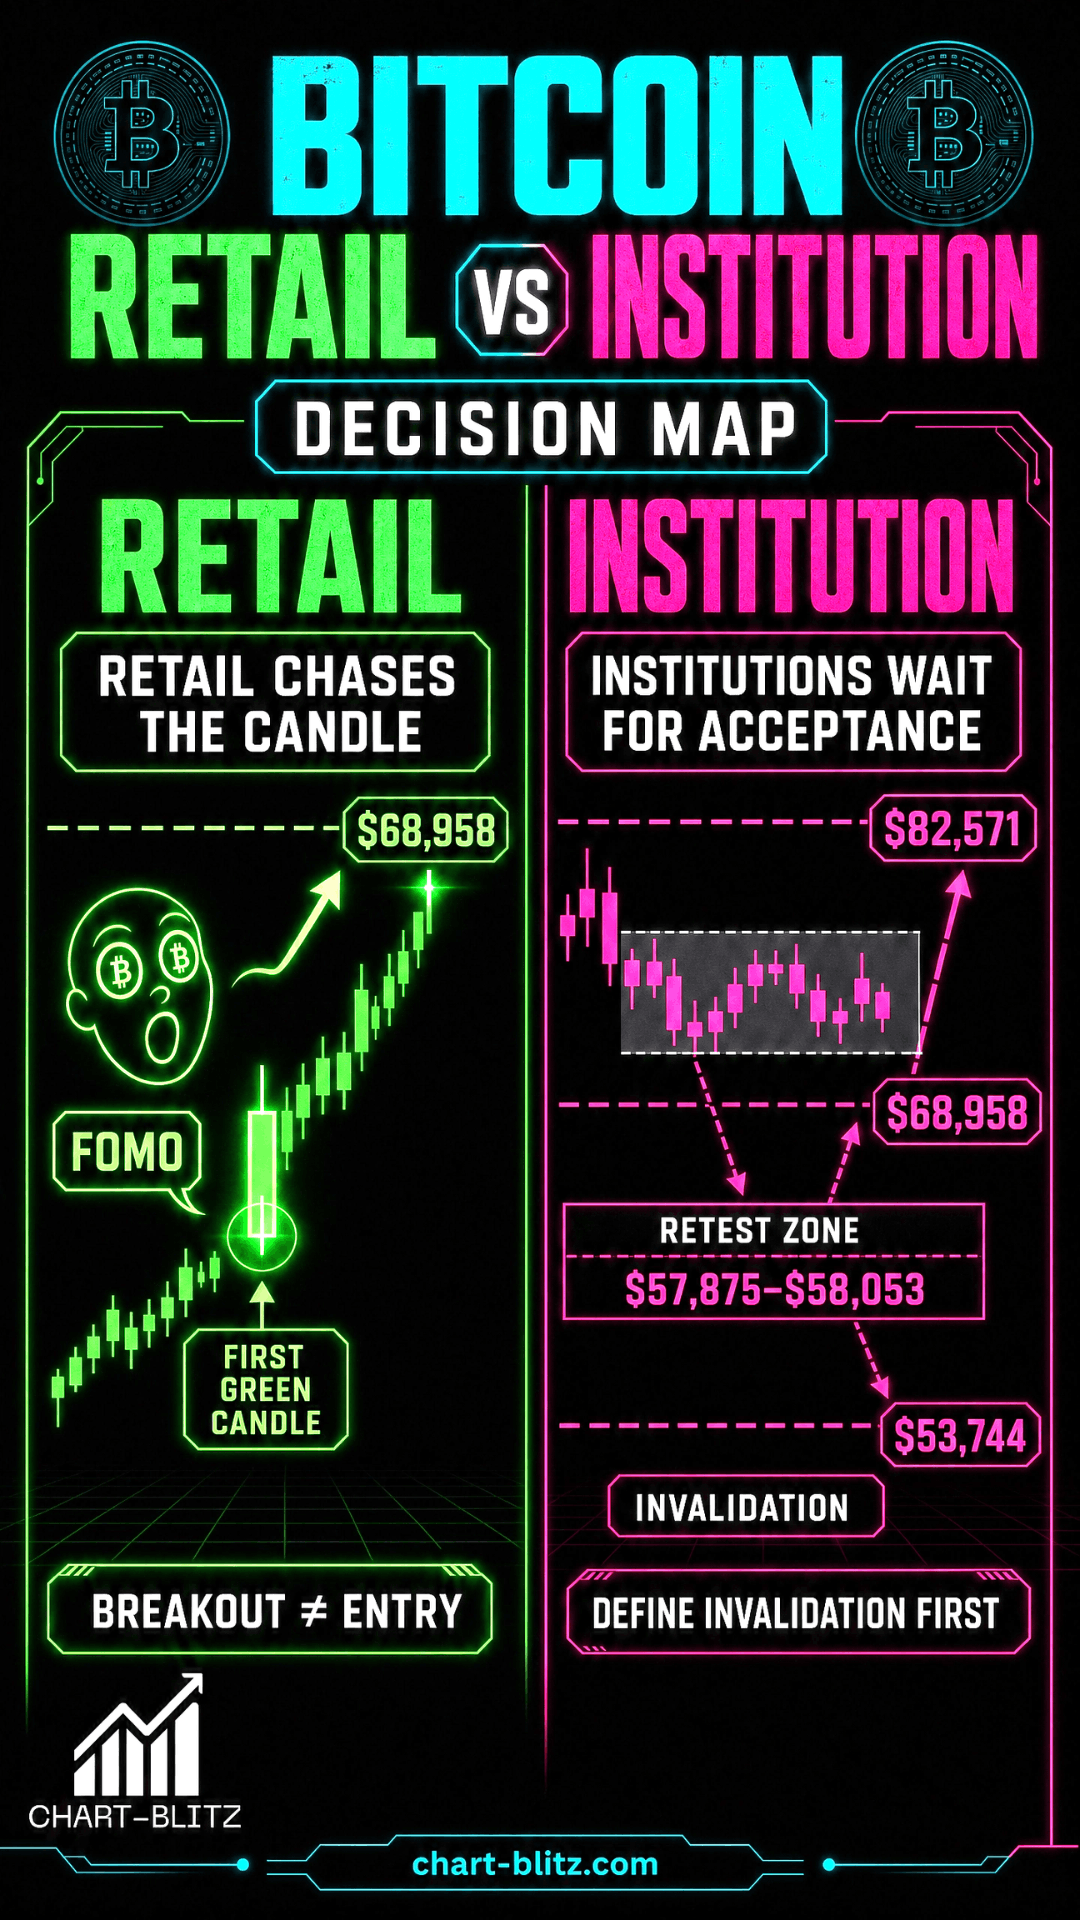
Retail asks whether $68,958 is a buy. Institutions ask which shorts will cover there, which breakout traders will chase, and whether buyers will still be present on the retest. Retail sees $82,571 as expensive; a professional desk may see it as evidence that acceptance has returned. Retail sees $53,744 as frightening; risk managers see a predefined invalidation point.
Trading is not a competition to display courage on every candle. It is a discipline of preserving capital when the thesis is wrong. The headline is a story. The stop is arithmetic. The market ultimately respects arithmetic.
| Scenario | Trigger | Path | Invalidation |
| Bearish continuation | Daily or weekly loss of $57,875–$58,053 followed by a failed reclaim | First risk reference $53,744; downside speed risk increases below the defense | Reclaim and acceptance above $68,958 weakens the immediate bearish case |
| Bullish repair | Reclaim $68,958 and hold it; stronger confirmation above $82,571 | First reclaim reference $70,955, then reassess acceptance above $82,571 | Failed breakout, or a move to $53,744, invalidates the long thesis |
| Range / no trade | Price remains between roughly $58,053 and $68,958 without confirmation | Experienced range traders only; no forced direction | Reassess after a confirmed break |
At approximately $63,169, BTC is below the marked tentative entry. The disciplined plan is conditional: wait for $68,958 reclaim and retest, or for the more conservative $82,571 confirmation. The chart-marked stop-loss reference is $53,744. A re-entry after a stop-out requires a new reclaim and retest, not emotional averaging. I will continue monitoring Bitcoin’s price action closely. If the chart develops a decisive reversal signal, this analysis will be updated promptly. Bookmark this page and return for the latest update.
I will continue to closely monitor the price action of this Crypto. As soon as a critical reversal signal appears on the charts, I will update my analysis and insights right here immediately. Remember to Bookmark this page and come back often to check for the latest updates!
Want to see our full, interactive chart breakdown? If you want to learn how to draw weekly VPFR, Fibonacci, EMA Ribbon, MACD, Supertrend, and S/R Flip frameworks designed for real trading decisions. Please browse the following『Further Reading』links. Fundamental news tells you what happened. Technical analysis predicts what will happen. To master the professional framework that separates market signal from noise, explore our exclusive models at https://www.chart-blitz.com/fxcx-app/omni-chart.html?symbol=BTC.
📚Further Reading:
To help everyone gain a deeper understanding of the various technical indicators mentioned in this article, we have specially prepared the following further reading materials. These cover key analytical tools found across the weekly, daily, monthly, and 4-hour charts.
- Decoding Fibonacci Retracement: The Perfect Blend of Natural Law and Market Psychology — Fibonacci Retracement is not just a set of magical numbers; it is a manifestation of market psychology. Learning how to correctly draw and interpret Fibonacci levels is a required course for every serious trader.
- Is a Major Move Hiding in Plain Sight? Dow Theory May Already Know the Answer — As retail traders continue to chase short-term signals, experienced market readers are looking deeper — into trend structure, volume behavior, and market phases that may expose the early clues of a coming breakout.
- Understanding VPFR: Finding the Hidden Footprints of Market Makers — The Volume Profile Fixed Range (VPFR) is a powerful tool that tells us where the most trading occurred within a specific price range. This helps us identify true support and resistance levels, as well as potential ‘Vacuum Zones’.
- S/R Flip Support and Resistance Swap Strategy — S/R Flip is one of the most powerful concepts in technical analysis. This article uses real cases to teach you how to use S/R Flip to capture the highest win-rate trading opportunities.
- MACD Momentum Indicator Momentum First — What Does the MACD Line Crossing Above Zero Mean? Golden Cross & Divergence Signals!
- Gann Fan Masterclass — Deep dive into W.D. Gann’s angle theory to identify the geometric relationship between time and price in the market.
- Strategies for EMA Ribbon Bearish Alignment: Dead Cat Bounce or Real Reversal — Deep dive into the EMA Ribbon to understand the battle between short-term and long-term capital.
- Bollinger Band: Long-Term Repricing Zone — The Ultimate Tool to Capture Massive Market Moves Tired of getting shaken out of winning trades too early? Or buying right before a trend reverses? An ex-banker reveals how to use the Bollinger Band to filter out market noise and ride the big waves.
- KDJ Stochastic Indicator Bottom Confirmation — What is the implication of a downward-curving KDJ? Understand in one article how to use dynamic indicators to catch market turning points.
【Disclaimer】 The content herein is for educational purposes and reflects the author’s personal opinion only; it is not investment advice. All financial investments, including cryptocurrencies, carry significant risk, and you could lose your entire capital. To support this site, this article may contain affiliate links. While we strive for accuracy, we cannot guarantee all information is complete or error-free. Please conduct your own research and be fully responsible for your own investment decisions.