Fetching Live Market Data...
When you make a trade, you should have a clear target of where you expect to get out
William Delbert Gann – 1949
🚨The market has not earned a bottom. A price can look cheap, feel exhausted and remain structurally weak. Could Bitcoin’s next decisive move depend less on the flush below $70,000 than on whether buyers can reclaim the narrow band just above $71,000?
🧭 The map was complicated before the flush
The simplest market story is often the most expensive: “It fell too far, so it must bounce.” What if the real trade is not guessing the bottom, but testing whether weekly structure can support one?
Bitcoin is well below the marked swing high near $125,725. The local higher high at $87,219 sits alongside lower highs at $97,939 and $82,833 and lower lows at $80,537, $62,525 and $58,035. This is not a confirmed higher-high/higher-low sequence; the Dow structure remains incomplete.
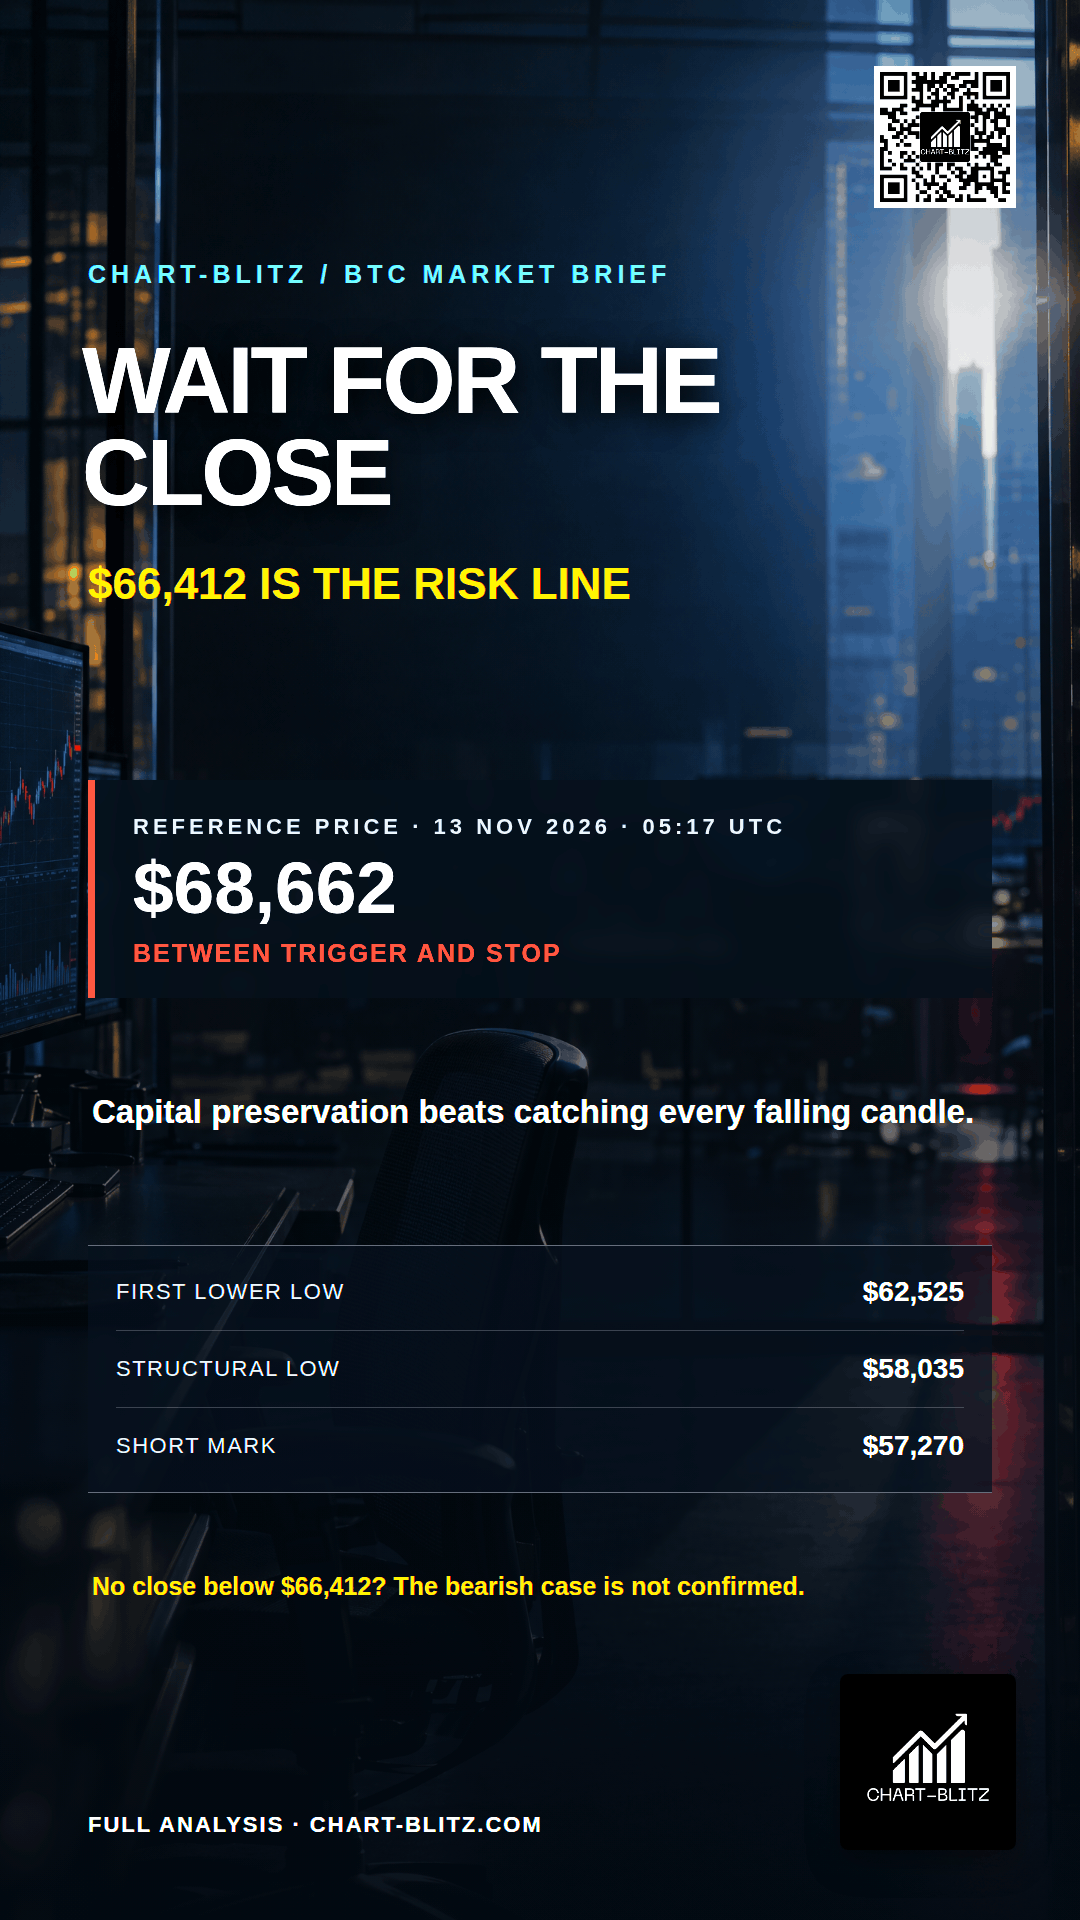
The chart labels $87,777 “The Best Entry Point,” $71,123 “Tentative Buying Point,” $66,412 “Stop Loss,” and $57,270 “The Best Short Entry.” These are annotations, not institutional orders or universal instructions. $71,123 is close to daily Fibonacci $71,008, creating a reclaim zone—not a guaranteed reaction. The $66,412 stop is chart-specific.
A bank’s credit committee would not erase a borrower’s deteriorating repayment history because one quarter improved. In the same way, a bounce can be real without repairing the trend. The story is a short-term opportunity set inside an unresolved higher-time-frame structure. Which deserves more weight: an appealing price, or evidence that the market has changed its behavior?
【📊Analysis Baseline Statement】
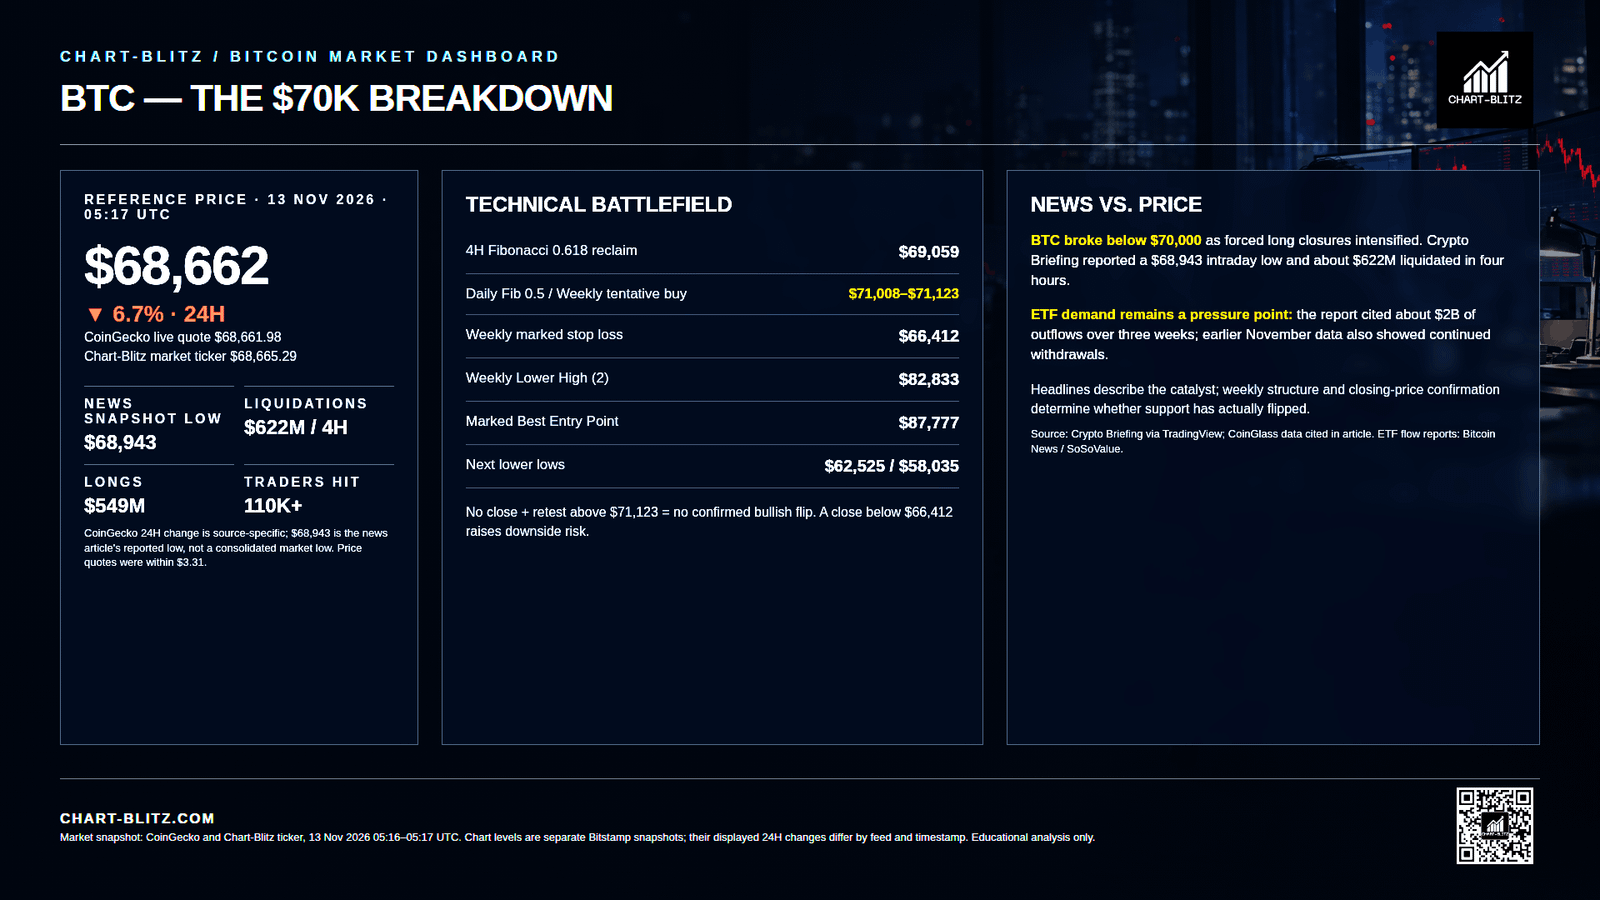
All technical analyses below are based on the price snapshot locked on November 13, 2026 (EST): 00:53 Bitcoin (BTC) = $68,657 USD. Please treat this report is an analytical map, not a live executable quote. Fragmented crypto venues can differ by a few dollars; every decision must be checked against the same venue and a completed candle before action is considered.
💡Four frames. One question: did it hold?
The Price and Timestamp above are the print this piece froze at the close of writing — not the tape now. Markets move; the copy does not. The only check that matters is whether that freeze still holds. Open Chart Grid: One name, Four frames, locked Weekly → Daily → Monthly → 4-Hour, the article’s print against the live chart. You do not pick timeframes, and you should not trust the headline. Hold or break: you decide.
📰 News analysis — Forced selling is fact; its cause is not settled
Liquidations create urgency, and urgency can masquerade as explanation. Does a large liquidation print prove a bottom—or only that leveraged positioning was crowded?
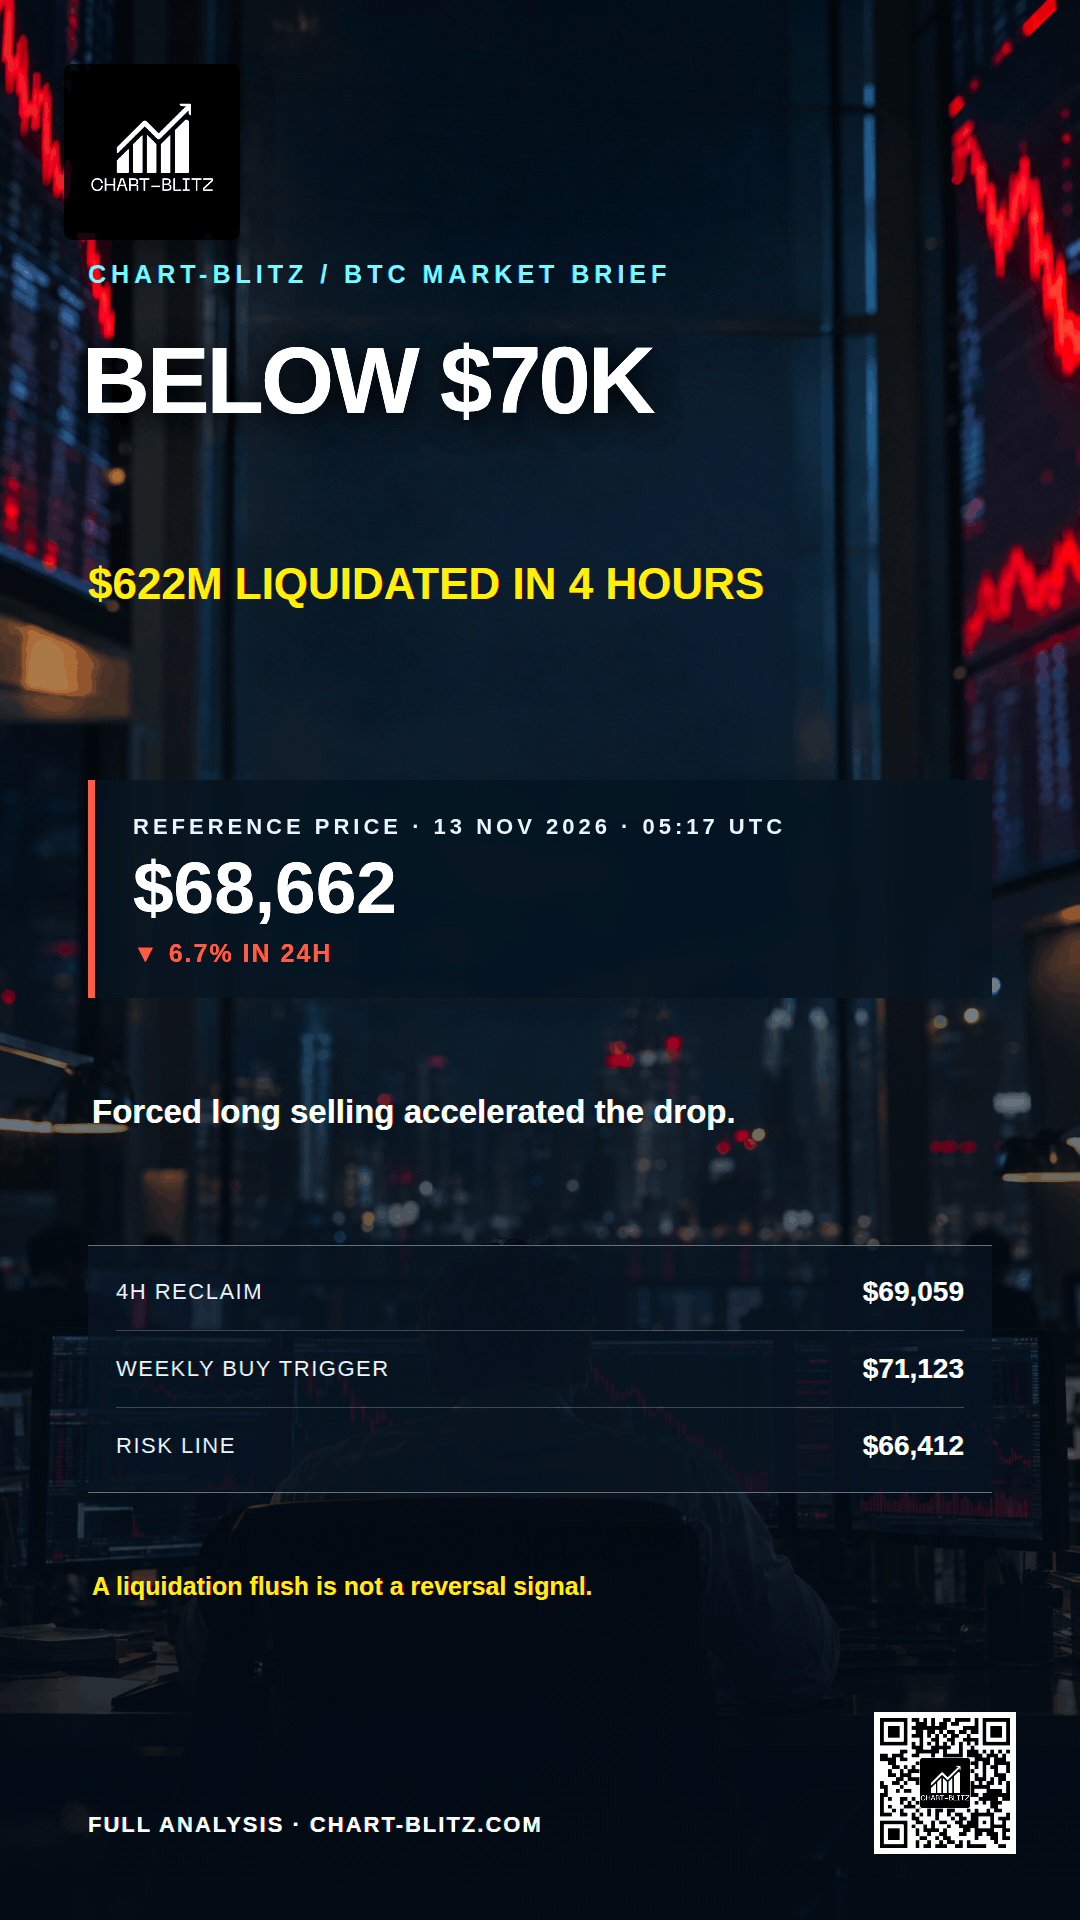
Crypto Briefing, syndicated on TradingView on November 13, reported a Bitcoin intraday low of $68,943, later trading around $69,297, and a decline of roughly 6% over 24 hours. Citing CoinGlass, it reported about $622 million in liquidations over four hours: approximately $549 million in longs and $72.46 million in shorts. More than 110,000 traders were reportedly affected, with the largest position at $31.09 million. The article also cited roughly $2 billion in ETF outflows over three weeks.
Liquidated longs can add forced selling to a decline, amplifying volatility, but the figures neither prove a single cause nor establish that selling is finished. Capital faces a stress test. Retail may call the total automatic capitulation and buy too soon. An institution could scenario-plan to sell a failed rebound or wait for a confirmed reclaim before adding risk; neither describes verified conduct.
ETF flows are recent context, not a new event in the last 24 hours. PrimeXBT, relaying Bitcoin News, reported $95 million of U.S. spot BTC ETF outflows on November 10, a fourth consecutive outflow day, and year-to-date net outflows above $1.1 billion. Yahoo Finance, citing SoSoValue, reported $1.28 billion in outflows from November 2–6, with IBIT at about $1.21 billion. The windows point to reported softness in a demand channel, not a complete explanation for price.
Coverage also cited October CPI at +0.4% m/m versus 0.3% forecast and a Goldman Sachs view of two 25bp hikes, in December and March 2027. This is reported macro backdrop—not a fresh official announcement, confirmed outcome or sole cause. A desk separates data, interpretation and price response. Why collapse them into one causal headline?
🗓️ Weekly — The higher-time-frame verdict remains unresolved
One green milestone does not reverse a damaged sequence. Can one marked higher high outweigh several lower highs and lows without a confirming higher low?
Weekly Timeframe for BTC (Bitcoin)
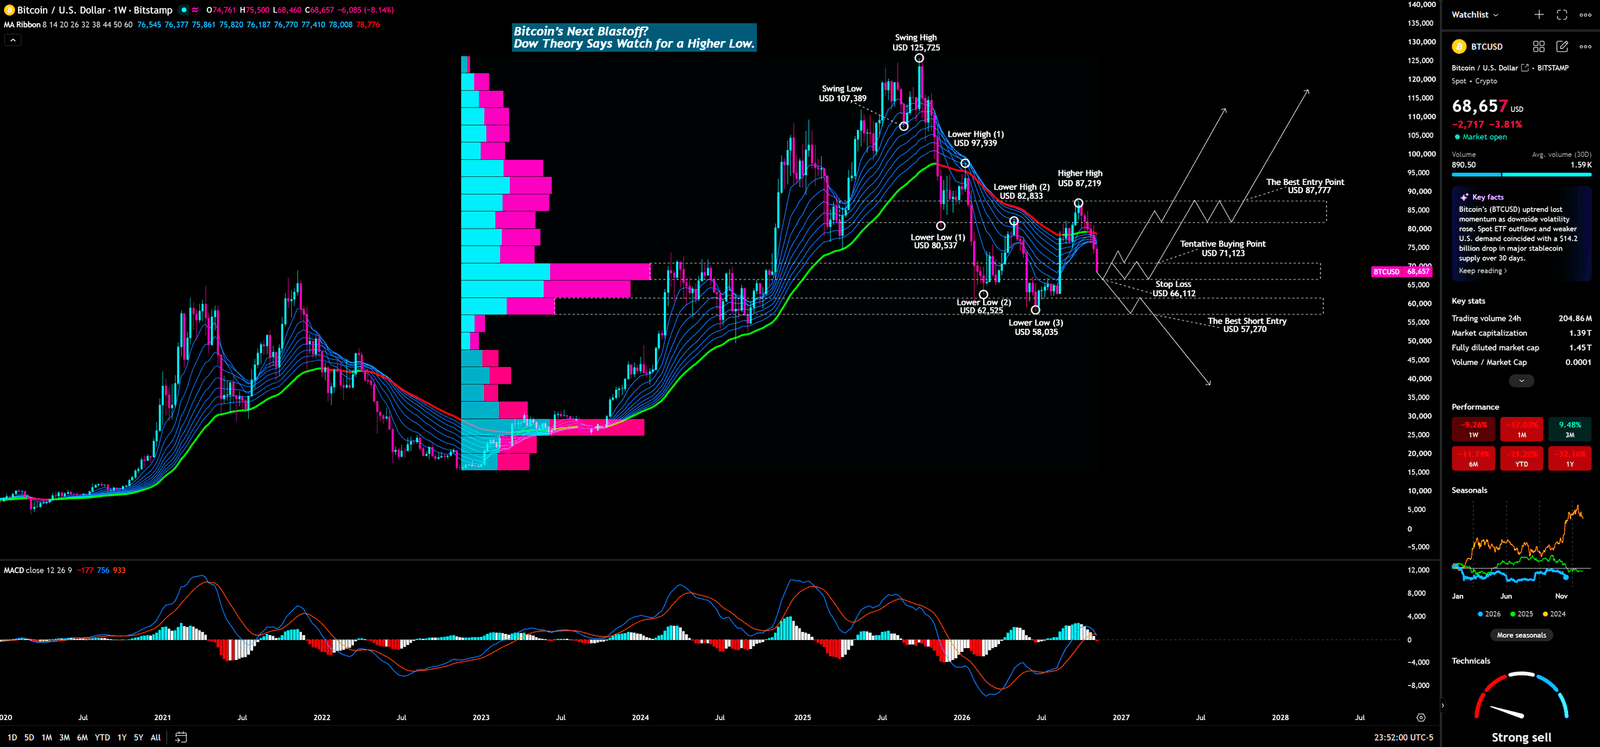
The MA Ribbon is a cluster of moving averages showing trend direction and dynamic friction. Slope and spacing help assess whether price trades with broader momentum; advanced reading treats it as context, not a magic line. The weekly ribbon is overhead. Capital returning to it may meet supply; retail may mistake a green candle for reversal. Institutions could plan around a failed recovery or wait for sustained reclaim. Rejection is not guaranteed.
Dow Theory assesses trend through swing highs and lows: an uptrend needs higher highs and higher lows; lower highs and lower lows indicate weakness. It tests structure rather than sentiment. Marks include swing high $125,725, swing low $107,389, lower highs $97,939/$82,833, local higher high $87,219, and lower lows $80,537/$62,525/$58,035. The isolated higher high lacks a confirming higher low. Capital has not confirmed repair; retail may overread it; institutions could wait for a higher low or plan around a failed retest.
Fixed Range Volume Profile (VPFR) shows traded volume by price over a selected range. It identifies participation areas; advanced reading checks range selection and legibility before naming a Point of Control (POC). The weekly histogram suggests broad participation around $60,000–$70,000, cautiously. No readable POC or precise vacuum-zone target is available. Capital may contest this band; retail may assume automatic support; an institution could test whether bids persist, a scenario—not evidence of intent.
MACD (Moving Average Convergence Divergence) compares faster and slower moving-average relationships, usually with a signal line and histogram, to assess momentum. It is useful with structure; advanced reading avoids trading a crossover alone. Weekly MACD is visible, but no clear divergence is established, so none is claimed. Capital may reduce risk; retail may hunt for divergence because price fell; institutions could wait for momentum improvement plus structural reclaim.
Weekly annotations are $71,123 tentative buy, $66,412 stop, $87,777 best entry and $57,270 best short—not orders. Reversal remains unconfirmed. What changes that? A decisive reclaim and hold, not a headline or wick.
📉 Daily — A $115 confluence is a test, not a promise
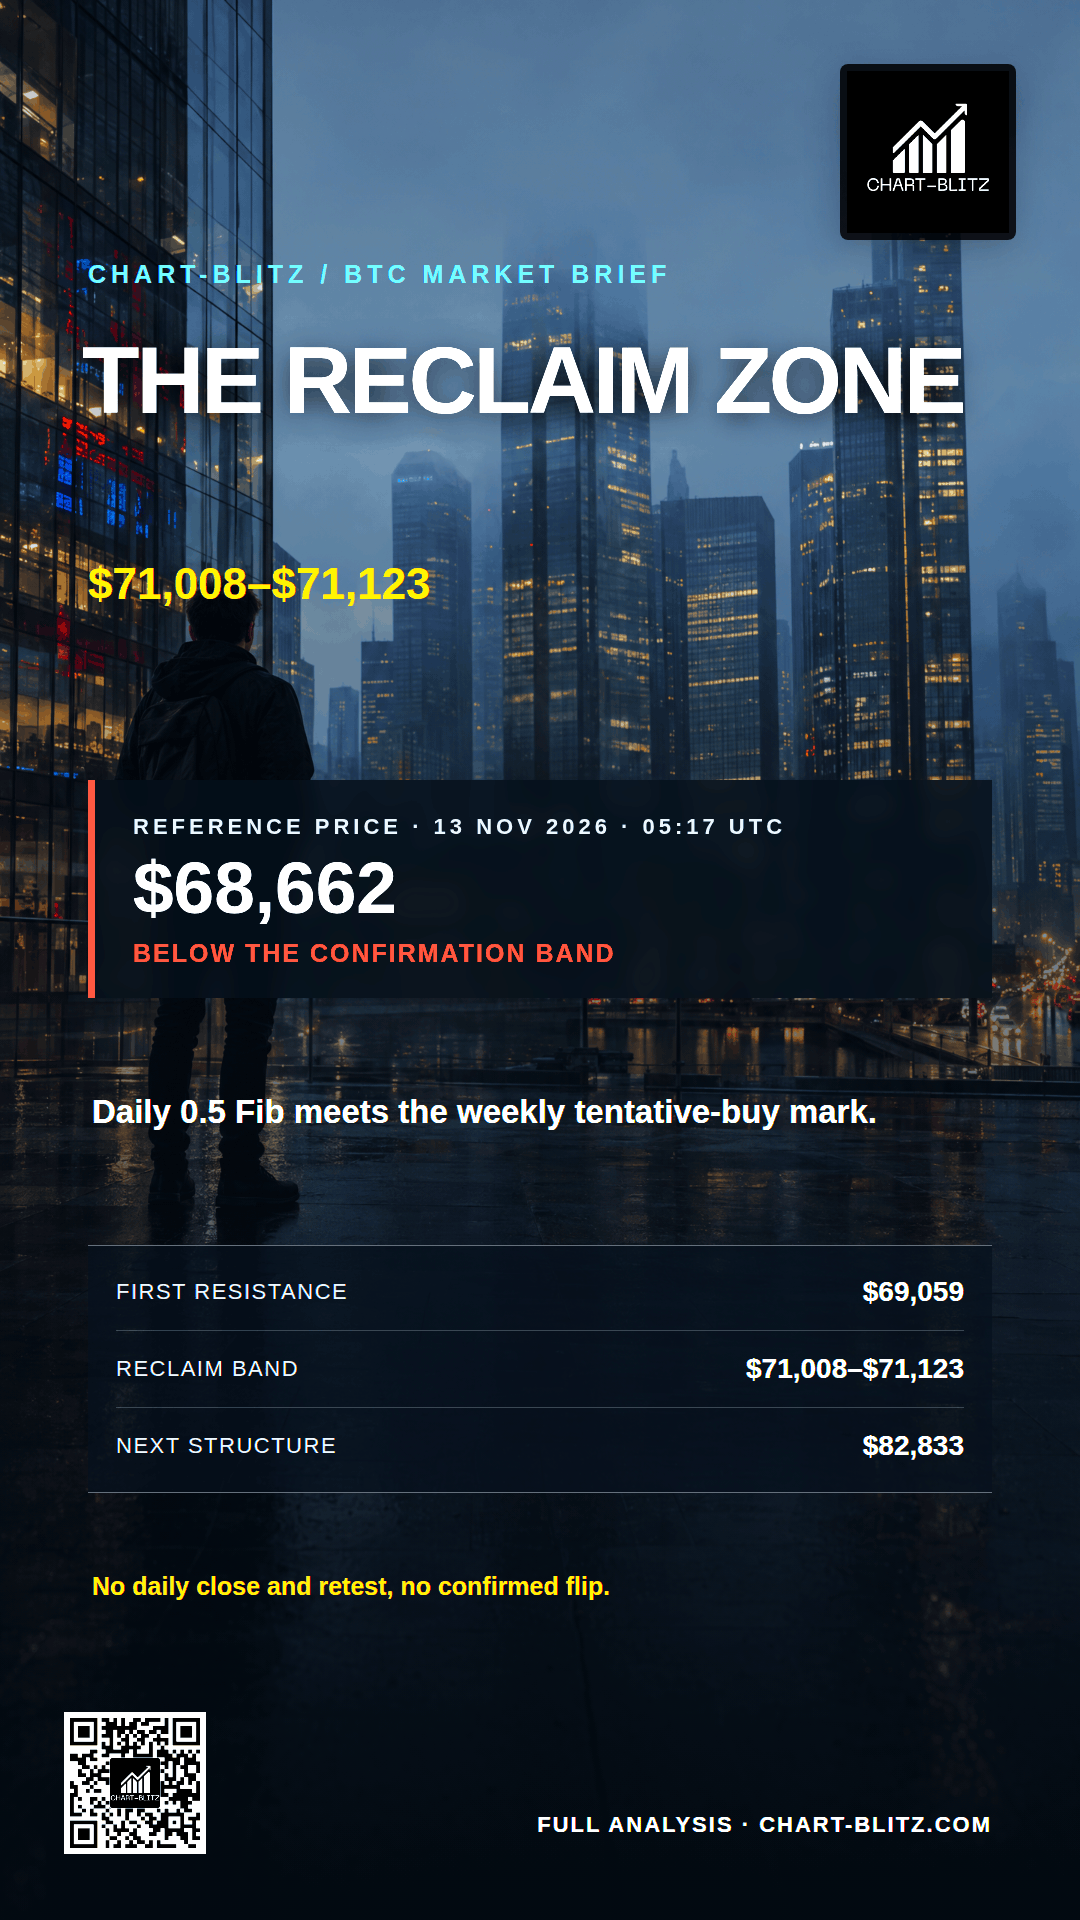
Two chart references sit nearly together, but proximity does not equal confirmation. Will Bitcoin reclaim $71,000 as support, or will former support act as resistance?
Daily Timeframe for BTC (Bitcoin)
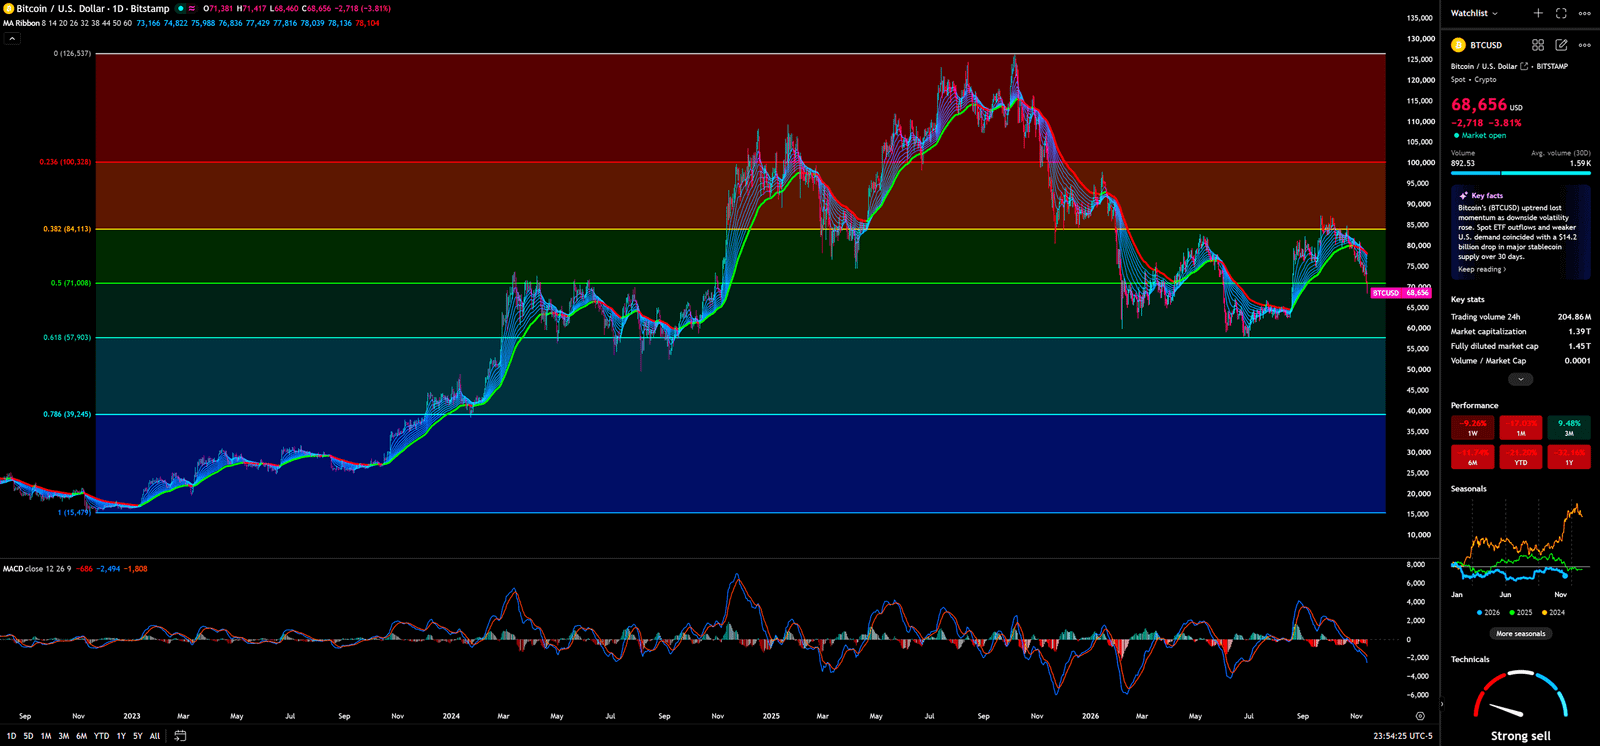
Fibonacci Retracement divides a selected swing into proportional levels to map possible reactions. It helps measure retracements; advanced use treats levels as confluence, not laws. Daily levels: 0.382 $84,113, 0.5 $71,008, 0.618 $57,903, 0.786 $39,245, extremes about $126,537/$15,479. The midpoint is only $115 below weekly $71,123. Price near $68,656 is below the zone. Buyers need a close and hold. Retail may mistake a touch for reversal; institutions could plan around a failed reclaim or successful retest, neither confirmed.
The daily MA Ribbon, defined above, slopes down overhead. It frames trend friction, not an exact ceiling; the slope may reflect capital aligned with decline and holders selling recovery. Retail may call a rally to the averages a recovery. Institutions could plan around rejection or wait for flattening and reclaim. Evidence is cautious, not certain.
Daily MACD, defined above, is weak/rolling down at the right edge. Its value is momentum confirmation, not a standalone crossing; no value or divergence is invented. Capital may remain defensive. Retail may mistake a brief bounce for a bottom; institutions could require acceptance above $71,008–$71,123 plus improving momentum. A wick that closes below is not acceptance.
Daily price remains below the roughly $71,000 confluence. A close above and successful retest would flip resistance to support; failure leaves the declining ribbon and lower references in play. Acceptance matters more than the first visit.
🌙 Monthly — An oscillator rebound is not a change of climate
Monthly indicators move slowly because they force patience. Does a bounce from a low oscillator area end the decline, or merely mark a pause in selling?
Monthly Timeframe for BTC (Bitcoin)
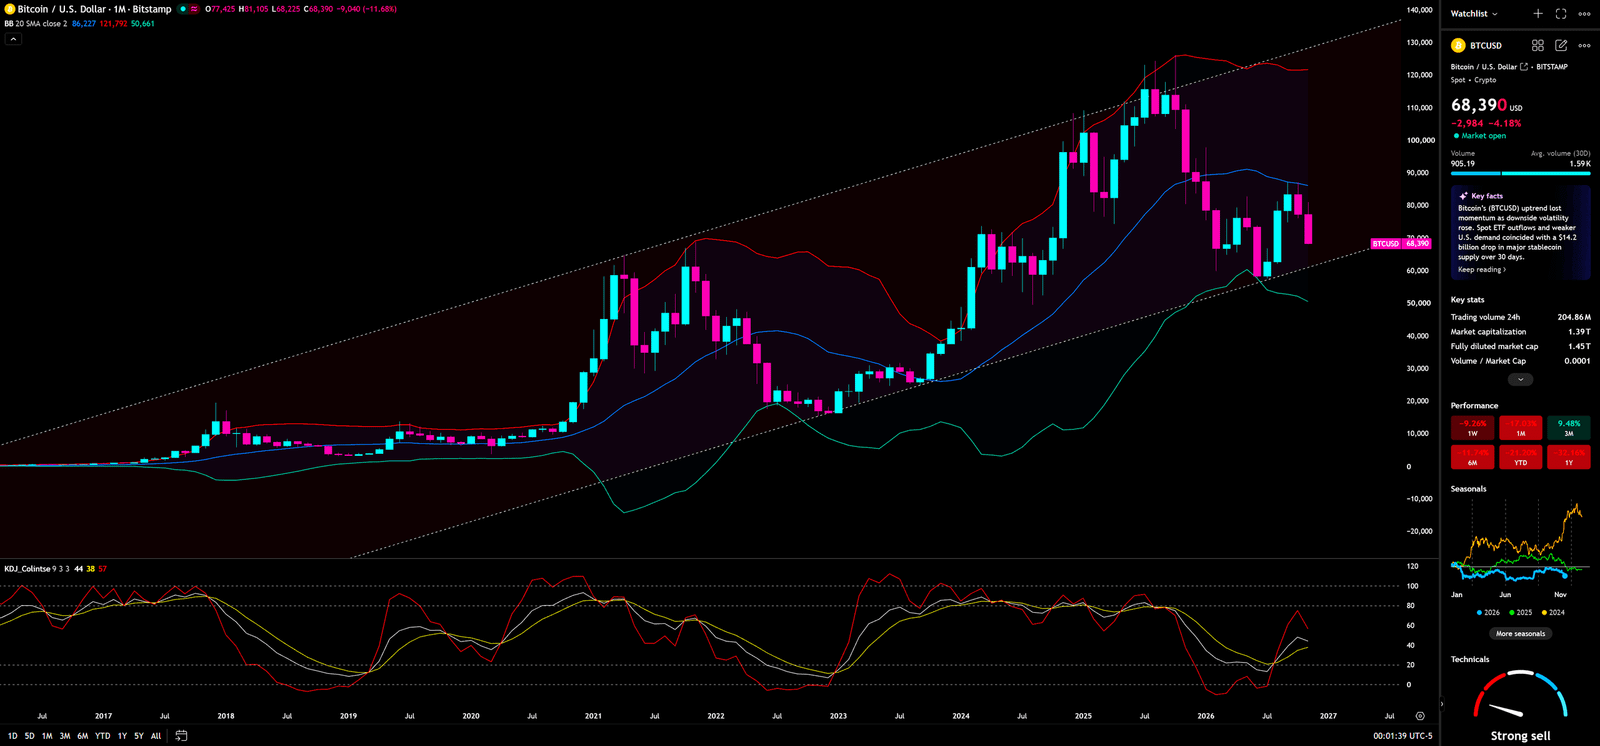
Bollinger Bands plot volatility envelopes around a moving average; this chart uses a 20-period close-based SMA and two standard deviations. They frame relative price and volatility; advanced reading does not treat touches as reversals or claim a squeeze without contraction. Price is below the mid-band, above the lower band: weak, but no confirmed lower-band break. Capital may reprice risk; retail may call a bounce durable; institutions could wait for mid-band reclaim or reassess on lower-band failure.
KDJ is a smoothed momentum oscillator based on the close within a recent high-low range; its J line amplifies movement. It helps locate extremes, but advanced reading confirms with price and avoids uncertain values. Monthly KDJ rebounded from an earlier low area but does not confirm a multi-month reversal. Selling may have paused without long-term accumulation. Retail may call it a bottom; institutions could wait for sustained recovery and a higher low.
The chart shows a long rising channel/trend line, framing longer-term path and possible reaction areas—not a guaranteed floor. Monthly reversal is unconfirmed. Long-horizon capital needs acceptance across monthly closes; retail may anchor to the line; institutions could wait for close and follow-through. Why conclude before monthly price confirms it?
⏱️ 4-Hour — A timing chart, not the investment thesis
A lower timeframe shows the struggle in detail and can tempt traders to mistake detail for certainty. Can Bitcoin recapture $69,059, or will intraday rebounds meet descending resistance?
4-Hour Timeframe for BTC (Bitcoin)
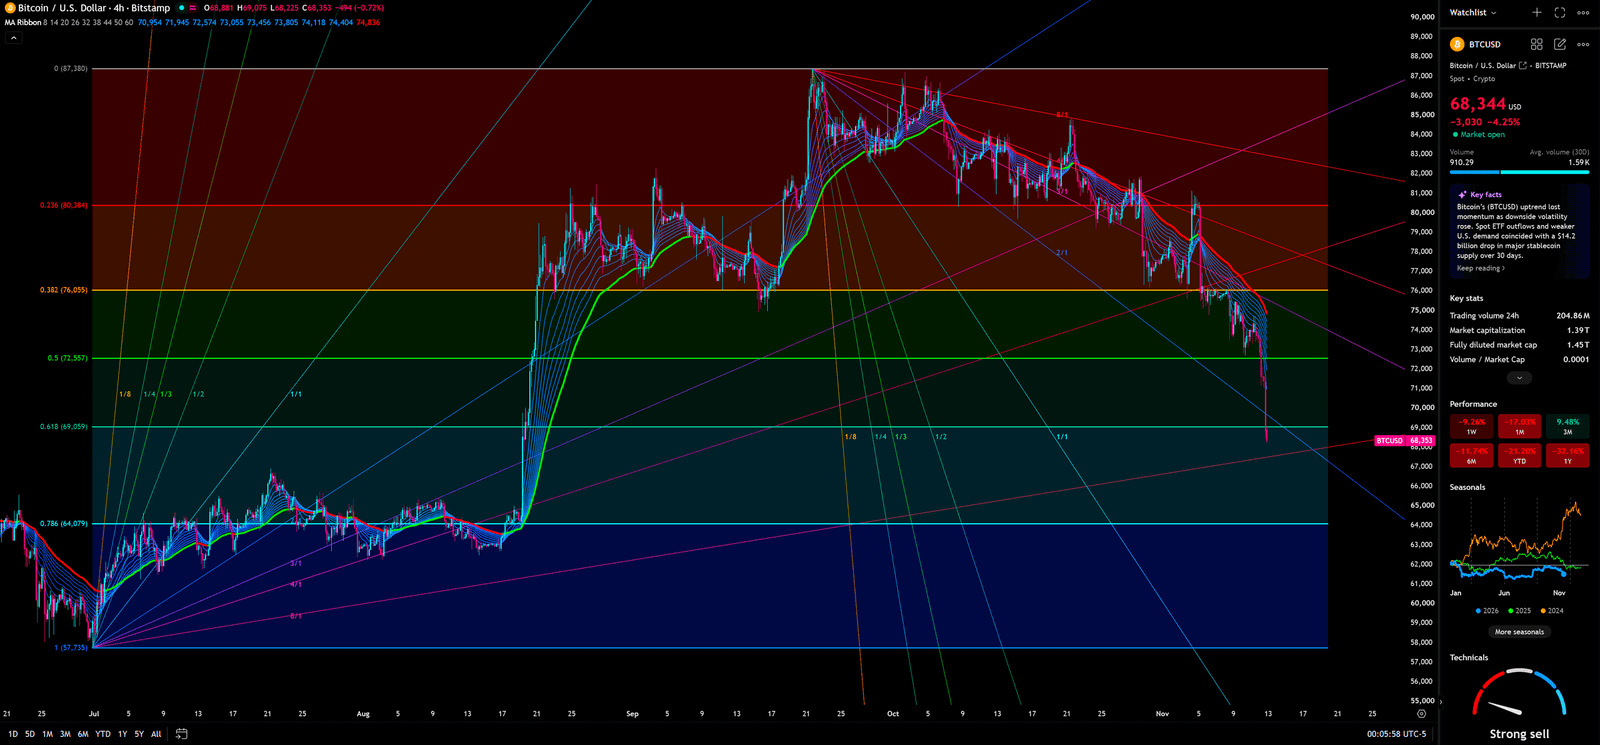
A Gann Fan uses rays from a price/time pivot to frame possible dynamic support/resistance at different slopes. It helps map changing advance rates, but depends on anchor and geometry and is no mechanical forecast. The 4-hour chart shows fan rays, a descending trend line and upper point near $87,380. Buyers must overcome the descending context. Retail may overread a ray touch; institutions could wait for a close and retest or remain cautious after failure.
The 4-hour MA Ribbon, defined earlier, is read through slope, spacing and whether price regains the cluster. It offers trend context, not a one-line trigger. At about $68,344, price is below $69,059 in a descending setup. Buyers have not reclaimed the level. Retail may anticipate it; institutions could wait for acceptance or plan around failure. A failed attempt shows resistance, not seller identity.
The 4-hour Fibonacci Retracement maps short-term reactions and remains subordinate to weekly structure. Levels: 0.382 $76,055, 0.5 $72,557, 0.618 $69,059, 0.786 $64,079, upper point near $87,380. Snapshot price is below $69,059 and above $64,079. These are not guaranteed boundaries. Retail may assume certainty; institutions could wait for a close and retest. Levels do not reveal intent.
There is no 4-hour KDJ panel. No clear Elliott labels appear, so no wave count is assigned. As a guardrail, Wave 4 cannot overlap Wave 1’s top in a 1-2-3-4-5 impulse; if it does, that hypothesis fails and a larger ABC correction may be considered. This cannot identify a current wave. Four-hour timing cannot overrule weekly structure—why let a bounce excuse higher-time-frame failure?
⚖️ Retail vs. institutions — Same candle, different risk question
The edge is not secret access to a chart; it is discipline about what the chart proves. When price plunges, who asks “How low?” and who asks “Where is my thesis invalidated?”
Retail may panic-sell after liquidation headlines or buy the first bounce from fear of missing a bottom. Institutions are not uniform: funds, market makers and leveraged desks have different mandates. The contrast is not foreknowledge, but risk frameworks that separate thesis, sizing, liquidity and execution from conviction.
The dispute is $71,008–$71,123 versus $66,412. Retail may mistake a test for breakout or the marked stop for universal advice. A disciplined operator checks close, retest and risk if it fails. A desk could plan to reduce exposure after failure or add after a hold; actual positioning is unknown.
A bank does not extend credit on promises; it checks cash flow, collateral and covenants. Here, those equivalents are close, retest and invalidation. A crowded theatre exit does not reveal the next open door: liquidations show stress, not that selling is complete.
🔀 Three scenarios — Conditions first, targets second
A forecast without invalidation is a story. What evidence would make each side change its mind? These conditional paths are educational, not guaranteed predictions.
🟢 Bullish — Reclaim, retest, then reassess
Require a daily and weekly close above $71,008–$71,123, followed by a successful retest holding that zone as support. An intraday wick is insufficient. If confirmed, chart checkpoints are $82,833, then $87,219/$87,777; they are not guaranteed targets. The chart-specific invalidation is $66,412, not universal advice. The capital signal is willingness to absorb supply above former resistance. Retail may chase the first candle and ignore the retest. Institutions could scenario-plan to add only after acceptance or sell into a failed retest. If the band cannot hold, the bullish premise weakens.
🟡 Neutral — Range-bound uncertainty
Price may range between $66,412 and $71,123 without confirming breakout or breakdown. Waiting for a confirmed close avoids forced direction. Two-sided capital and persistent supply can coexist. Retail may trade edges and ignore false breaks; an institution could reduce directional risk or wait. A hold above $71,123 shifts the framing bullish; a close below $66,412 shifts it bearish. A range withholds confirmation.
🔴 Bearish — Below $66,412, supports must prove themselves
A close below $66,412 activates the bearish scenario. Observe $62,525, $58,035 and annotated $57,270—references, not destinations. Continuation requires those levels to fail and retests to be rejected; no lower target is verified. Retail may buy each line as guaranteed support. Institutions could plan around rejected retests or cover into support; intent is unknown. A reclaim and hold of $71,008–$71,123 weakens the case.
🧾 Trading plan and conditions — Let confirmation carry the risk
The cleanest trade is often the one not taken until risk is legible. If the chart is undecided, why should a position be certain?
The S/R Flip rule is conditional: resistance decisively reclaimed and held on a retest may become support; broken support that fails to reclaim may become resistance. Bitcoin’s downtrend is not disproved by a bounce. A long framework requires a decisive daily/weekly reclaim of $71,008–$71,123 and a successful retest; a failed reclaim is not an entry signal. $66,412 is the chart’s annotated stop/invalidation reference for this setup. If hit, leave rather than widen it to avoid admitting failure. It is chart-specific, not universal advice.
A neutral framework waits inside $66,412–$71,123 for a close. Bearish continuation needs a close below $66,412 and rejected retests at $62,525, $58,035 or $57,270; no lower target is verified. Sizing depends on personal risk, volatility and horizon. Weekly structure leads; lower timeframes refine, not certify, the thesis.
A trading room limits damage by defining the condition and exit in advance. If confirmation does not arrive, waiting is valid; the market owes no clean retest. What is a signal worth if its invalidation is ignored?
🎯Conclusion and recommendation — Respect the level, not the narrative
The liquidation shock is dramatic; the chart’s verdict is pending. Will buyers reclaim resistance and keep it, or will another bounce become supply?
CoinGecko’s baseline is $68,662/-6.7%; Chart-Blitz shows a similar price but different change. Bitstamp snapshots are not one quote. Liquidations and earlier ETF outflows prove neither cause nor next move. Weekly structure is incomplete, daily MACD weak below $71,000, monthly KDJ unconfirmed, and 4-hour price below $69,059 but above $64,079.
Recommendation: require a reclaim/retest of $71,008–$71,123; use $66,412 as chart-specific invalidation; consider $82,833, $87,219, $87,777 only after bullish confirmation and $62,525, $58,035, $57,270 only after bearish confirmation and failed retests. The downtrend remains until resistance holds. If stopped, leave. The edge is knowing what changes the plan.
I will continue to closely monitor the price action of this Crypto. As soon as a critical reversal signal appears on the charts, I will update my analysis and insights right here immediately. Remember to Bookmark this page and come back often to check for the latest updates!
Want to see our full, interactive chart breakdown? If you want to learn how to draw weekly VPFR, Fibonacci, EMA Ribbon, MACD, Supertrend, and S/R Flip frameworks designed for real trading decisions. Please browse the following『Further Reading』links. Fundamental news tells you what happened. Technical analysis predicts what will happen. To master the professional framework that separates market signal from noise, explore our exclusive models at https://www.chart-blitz.com/fxcx-app/omni-chart.html?symbol=BTC.
📚Further Reading:
To help everyone gain a deeper understanding of the various technical indicators mentioned in this article, we have specially prepared the following further reading materials. These cover key analytical tools found across the weekly, daily, monthly, and 4-hour charts.
- Decoding Fibonacci Retracement: The Perfect Blend of Natural Law and Market Psychology — Fibonacci Retracement is not just a set of magical numbers; it is a manifestation of market psychology. Learning how to correctly draw and interpret Fibonacci levels is a required course for every serious trader.
- Is a Major Move Hiding in Plain Sight? Dow Theory May Already Know the Answer — As retail traders continue to chase short-term signals, experienced market readers are looking deeper — into trend structure, volume behavior, and market phases that may expose the early clues of a coming breakout.
- Understanding VPFR: Finding the Hidden Footprints of Market Makers — The Volume Profile Fixed Range (VPFR) is a powerful tool that tells us where the most trading occurred within a specific price range. This helps us identify true support and resistance levels, as well as potential ‘Vacuum Zones’.
- S/R Flip Support and Resistance Swap Strategy — S/R Flip is one of the most powerful concepts in technical analysis. This article uses real cases to teach you how to use S/R Flip to capture the highest win-rate trading opportunities.
- MACD Momentum Indicator Momentum First — What Does the MACD Line Crossing Above Zero Mean? Golden Cross & Divergence Signals!
- Gann Fan Masterclass — Deep dive into W.D. Gann’s angle theory to identify the geometric relationship between time and price in the market.
- Strategies for EMA Ribbon Bearish Alignment: Dead Cat Bounce or Real Reversal — Deep dive into the EMA Ribbon to understand the battle between short-term and long-term capital.
- Bollinger Band: Long-Term Repricing Zone — The Ultimate Tool to Capture Massive Market Moves Tired of getting shaken out of winning trades too early? Or buying right before a trend reverses? An ex-banker reveals how to use the Bollinger Band to filter out market noise and ride the big waves.
- KDJ Stochastic Indicator Bottom Confirmation — What is the implication of a downward-curving KDJ? Understand in one article how to use dynamic indicators to catch market turning points.
【Disclaimer】 The content herein is for educational purposes and reflects the author’s personal opinion only; it is not investment advice. All financial investments, including cryptocurrencies, carry significant risk, and you could lose your entire capital. To support this site, this article may contain affiliate links. While we strive for accuracy, we cannot guarantee all information is complete or error-free. Please conduct your own research and be fully responsible for your own investment decisions.