Fetching Live Market Data...
When you make a trade, you should have a clear target of where you expect to get out
William Delbert Gann – 1949
Bitcoin at $75,000 is not a comeback; it is a price where short sellers were forced to buy, retail traders were invited to applaud, and professional money quietly reopened the risk ledger.
The news tape looked magnificent, almost theatrical. BTC reclaimed the $75,000 area. Treasury longer-term bond buyback expansion was read as a liquidity relief valve. Trump-linked crypto-policy headlines and renewed CLARITY Act chatter gave the market a political costume. TheStreet reported more than $3 billion in crypto shorts liquidated, including roughly $1.67 billion tied to Bitcoin. CoinDesk showed BTC around $74,893.82–$75,400, up roughly 8%, while Kitco had Bitcoin near $75,550.84, up 8.50%. Retail saw salvation. A trading room saw something less romantic: who was forced to transact, who had room to distribute, and who had just bought a headline after the price had already moved.
The colder reversal came from the chart, not the press release. The working Chart-Blitz technical baseline sits near $76,300, while outside quote feeds such as CoinDesk and Kitco naturally show a 1%–2% time-and-exchange discrepancy. That difference is noise; the structure is not. BTC did not merely need to cross $75,000. It needed to prove that $75,983 — the weekly Lower High marked on the chart — was no longer a ceiling. The chart had warned earlier that the Dow downtrend stays intact. So the question is ugly but necessary: was $75K a breakout, or just the revolving door where trapped shorts paid the bill and late retail supplied the exit liquidity?
News-First Catalyst Deconstruction: The Headline Was the Match, Not the Fire
The market did not rise because a headline became true; it rose because positioning became vulnerable, so who exactly was forced to buy?
Treasury expanding longer-term bond buybacks was interpreted as a liquidity-supportive development. In plain English, the market decided that dollar funding pressure might ease at the margin. That matters for risk assets, especially leveraged ones, because easier liquidity reduces the immediate fear of forced balance-sheet shrinkage. But liquidity interpretation is not the same as trend confirmation. A central-bank desk veteran would call this the repo-room mirage: funding air can improve for a morning without turning every speculative asset into a fresh bull market.
The crypto-policy catalyst added narrative fuel. Trump-related crypto-policy headlines, industry engagement, and CLARITY Act discussion gave traders a ready-made story about regulatory normalization. That story is useful because markets need language after price moves; it is less useful as proof that long-term capital has underwritten the rally. The political headline was the glossy cover on the structured-note term sheet. The risk still sat in the footnotes.
The liquidation data is the blunt instrument. More than $3 billion in crypto shorts reportedly liquidated, with roughly $1.67 billion in BTC shorts, means the rally included a large forced-buying component. Forced buying is powerful, fast, and often emotionally convincing. It is also frequently unstable. Short covering can shove price through a round number, but it cannot by itself build a durable trend. For that, price must hold retests, absorb profit-taking, respect volume congestion, and break the sequence of lower highs.
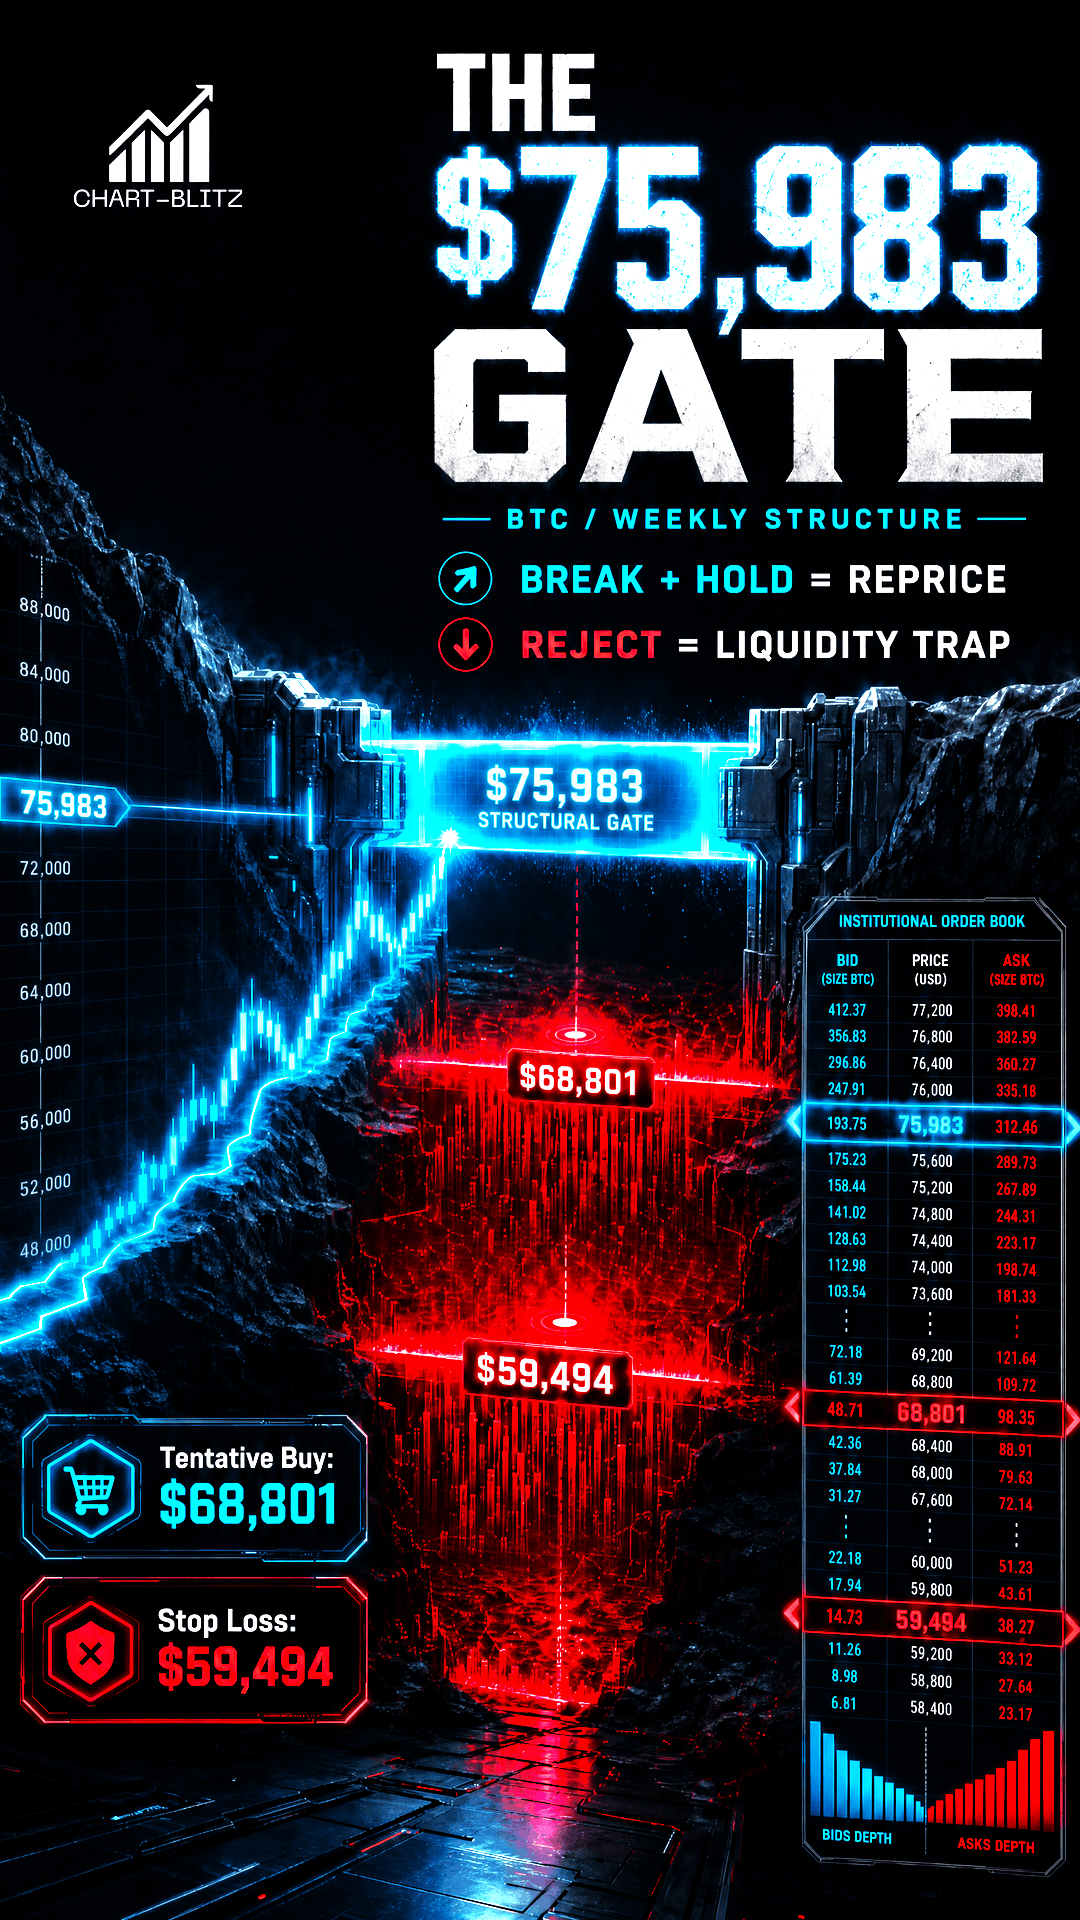
That is why the $75,000 spectacle deserves suspicion. Retail tends to read a large green candle as proof of “smart money buying.” The better question is whether capital was willingly accumulating spot exposure or whether derivatives desks were mechanically closing pain. Institutions use these moments as liquidity auctions: if enough emotional buyers arrive, larger players can hedge, rebalance, or distribute without moving the market against themselves. The trigger that separates squeeze from trend is acceptance above $75,983; the invalidation is a slide back through $68,801 and, eventually, the chart stop at $59,494.
【📊Analysis Baseline Statement】
All technical analyses below are based on the price snapshot locked on August 21, 2026 (EST): 03:50 Bitcoin (BTC) = $76,375 USD. Please treat this report as an “analytical map” rather than a real-time quote.
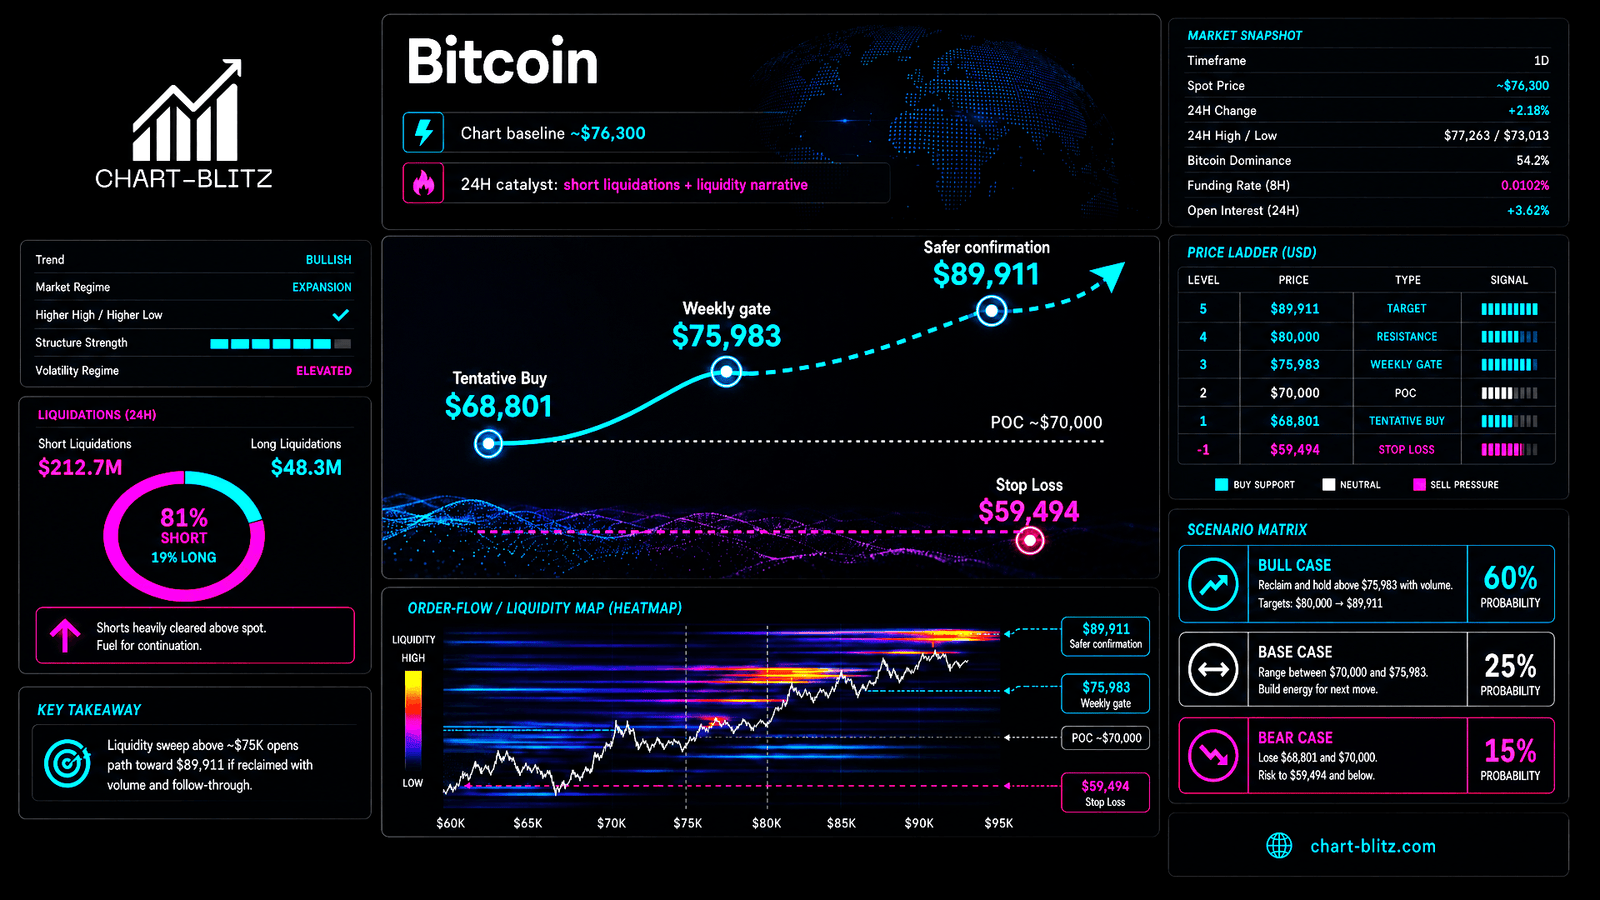
BTC $76,300 Is the Crime Scene, Not the Verdict
The baseline is close enough to the frenzy to confuse amateurs and far enough from confirmation to keep professionals cold, so why worship the last traded price?
This analysis uses an approximate chart baseline near $76,300, with the daily chart around $76,286 and the monthly chart around $76,295. Kitco’s quote near $75,550.84 and CoinDesk’s range around $74,893.82–$75,400 reflect different timestamps, exchanges, and data-handling windows. A 1%–2% discrepancy in Bitcoin is not a scandal; it is Tuesday in a fragmented market.
The relevant map is multi-timeframe. The weekly chart carries the institutional structure: the EMA/MA Ribbon, VPFR congestion near $70,000, Dow Theory labels, weekly MACD divergence, and the annotated trading levels. The daily chart tests whether the rally is repairing structure or merely rebounding into resistance. The monthly chart frames volatility and long-cycle momentum with Bollinger Bands and KDJ. The 4-hour chart exposes the liquidation path from roughly $64,000 to $76,645 through Gann angles, an EMA Ribbon, and Fibonacci levels.
The discipline is simple. Price evidence comes first, indicator mechanism second, capital behavior third, retail misread fourth, institutional use fifth, and trigger or invalidation last. Anything else is astrology wearing a Bloomberg terminal badge.
Aha Moment: The Chart Already Said the Downtrend Was Still Alive
The seductive part of this move is that $75,000 feels like a psychological victory, but why did the weekly chart refuse to celebrate?
The answer is Dow Theory. Dow Theory studies trend through confirmed sequences of highs and lows. In a real bullish reversal, a market stops printing lower highs and lower lows, then begins to establish higher highs and higher lows. Bitcoin’s weekly chart still marks Lower Highs at $97,939, $82,833, and $75,983, with Lower Lows at $80,537, $62,525, and $58,035. It also marks a Swing High at $125,725 and Swing Low at $107,389, while explicitly stating that the Dow downtrend stays intact.
That is the catch. A price burst through $75,000 can look dramatic on a phone screen, but the weekly chart still asks whether $75,983 has been conquered. Retail sees the round number. Institutions see the last lower-high checkpoint. Evidence: price is hovering around the third Lower High. Mechanism: Dow Theory requires a break in the lower-high/lower-low sequence. Capital behavior: professional money waits for acceptance rather than emotion. Retail misread: “$75K is back, therefore bull market.” Institutional use: test whether breakout buyers can hold the line. Trigger: weekly acceptance above $75,983 and then progression toward $82,833. Invalidation: failure back below $68,801, with deeper failure near $59,494.
📈 Weekly Chart: $75,983 Is the Witness Stand, Not the Victory Podium
The weekly chart is where Bitcoin must testify under oath, and the first question is whether the downtrend has actually been broken?
Weekly Timeframe for BTC (Bitcoin)
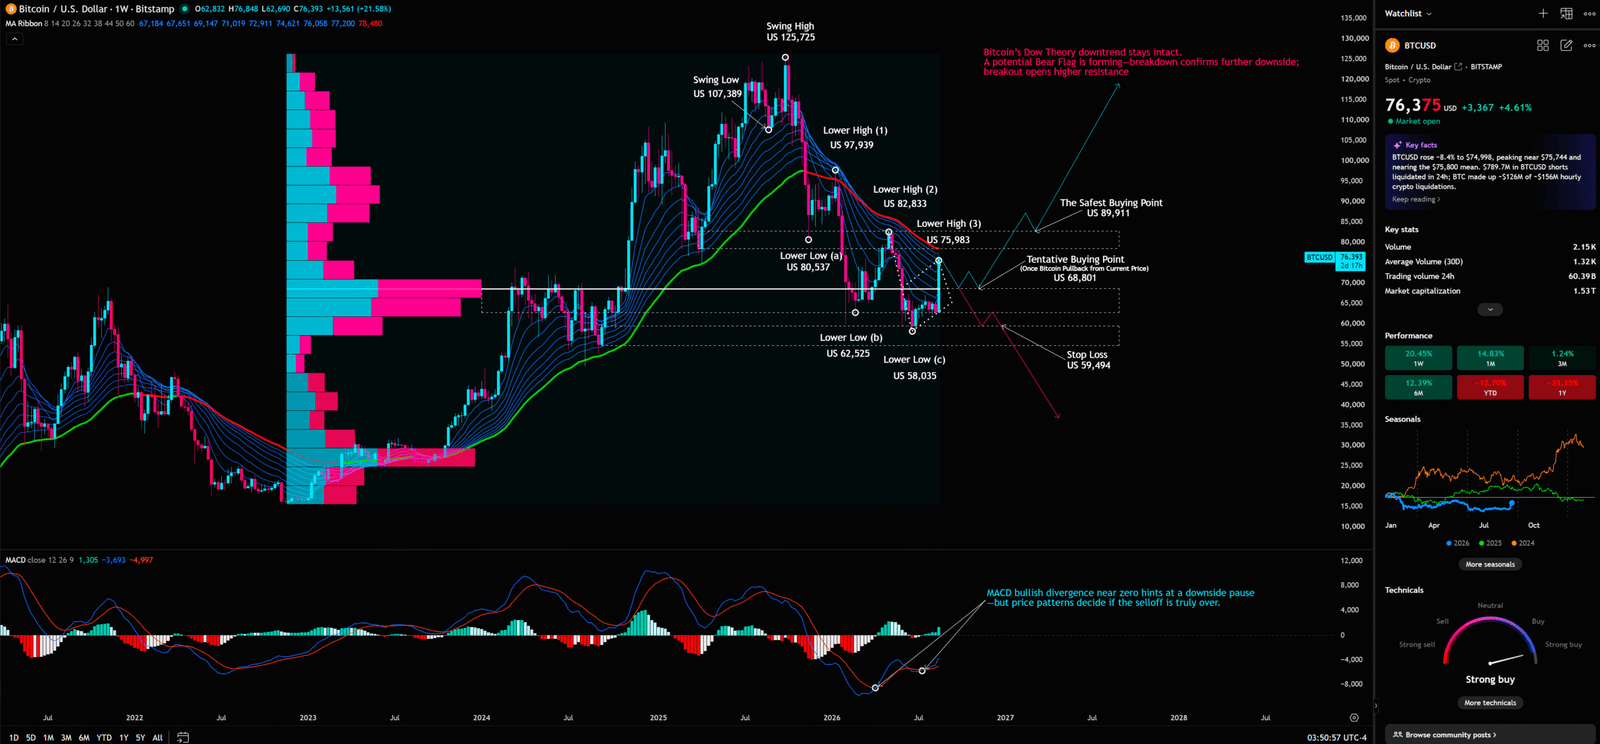
The weekly Dow labels dominate the case. The visible sequence — LH $97,939, LH $82,833, LH $75,983; LL $80,537, LL $62,525, LL $58,035 — says rallies have been sold at progressively lower levels and breakdowns have printed progressively lower troughs. That is not a bull trend; it is a bear structure trying to look respectable after a short squeeze. Price evidence points to a test of the third Lower High. The Dow mechanism says a trend remains intact until the swing sequence is broken. Capital behavior shows large players reducing risk into rebounds until proven otherwise. Retail misreads the green candle as victory. Institutions use $75,983 as a liquidity checkpoint. The trigger is a weekly reclaim and hold above $75,983; the invalidation of the rebound case begins below $68,801.
The weekly VPFR is the next key instrument. VPFR, or Volume Profile Fixed Range, displays traded volume by price rather than by time; its Point of Control, or POC, is the price zone with the highest traded volume in the selected range. On this chart, the POC and congestion sit around $70,000. That matters because high-volume zones act like old bank vaults: capital has been locked, exchanged, financed, and hedged there. Evidence: weekly congestion clusters near $70,000. Mechanism: volume profile highlights where the most ownership changed hands. Capital behavior: if momentum fades above $75,983, price can magnetize back toward the area where most participants have cost basis. Retail misreads a return to $70,000 as “cheap.” Institutions use it to assess real spot demand and stop density. Trigger: $68,801 holds as the tentative buying area. Invalidation: a clean loss of $68,801 opens pressure toward $62,525 and $59,494.
The weekly EMA Ribbon adds the cost-basis layer. An EMA, or exponential moving average, weights recent prices more heavily; an MA, or simple moving average, smooths price over a chosen period. A ribbon combines multiple averages to show a broad dynamic cost zone rather than one fragile line. Evidence: BTC is rebounding into or around the weekly ribbon after trading from below. Mechanism: the ribbon shows whether intermediate holders are underwater, breaking even, or regaining profit. Capital behavior: trapped holders often sell when price revisits their cost band. Retail misreads a touch or brief poke through moving averages as a new bull trend. Institutions use the ribbon as a supply test, waiting to see whether pullbacks are bought. Trigger: price holds above the ribbon and above $75,983. Invalidation: a ribbon rejection followed by a break under $68,801.
Weekly MACD introduces hope, but not permission. MACD, or Moving Average Convergence Divergence, compares two moving averages to track momentum; divergence occurs when price makes weaker lows while momentum fails to confirm that weakness. The weekly chart shows bullish divergence, but not full reversal confirmation. Evidence: momentum has improved relative to price weakness. Mechanism: bearish force may be losing intensity. Capital behavior: sellers may be tiring, but buyers have not yet proven control. Retail misreads divergence as an automatic buy signal. Institutions use divergence to prepare watchlists, not to abandon risk controls. Trigger: divergence confirms only if price breaks and holds above structural resistance. Invalidation: loss of $68,801 turns the divergence into another attractive trap.
The annotated weekly levels define the risk ladder. The chart marks Tentative Buying Point $68,801, Safest Buying Point $89,911, and Stop Loss $59,494. Evidence: these are visible chart annotations, not invented targets. Mechanism: each level separates different degrees of confirmation and risk. Capital behavior: aggressive capital may test near $68,801; conservative capital waits for stronger confirmation near $89,911. Retail misreads “buying point” as a command to go all-in. Institutions use it as position sizing architecture. Trigger: $68,801 must hold for the tentative long thesis; $89,911 is the safer confirmation zone after stronger structural repair. Invalidation: $59,494 is the stop level, and if reached, the trade thesis must be treated as broken.
Elliott Wave can be mentioned only as secondary support here. If a bullish 1-2-3-4-5 impulse is being considered, Wave 4 bottom cannot overlap Wave 1 top. If the Wave 1 top fails, the bullish impulse hypothesis is invalid and the structure may instead be an A-B-C correction. Evidence on the chart is insufficient to force a full wave count. Mechanism: Elliott rules can help reject fantasy counts. Capital behavior: professionals do not pay for fairy tales drawn after the fact. Retail misreads wave labels as prophecy. Institutions use wave logic only as a secondary filter behind Dow structure. Trigger: structural highs must break; invalidation comes if the assumed impulse violates the Wave 1 overlap rule.


📊 Daily Chart: $76,286 Is Above One Fib Line and Still Below the Real Interrogation Room
The daily chart looks healthier, but is health the same as strength?
Daily Timeframe for BTC (Bitcoin)
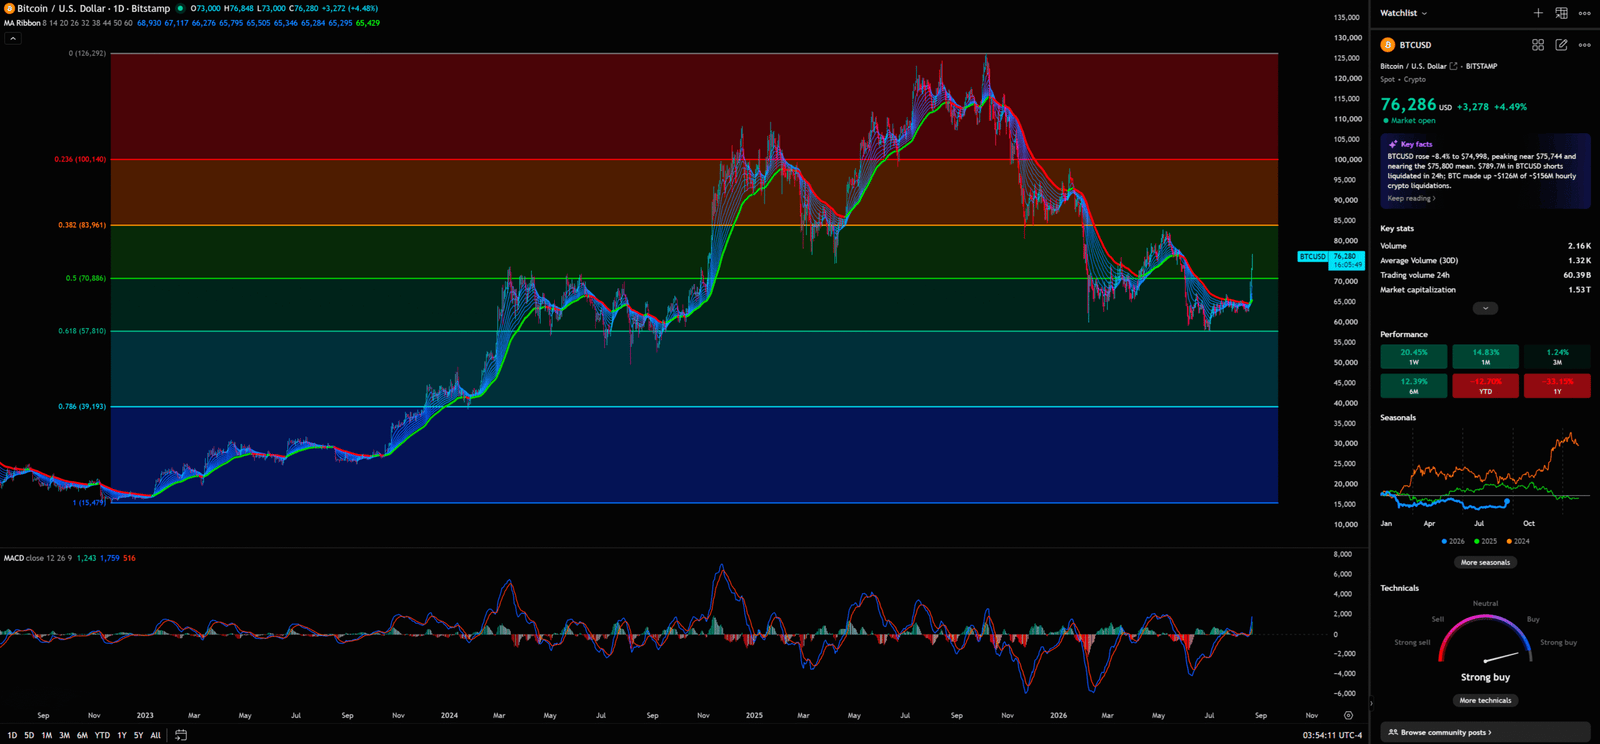
The daily Fibonacci retracement grid shows $100,140, $83,961, $70,865, $57,810, $39,193, and $15,471, with BTC around $76,286. Fibonacci retracement uses proportional levels to judge how much of a prior move has been recovered. Evidence: price has moved above $70,865 but remains below $83,961. Mechanism: reclaiming $70,865 suggests repair from the lower zone, while failure below $83,961 means the market has not reclaimed the stronger retracement band. Capital behavior: short-term buyers gained control, but medium-term supply may still wait overhead. Retail misreads being above $70,865 as safety. Institutions use the $82,833 weekly lower high and $83,961 daily Fib cluster as a supply checkpoint. Trigger: daily acceptance toward $83,961. Invalidation: loss of $70,865 followed by pressure on $68,801.
The daily EMA Ribbon shows whether recent buyers are gaining control of the operating cost zone. A daily EMA Ribbon compresses several exponential averages into a moving support-resistance field. Evidence: price is recovering around the ribbon area after the rally. Mechanism: if shorter averages start to lift and price holds them, momentum buyers gain confidence; if the ribbon remains tangled or rejects price, the rally is still only a rebound. Capital behavior: systematic funds often respond to moving-average acceptance rather than headlines. Retail misreads ribbon contact as “trend confirmed.” Institutions use the ribbon to see whether late shorts have truly lost control. Trigger: a pullback that holds above the ribbon and respects $70,865/$68,801. Invalidation: a daily close back below these zones with expanding selling pressure.
The daily horizontal structure is more brutal than the round-number story. Current price around $76,286 is only slightly above the weekly $75,983 lower high. Evidence: the market is not meaningfully distant from the resistance it claims to have broken. Mechanism: marginal breaks often attract breakout orders before reversing. Capital behavior: liquidity above obvious levels lets larger players execute with less slippage. Retail misreads a $300–$500 cushion in Bitcoin as a decisive breakout. Institutions use the thin margin above $75,983 to test whether new buyers can defend. Trigger: consecutive daily closes above $75,983 and a successful retest. Invalidation: a daily reversal back below $75,983 that drags price toward $70,865.
Daily MACD provides a recovery signal, not a coronation. As on the weekly chart, MACD tracks momentum through moving-average relationships; bullish divergence signals that downside momentum has weakened relative to price. Evidence: the daily chart shows MACD recovery and bullish divergence. Mechanism: sellers may have lost momentum, allowing a squeeze and recovery. Capital behavior: momentum funds may cover shorts or start tactical longs, but trend allocators still require confirmation. Retail misreads MACD recovery as “the bottom is in.” Institutions use it to justify probing only if price structure cooperates. Trigger: $83,961 becomes the confirmation objective. Invalidation: loss of $70,865 and $68,801.
The daily chart therefore carries a split verdict. Evidence supports a rebound. Indicator mechanism supports momentum repair. Capital behavior suggests short covering plus tactical buying. Retail misreads it as a clean trend reversal. Institutions use it as a conditional setup. Trigger: hold $75,983 and advance toward $82,833/$83,961. Invalidation: reject $75,983 and break $68,801. That is why chasing above $76,000 is not disciplined trading; it is paying retail spread at the casino cage.
📉 Monthly Chart: Long-Term Momentum Is Stirring, but the Judge Has Not Signed the Order
The monthly chart whispers possibility, but why would anyone confuse a whisper with a verdict?
Monthly Timeframe for BTC (Bitcoin)
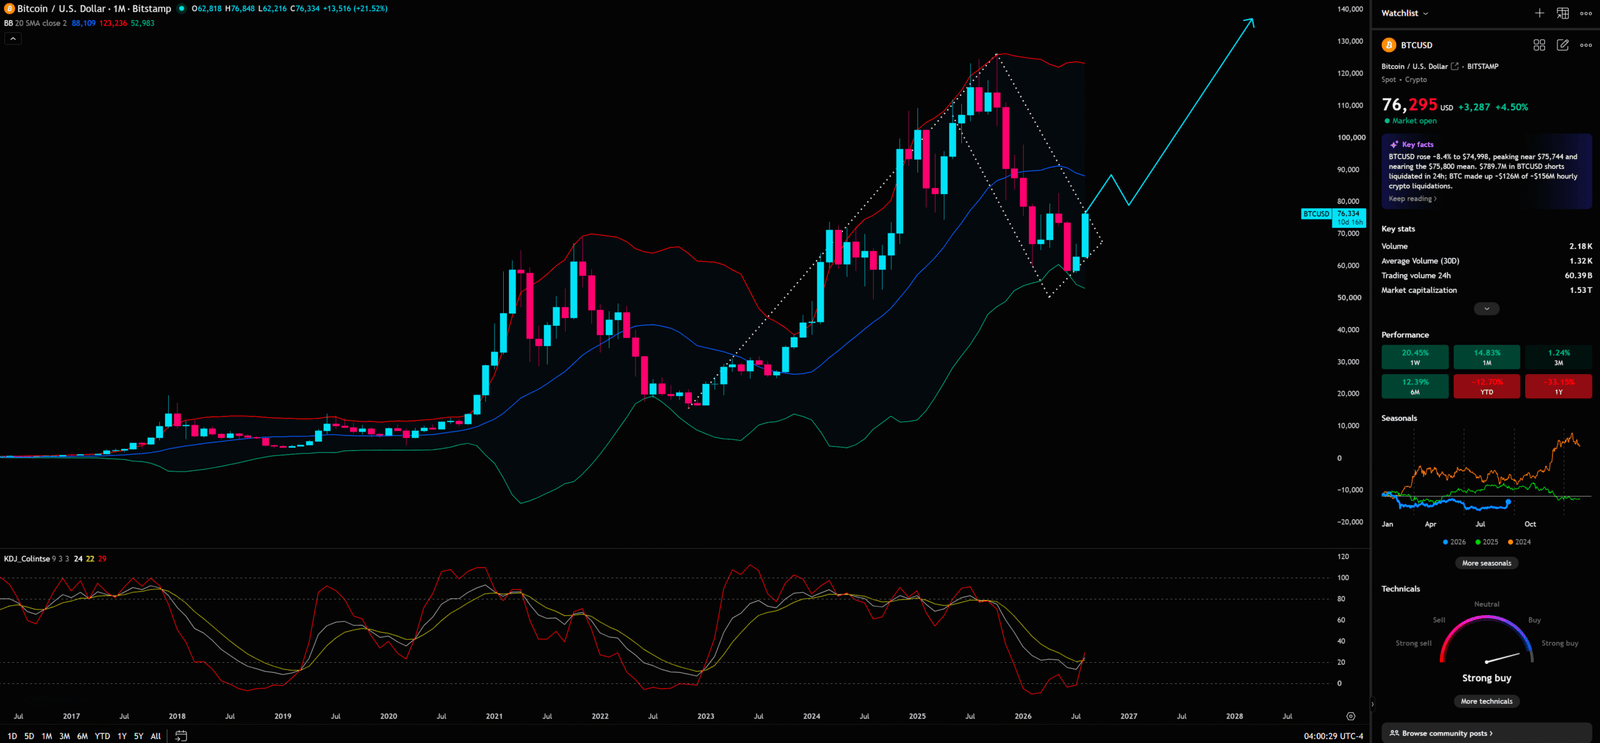
Monthly Bollinger Bands frame the volatility backdrop. Bollinger Bands place an upper and lower band around a moving average using standard deviations, helping identify whether price is stretched, compressed, or reverting toward value. The chart shows BTC around $76,295, positioned between the middle and lower band or near the middle band; exact band values are unconfirmed. Evidence: price has rebounded from weaker territory toward the middle zone. Mechanism: the middle band often behaves like a long-cycle value line. Capital behavior: long-term capital may reassess exposure near this area rather than chase blindly. Retail misreads a move back toward the middle band as a guaranteed long-term reversal. Institutions use it to ask whether the market can reclaim value and hold. Trigger: sustained acceptance near or above the middle band. Invalidation: failure that pushes price back toward the lower-band region.
Monthly volatility positioning matters because bands can compress or expand. Evidence: price is not confirmed in a strong upper-band expansion. Mechanism: without expansion above the middle band, Bollinger Bands describe stabilization more than impulse. Capital behavior: macro allocators often scale only when volatility expansion confirms direction. Retail misreads stabilization as inevitability. Institutions use the monthly band location as a risk-budget input, not a buy button. Trigger: monthly strength aligning with weekly breakouts. Invalidation: weekly structure failing before monthly improvement matures.
Monthly KDJ is turning up from low levels. KDJ is a stochastic-style momentum indicator using K, D, and J lines to track where price sits relative to its recent range; it is sensitive to turns from oversold or low-momentum areas. Evidence: KDJ is turning upward from low levels. Mechanism: downside momentum may be normalizing, creating a rebound window. Capital behavior: longer-horizon traders may begin watching for accumulation conditions. Retail misreads a KDJ turn as permission to front-run the entire reversal. Institutions use it to prepare, then demand price confirmation on lower timeframes and weekly structure. Trigger: KDJ improvement combined with $75,983 support and later $82,833/$89,911 progress. Invalidation: loss of $68,801 and then $59,494.
📐 4-Hour Analysis: The $64K-to-$76,645 Surge Was a Liquidation Firework, Not Yet a Treasury Auction
The 4-hour chart is where the move looks most intoxicating, but what usually happens after a liquidation firework burns too hot?
4-Hour Timeframe for BTC (Bitcoin)
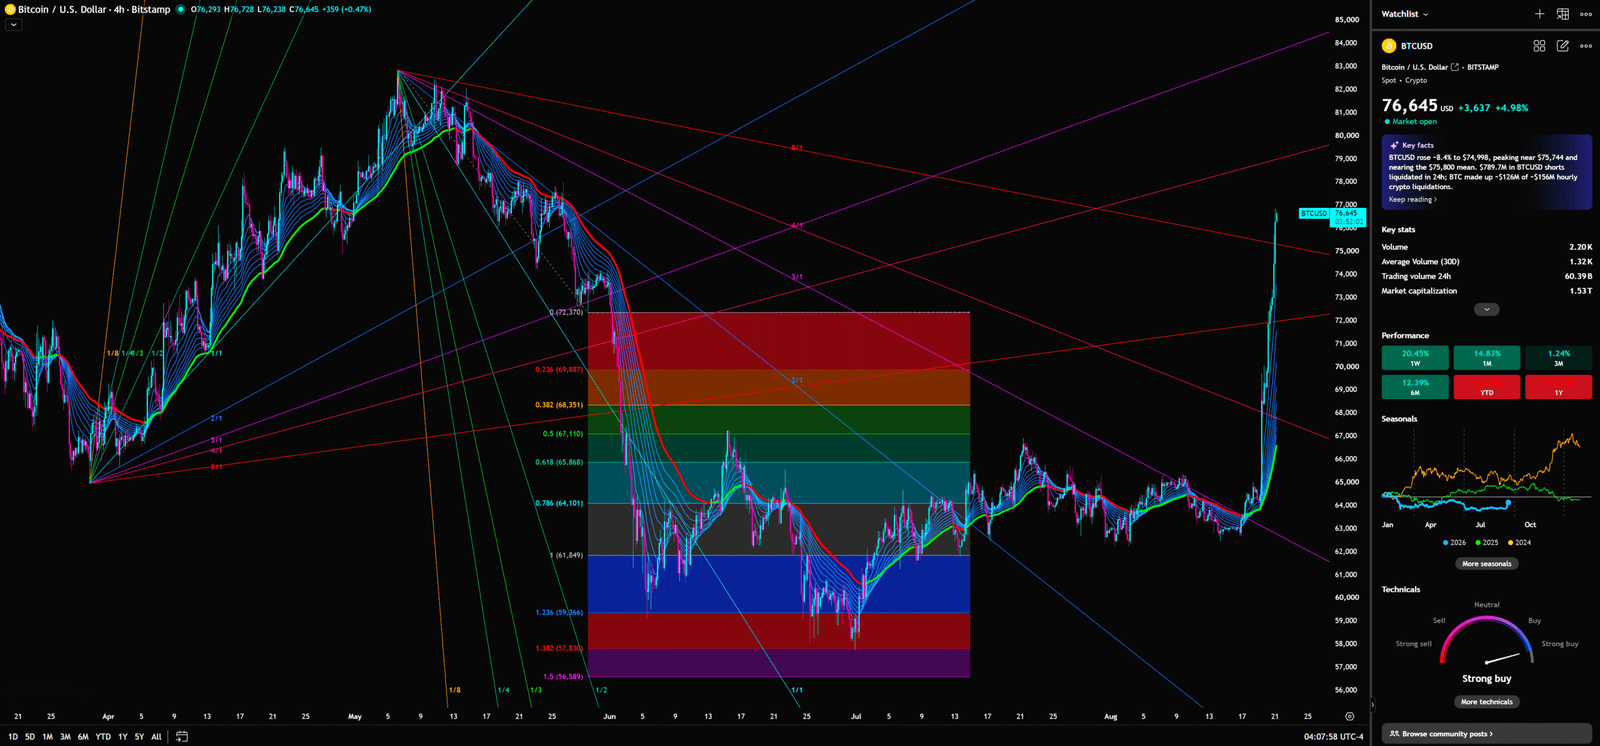
BTC rose from roughly $64,000 to $76,645 on the 4-hour chart. That is a violent move, and violent moves often reveal liquidation chains better than organic accumulation. Evidence: price traveled quickly through short-term structure. Mechanism: leveraged shorts, stop orders, and momentum algos can create self-feeding bursts. Capital behavior: fast money buys because price is moving, while forced shorts buy because risk systems demand it. Retail misreads speed as conviction. Institutions use the surge to locate where actual demand appears after the squeeze fades. Trigger: pullbacks hold key Fibonacci and EMA zones. Invalidation: sharp loss of the $69,487–$68,351 area.
The 4-hour Gann Fan requires humility. Gann angles attempt to relate price movement to time, with certain angles treated as balance or acceleration lines depending on chart scale and anchor choice. Evidence: the chart shows Gann Fan/angles. Mechanism: angles can help judge whether price is accelerating, stalling, or losing slope. Capital behavior: short-term traders may respond when price fails to hold an advancing angle. Retail misreads every diagonal line as sacred geometry. Institutions use angles only as secondary timing references. Trigger: price maintains the relevant upward angle while holding horizontal levels. Invalidation: loss of the angle plus a break under nearby Fibonacci support. Not every diagonal should be forced into a parallel channel.
The 4-hour Fibonacci levels are precise and useful. The visible levels are $69,487, $68,351, $67,110, $65,868, $64,101, $59,366, $57,830, and $56,589. Evidence: after the rally to $76,645, the $69,487–$68,351 band becomes the first serious pullback zone. Mechanism: Fibonacci retracement levels estimate where buyers may defend part of the impulse. Capital behavior: disciplined traders wait for a retest rather than chase the high. Retail misreads a pullback as “missed opportunity” or “crash” depending on mood. Institutions use the zone to measure limit-bid depth. Trigger: $69,487–$68,351 holds, especially near the weekly $68,801 tentative buying point. Invalidation: failure below that band exposes $67,110 and $65,868.
The 4-hour EMA Ribbon defines short-term trader cost. Evidence: price surged through the ribbon and extended above it. Mechanism: the ribbon shows where recent momentum participants are likely positioned. Capital behavior: when price stretches far above short-term cost, profit-taking becomes rational. Retail misreads distance above the ribbon as strength without considering mean reversion. Institutions use the ribbon retest to see whether the rally has real sponsorship. Trigger: price pulls back into the ribbon and holds above $68,801. Invalidation: a clean break below the ribbon and below $68,351.
The 4-hour chart has no clear lower-panel indicator in the visible facts, so no RSI, MACD, KDJ, or DMI should be invented. Evidence must stay inside the chart. Mechanism without a visible lower-panel signal must rely on price, EMA Ribbon, Gann angles, and Fibonacci. Capital behavior remains the same: price acceleration attracts leverage, and leverage demands liquidation points. Retail misreads missing indicators by filling the blank with conviction. Institutions use the absence of lower-panel confirmation as a reason to respect price levels more strictly. Trigger: $75,983 holds from above after a pullback. Invalidation: failure under $68,801.
The 4-hour conclusion is tactical, not strategic. Evidence shows a sharp rebound from about $64K to $76,645. Indicator mechanisms show price extending through short-term cost and testing time-price angles. Capital behavior suggests forced buying and momentum participation. Retail misreads the fireworks as a durable regime shift. Institutions use the aftermath to buy weakness only if it holds. Trigger: defend $69,487–$68,351 and reclaim $75,983 after retest. Invalidation: break $68,801, then the squeeze narrative starts leaking air.
Retail vs Institutions: Same Candle, Opposite Business Model
One green candle can make a retail trader feel rich and make an institution ask where the exits are, so which side is actually thinking like capital?
Retail buys news, round numbers, influencer screenshots, and the emotional relief of not missing out. Institutions buy liquidity, risk-defined entries, stop placement, and exit depth. Retail sees $75,000 and thinks the train has left. Institutions see $75,983 and ask whether the last Lower High has truly failed. Retail asks, “How high can it go?” Institutions ask, “Where is the invalidation, and who is trapped if it breaks?”
This is the old private-bank trick in market clothing: the lobby serves champagne while the credit committee reads covenants. The headline is the champagne. The weekly Dow downtrend is the covenant. Evidence shows $75K regained but $75,983 not yet convincingly neutralized. Mechanism shows liquidation and moving-average recovery without full trend reversal. Capital behavior shows tactical repositioning. Retail misreads it as certainty. Institutions use it as optionality. Trigger: hold above $75,983 and progress toward $82,833/$89,911. Invalidation: lose $68,801 and then respect the stop at $59,494.
🎯 Scenarios: Will Patience Be Rewarded, or Will Greed Be Taxed?
The next move does not need a slogan; it needs levels, so which scenario earns the right to survive?
Bullish scenario: BTC holds $68,801, reclaims and holds $75,983, then targets $82,833 and $89,911. Evidence: $68,801 is the tentative buying point, $75,983 is the weekly Lower High, $82,833 is the prior Lower High, and $89,911 is the safest buying point annotation. Mechanism: Dow structure begins to weaken if lower highs are reclaimed. Capital behavior: institutions gain confidence only after acceptance and retests. Retail misread: chasing the first break instead of waiting for confirmation. Institutional use: add exposure on defended retests. Trigger: sustained hold above $75,983. Invalidation: below $59,494.
Bearish scenario: BTC rejects $75,983 and breaks $68,801. Evidence: the weekly downtrend remains intact and the POC/congestion near $70,000 can fail as support. Mechanism: failed breakouts create trapped longs and renewed selling pressure. Capital behavior: professional money sells into failed acceptance and targets lower liquidity. Retail misread: calling every dip a discount. Institutional use: press weakness toward $62,525, $59,494, and $58,035. Trigger: rejection at $75,983 plus loss of $68,801. Invalidation: reclaim and hold above $75,983 with follow-through toward $82,833.
Neutral scenario: BTC chops between $68,801 and $75,983, with the weekly VPFR POC near $70,000 acting as a magnet. Evidence: price remains trapped between tentative support and lower-high resistance. Mechanism: high-volume zones attract mean reversion when trend confirmation is absent. Capital behavior: market makers harvest range traders and impatient breakout buyers. Retail misread: treating every range-edge move as destiny. Institutional use: trade inventory around the POC and wait for a clean break. Trigger: decisive range resolution. Invalidation: none until either boundary breaks with acceptance.
Trading Plan: Do Not Chase Price
The market does not discount seats because a trader arrived late, so why pay up after the squeeze?
Aggressive traders may only consider a small, risk-defined test if BTC pulls back toward $68,801 and holds with evidence of absorption. That means no heroic buying simply because price printed $76,000 after liquidations. The stop must respect $59,494. If price reaches that stop, the thesis is broken and the position must be exited. Romance belongs in novels, not on a derivatives blotter.
Moderate traders should wait for BTC to hold $75,983 from above, then assess whether price can approach $82,833 and $83,961 without immediate rejection. Conservative traders should wait for stronger confirmation near $89,911, the chart’s safest buying point. That may feel late to retail, which is exactly the point. Professionals are paid to survive; amateurs are entertained by being early. The clean plan is this: do not chase price. Let the market prove whether $75,983 has changed from resistance into support. Let $68,801 decide whether the rebound has a foundation. Let $59,494 define where the idea is wrong. Any entry without an invalidation level is not a trade; it is a donation to the liquidity pool.
I will continue to closely monitor the price action of this Crypto. As soon as a critical reversal signal appears on the charts, I will update my analysis and insights right here immediately. Remember to Bookmark this page and come back often to check for the latest updates!
Want to see our full, interactive chart breakdown? If you want to learn how to draw weekly VPFR, Fibonacci, EMA Ribbon, MACD, Supertrend, and S/R Flip frameworks designed for real trading decisions. Please browse the following『Further Reading』links. Fundamental news tells you what happened. Technical analysis predicts what will happen. To master the professional framework that separates market signal from noise, explore our exclusive models at https://www.chart-blitz.com/fxcx-app/omni-chart.html?symbol=BTC.
📚Further Reading:
To help everyone gain a deeper understanding of the various technical indicators mentioned in this article, we have specially prepared the following further reading materials. These cover key analytical tools found across the weekly, daily, monthly, and 4-hour charts.
- Decoding Fibonacci Retracement: The Perfect Blend of Natural Law and Market Psychology — Fibonacci Retracement is not just a set of magical numbers; it is a manifestation of market psychology. Learning how to correctly draw and interpret Fibonacci levels is a required course for every serious trader.
- Is a Major Move Hiding in Plain Sight? Dow Theory May Already Know the Answer — As retail traders continue to chase short-term signals, experienced market readers are looking deeper — into trend structure, volume behavior, and market phases that may expose the early clues of a coming breakout.
- Understanding VPFR: Finding the Hidden Footprints of Market Makers — The Volume Profile Fixed Range (VPFR) is a powerful tool that tells us where the most trading occurred within a specific price range. This helps us identify true support and resistance levels, as well as potential ‘Vacuum Zones’.
- S/R Flip Support and Resistance Swap Strategy — S/R Flip is one of the most powerful concepts in technical analysis. This article uses real cases to teach you how to use S/R Flip to capture the highest win-rate trading opportunities.
- MACD Momentum Indicator Momentum First — What Does the MACD Line Crossing Above Zero Mean? Golden Cross & Divergence Signals!
- Gann Fan Masterclass — Deep dive into W.D. Gann’s angle theory to identify the geometric relationship between time and price in the market.
- Strategies for EMA Ribbon Bearish Alignment: Dead Cat Bounce or Real Reversal — Deep dive into the EMA Ribbon to understand the battle between short-term and long-term capital.
- Bollinger Band: Long-Term Repricing Zone — The Ultimate Tool to Capture Massive Market Moves Tired of getting shaken out of winning trades too early? Or buying right before a trend reverses? An ex-banker reveals how to use the Bollinger Band to filter out market noise and ride the big waves.
- KDJ Stochastic Indicator Bottom Confirmation — What is the implication of a downward-curving KDJ? Understand in one article how to use dynamic indicators to catch market turning points.
【Disclaimer】 The content herein is for educational purposes and reflects the author’s personal opinion only; it is not investment advice. All financial investments, including cryptocurrencies, carry significant risk, and you could lose your entire capital. To support this site, this article may contain affiliate links. While we strive for accuracy, we cannot guarantee all information is complete or error-free. Please conduct your own research and be fully responsible for your own investment decisions.