When you make a trade, you should have a clear target of where you expect to get out
William Delbert Gann – 1949
A Pattern Is Not a Picture — It Is a Supply-and-Demand Battle.
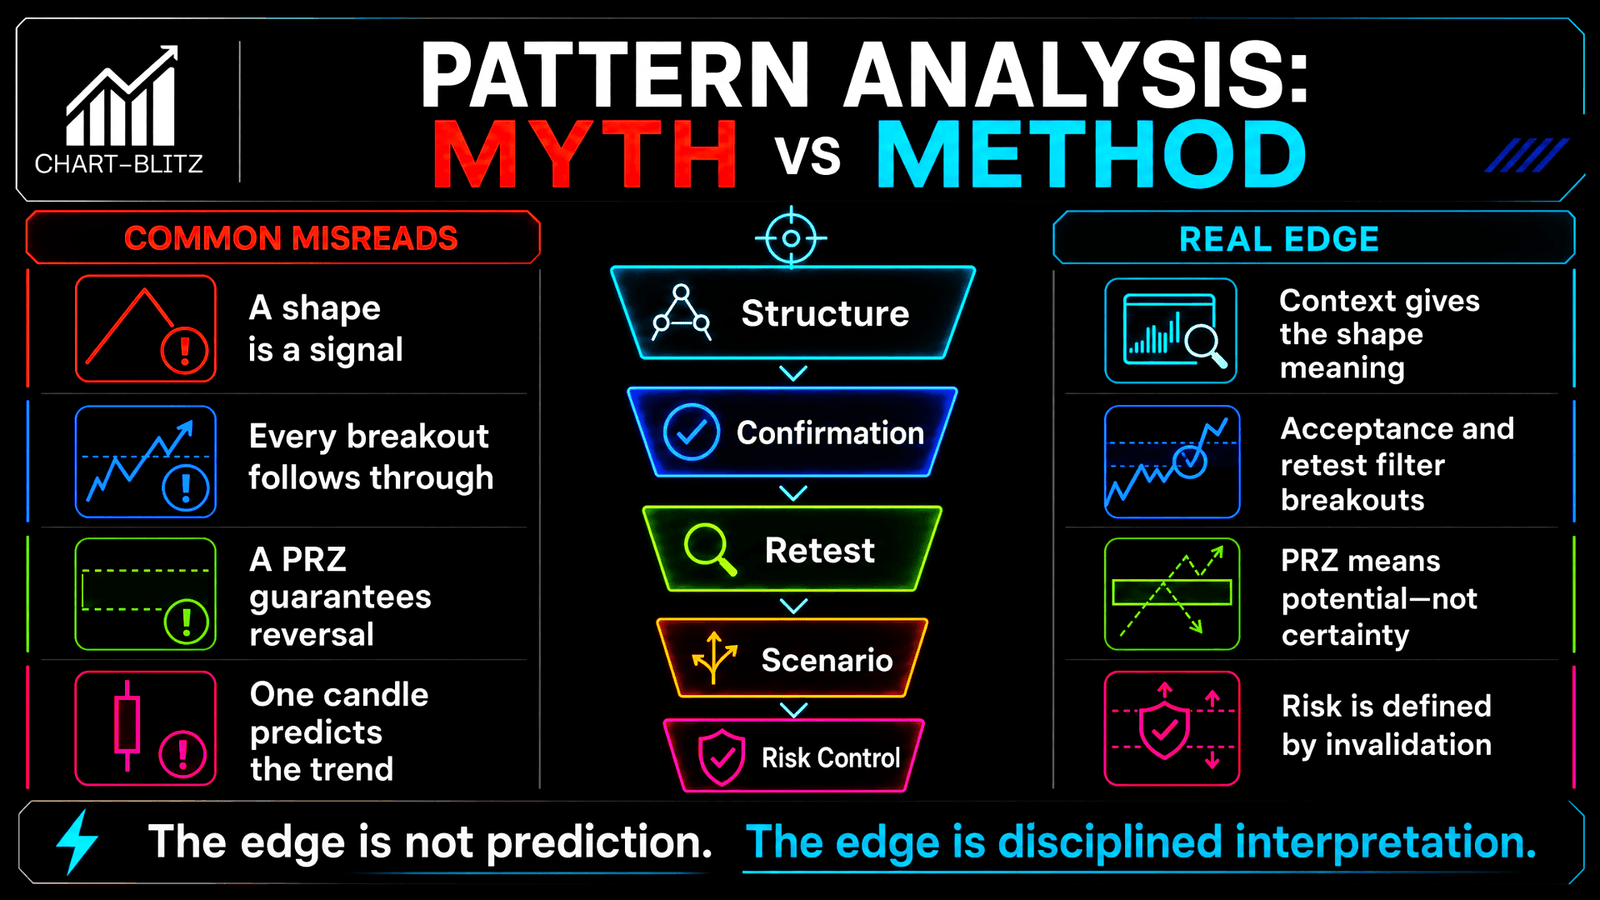
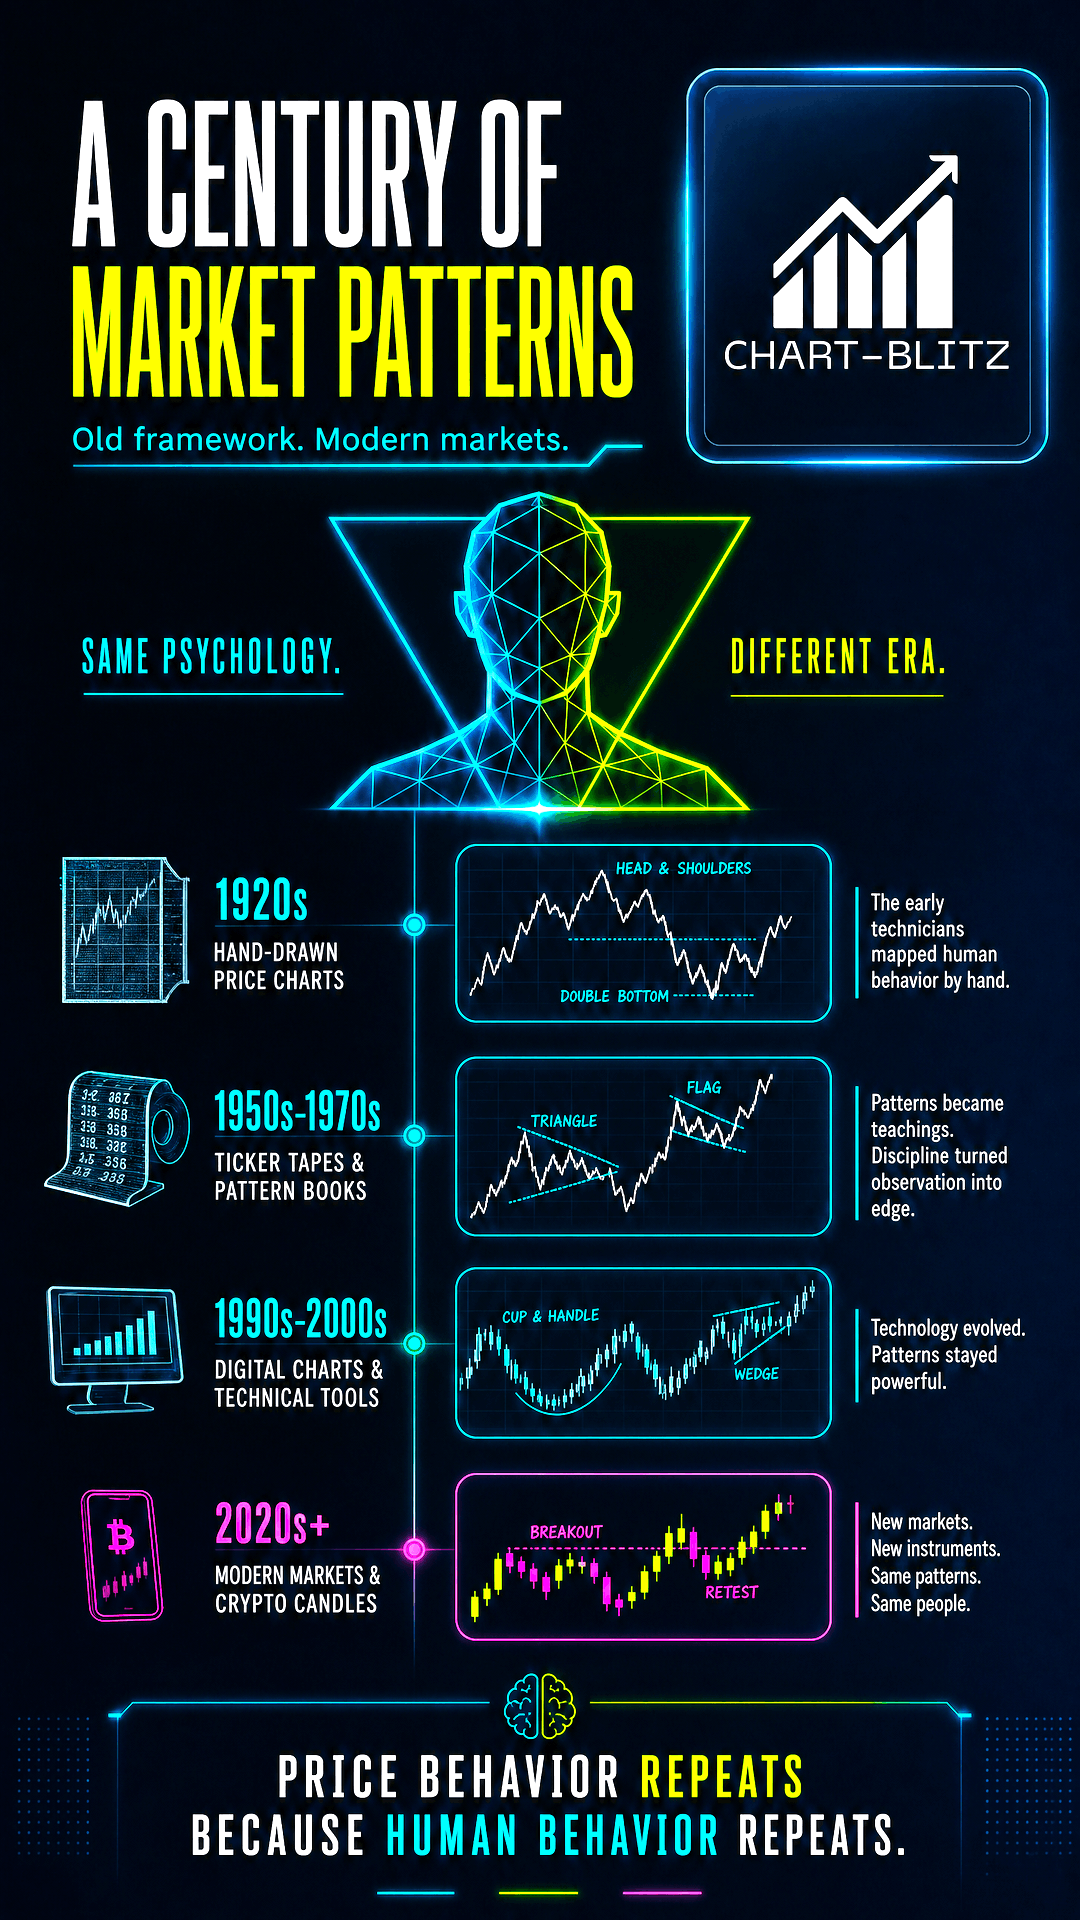
Many beginners read a chart by saying, “This looks like a head and shoulders,” or “That looks like a double bottom,” and then immediately try to predict the next move. The problem is that markets do not follow a textbook simply because a trader recognizes a shape. The practical value of chart patterns is not that they function as crystal balls. Their value is that they organize messy price behavior into a hypothesis that can be tested, invalidated, and managed.
StockCharts broadly separates price patterns into reversal and continuation patterns: reversals suggest that an existing trend may change, while continuations suggest that a trend may pause before resuming. The same geometry, however, can carry a different meaning in a different context. Fidelity’s educational material also emphasizes that patterns are fractal and may appear on weekly, daily, or shorter time frames; size alone does not determine signal quality. The more important questions are the prior trend, the time spent forming the structure, the location of the breakout, and whether price is accepted beyond the boundary.
The 26 illustrations below use a high-contrast neon-finance style. Red zones represent supply, pressure, invalidation, or bearish pathways. Green zones represent demand, confirmation, support, or bullish pathways. Magenta dashed lines normally show pattern height, a ratio, or a measured projection. Cyan target icons indicate theoretical objectives, not guaranteed prices. The first rule of reading these charts is simple: read the structure first, the breakout second, and the target last.
【📊Financial risk disclosure】
Financial risk disclosure: This article is not advice from a licensed financial adviser and is not a buy or sell instruction for any asset. Chart patterns describe conditional probabilities, not guaranteed forecasts. Cryptocurrency and leverage involve substantial risk, and readers remain responsible for their own decisions and losses.
Reversal Patterns: When the Trend Is Exhausted, Who Takes Control?
Head and Shoulders Top and Bottom: The Neckline Must Change Role
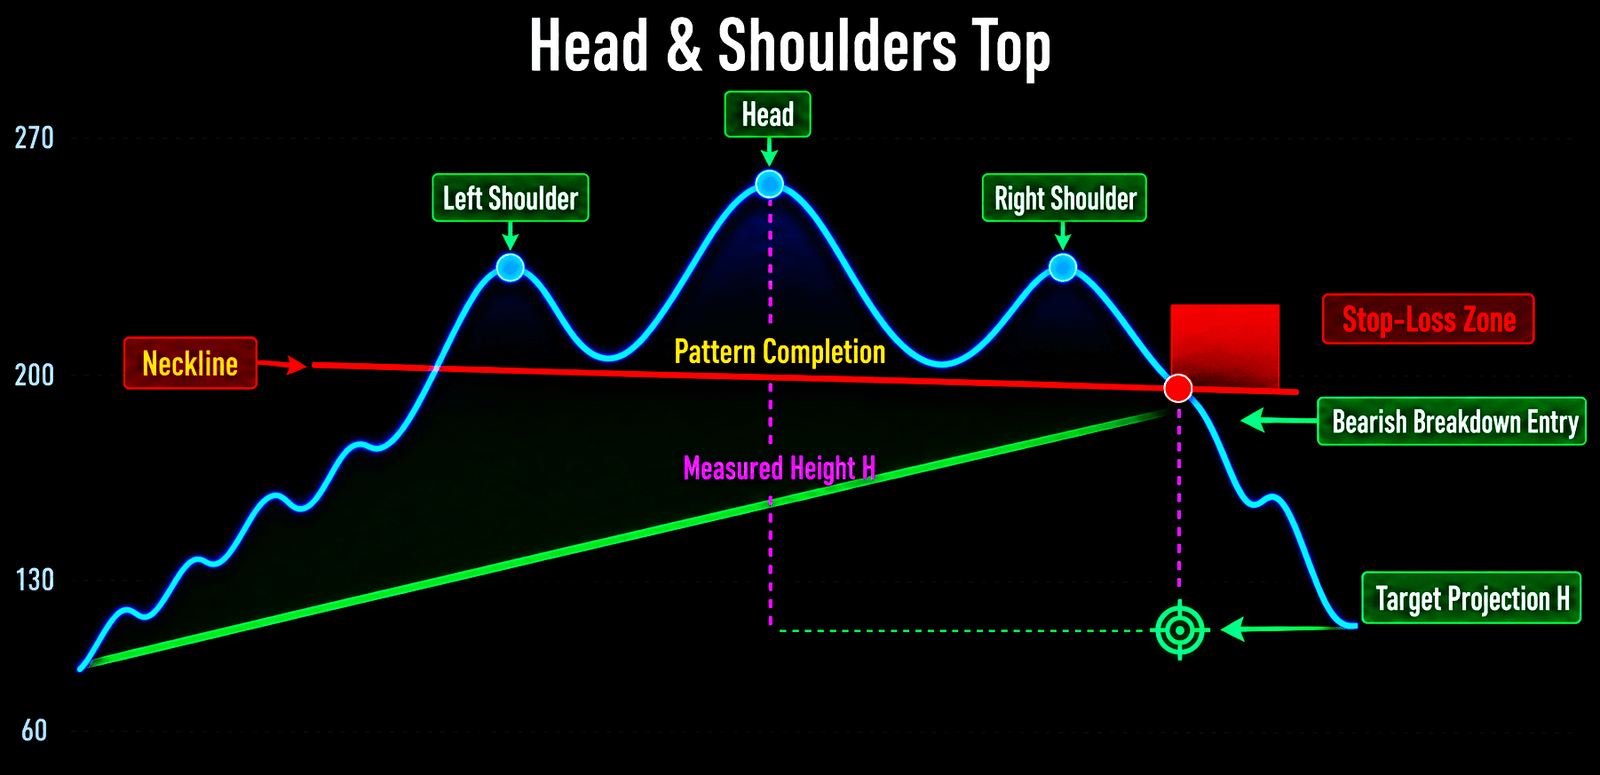
A Head and Shoulders Top normally develops after a relatively mature advance. The market forms a left shoulder, a higher head, and then a right shoulder below the head. The two reaction lows create a neckline. Until price closes decisively below that neckline, the pattern remains a possibility rather than a confirmed bearish signal. In the illustration, the red pressure zone highlights the risk after the right shoulder, while the magenta vertical measurement shows the distance from the head to the neckline before projecting that distance downward from the breakdown.
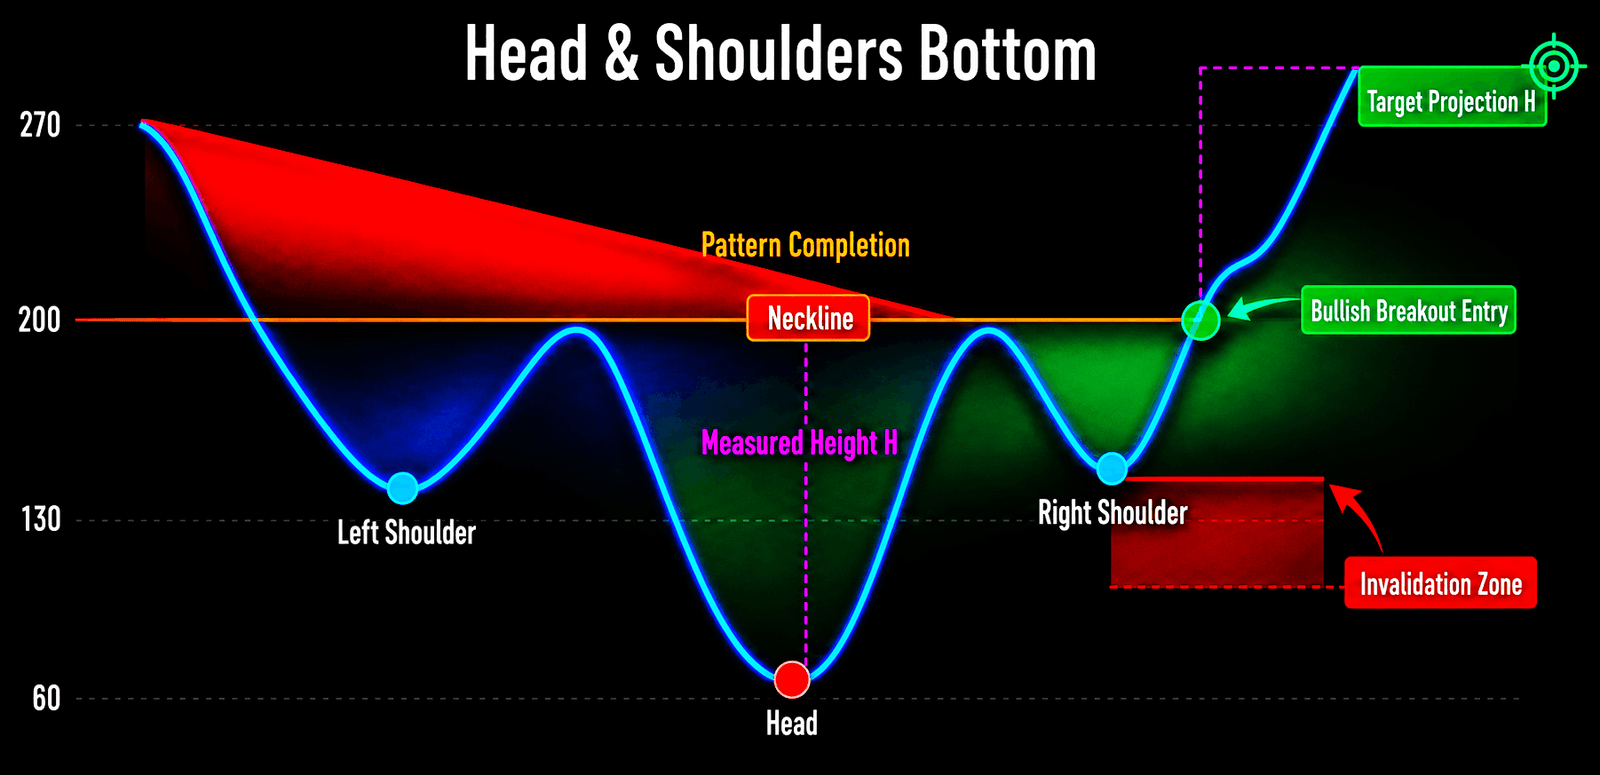
The Head and Shoulders Bottom is the inverse structure, but its name does not mean that a bottom is guaranteed. The market should first move from a downtrend into a developing base, form a left shoulder, a lower head, and a higher right shoulder, and then break above the neckline. The most informative development is often the retest: if the old resistance becomes support, the breakout has gained structural confirmation through an S/R Flip. If price quickly falls back below the neckline or breaks the right-shoulder low, the reversal thesis should be cancelled.
Double Top and Double Bottom: The Second Test Can Confirm or Trap
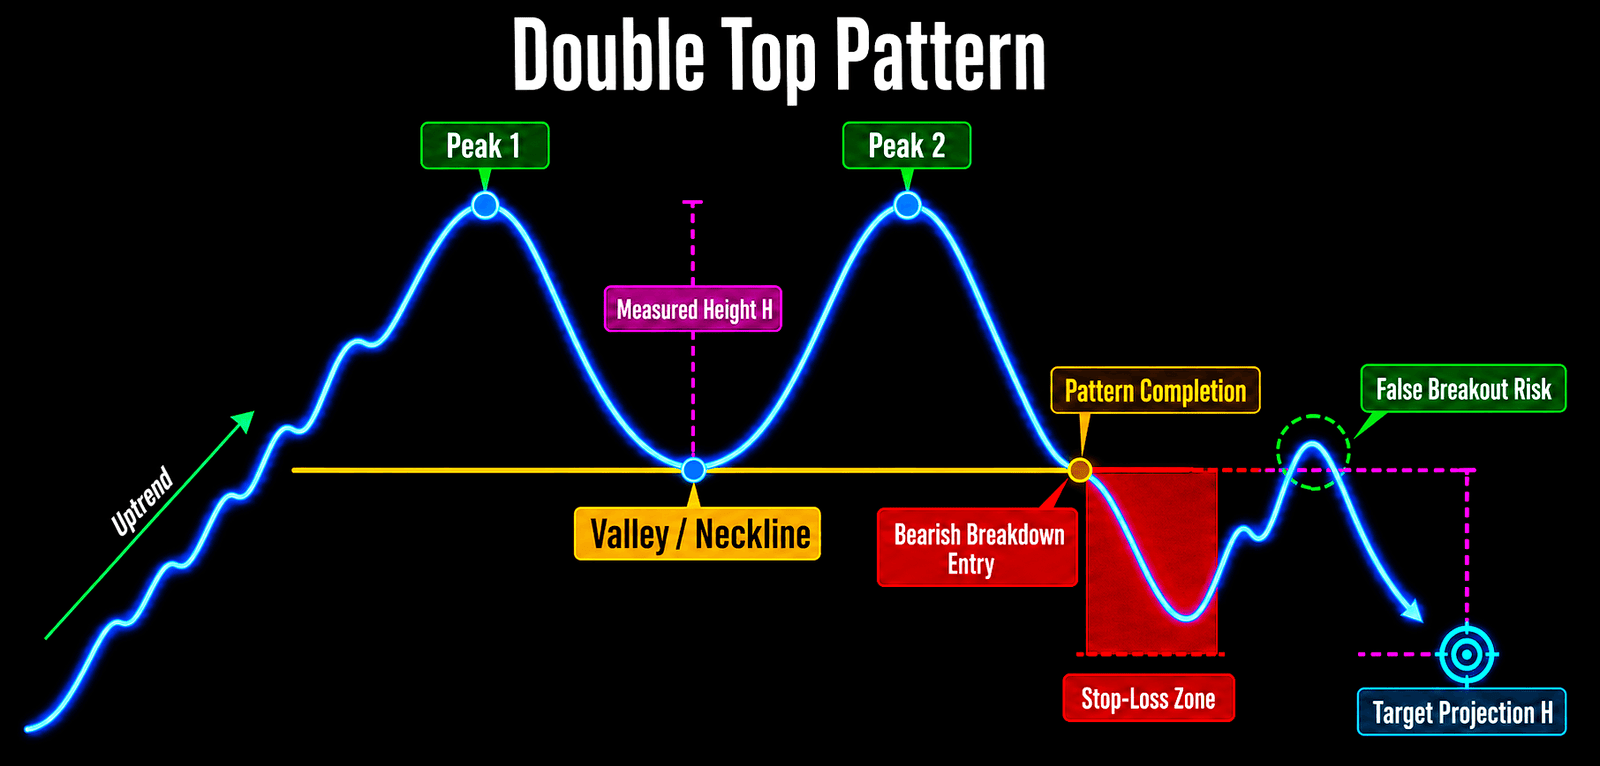
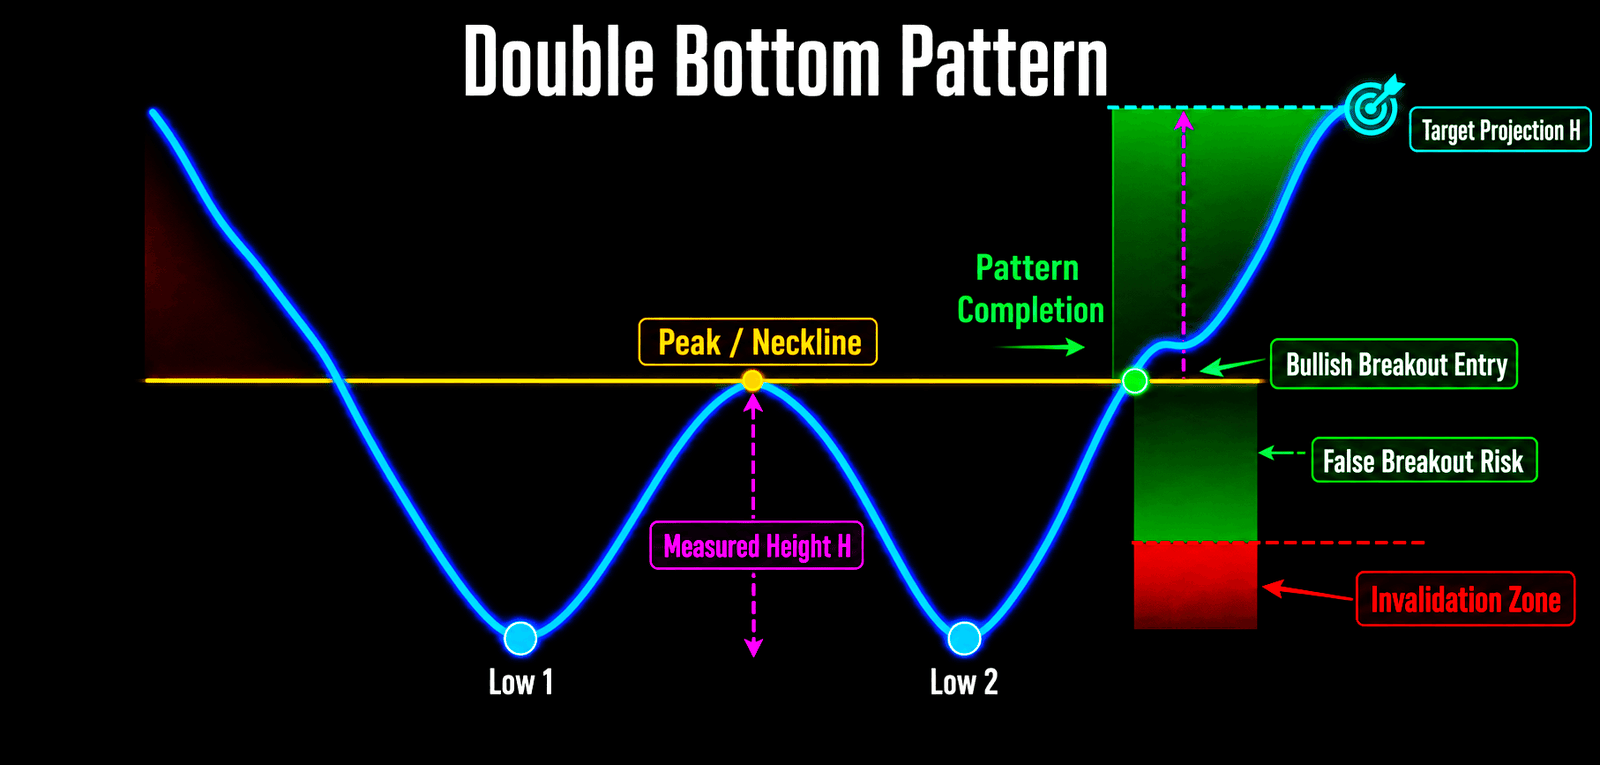
A Double Top resembles an M: a first high, a pullback, a second test of resistance, and a decline through the intervening low. A Double Bottom resembles a W: a first low, a rebound, a second test of support, and a rise through the intervening high. The diagrams separate the three essential elements: the test points, the confirmation line, and the measured height H.
The common mistake is to treat two touches of resistance as an automatic sell signal. A second test accompanied by strong closes, expanding participation, and sustained acceptance may instead show that supply is being absorbed. Conversely, a brief violation of the confirmation line followed by an immediate return into the range is a classic false-breakout risk. In crypto markets, an intrabar wick beyond a level is not enough; the closing position and the next several candles matter more than a single spike.
Triple Top: Repeated Resistance Does Not Automatically Mean Sellers Win
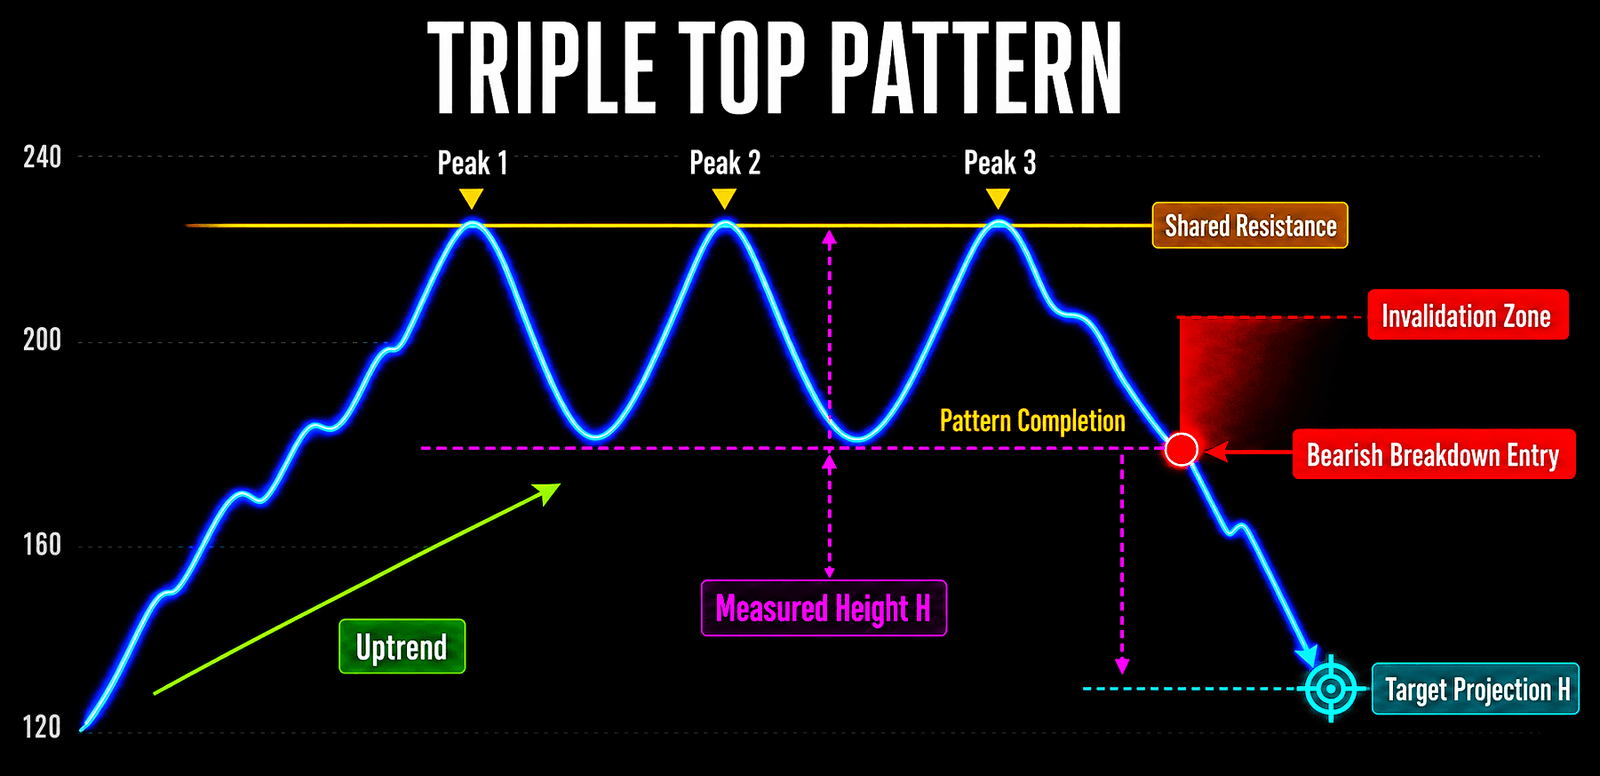
A Triple Top adds a third test of approximately the same resistance zone. The three peaks in the illustration sit beneath a shared resistance, while the reaction lows form the support that must eventually fail to confirm the bearish pattern. The third test can communicate two opposing messages. Sellers may still be powerful because every test is rejected, or sellers may be exhausting their inventory while buyers absorb supply. The actual confirmation comes from a decisive break of shared support. If the third peak breaks upward instead, the Triple Top thesis fails and the structure may become a continuation breakout.
Rounding Bottom and Diamond Top: Speed and Volatility Are the Key Information
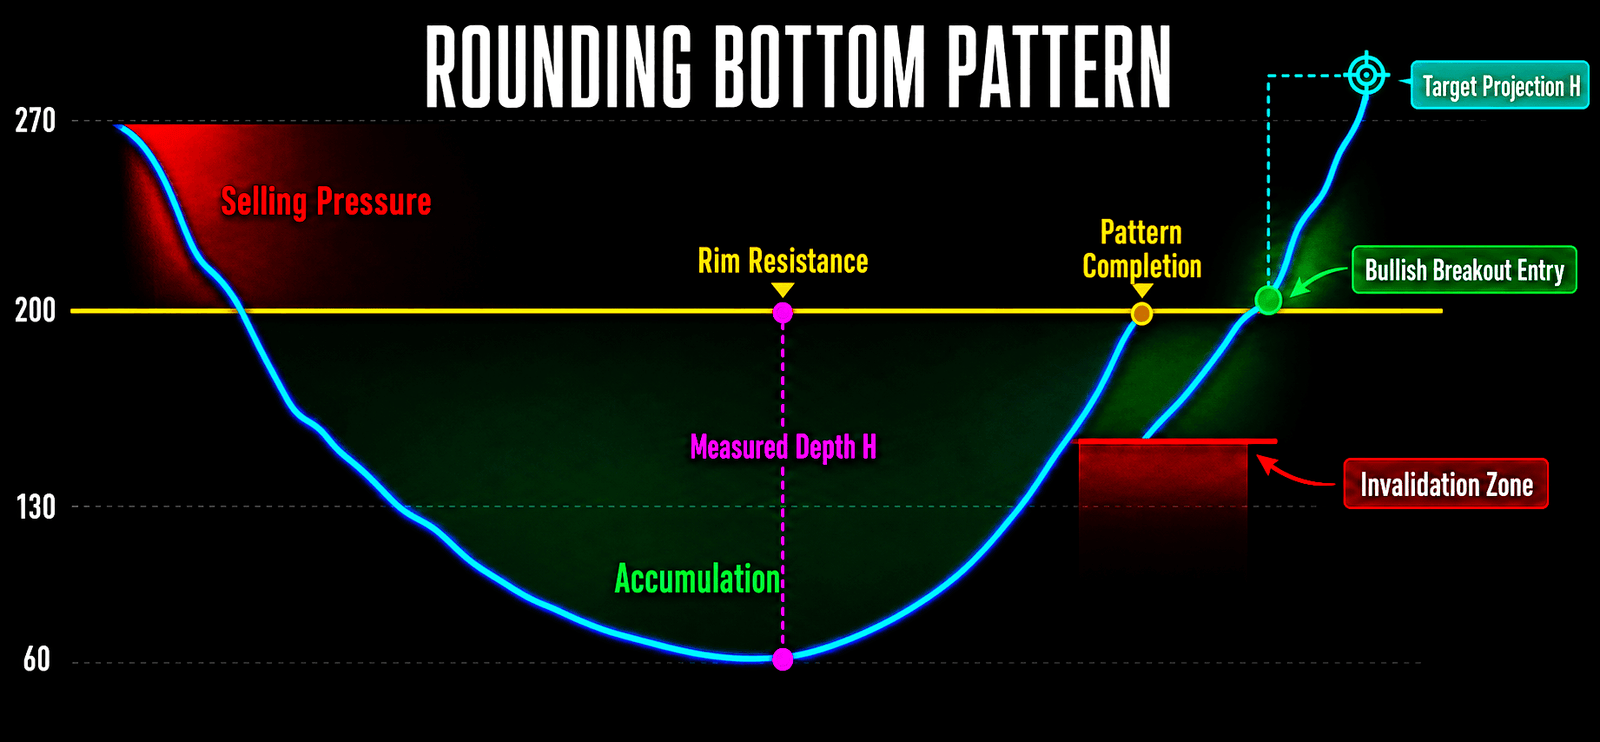
A Rounding Bottom does not require a mathematically perfect semicircle. It describes a change in slope: a sharp decline slows, price stabilizes, and the recovery gradually becomes stronger. The pattern often requires meaningful time because the market is transferring inventory slowly. Once the rim resistance breaks, the depth of the rounded base can provide a measured projection. Without follow-through, however, the move may simply be a rally inside a larger range.
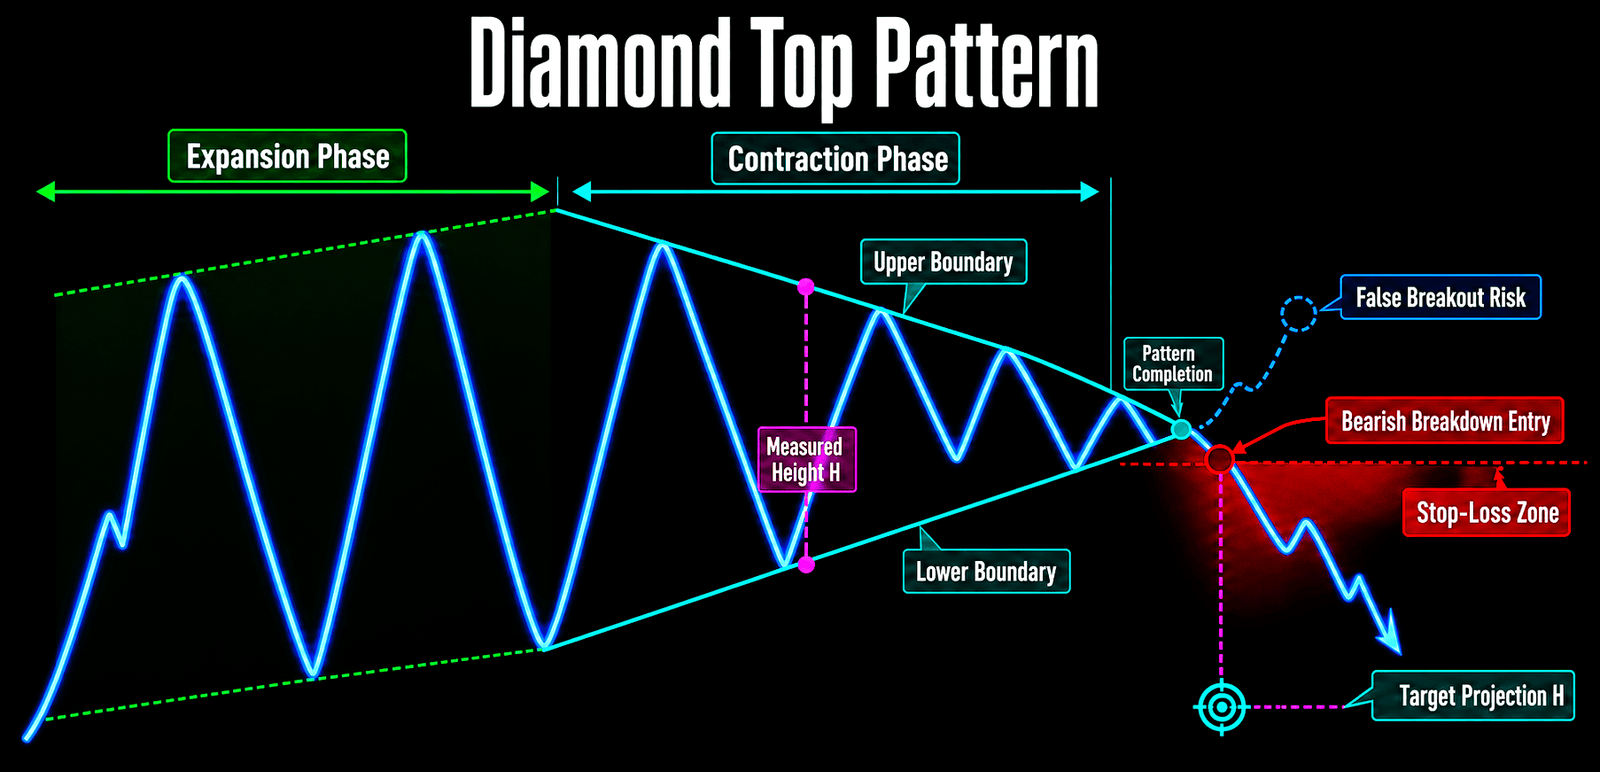
A Diamond Top combines an expansion phase with a contraction phase. It represents a market whose disagreement first becomes wider and then compresses again. The important question is not whether the outline looks like a diamond; it is which boundary on the right side is accepted or rejected. Marking a diamond too early is usually hindsight disguised as analysis. Before the structure is complete, it is more honest to call it an expansion-to-contraction zone.
Broadening Top: When Confidence Expands, Risk May Be Expanding Too
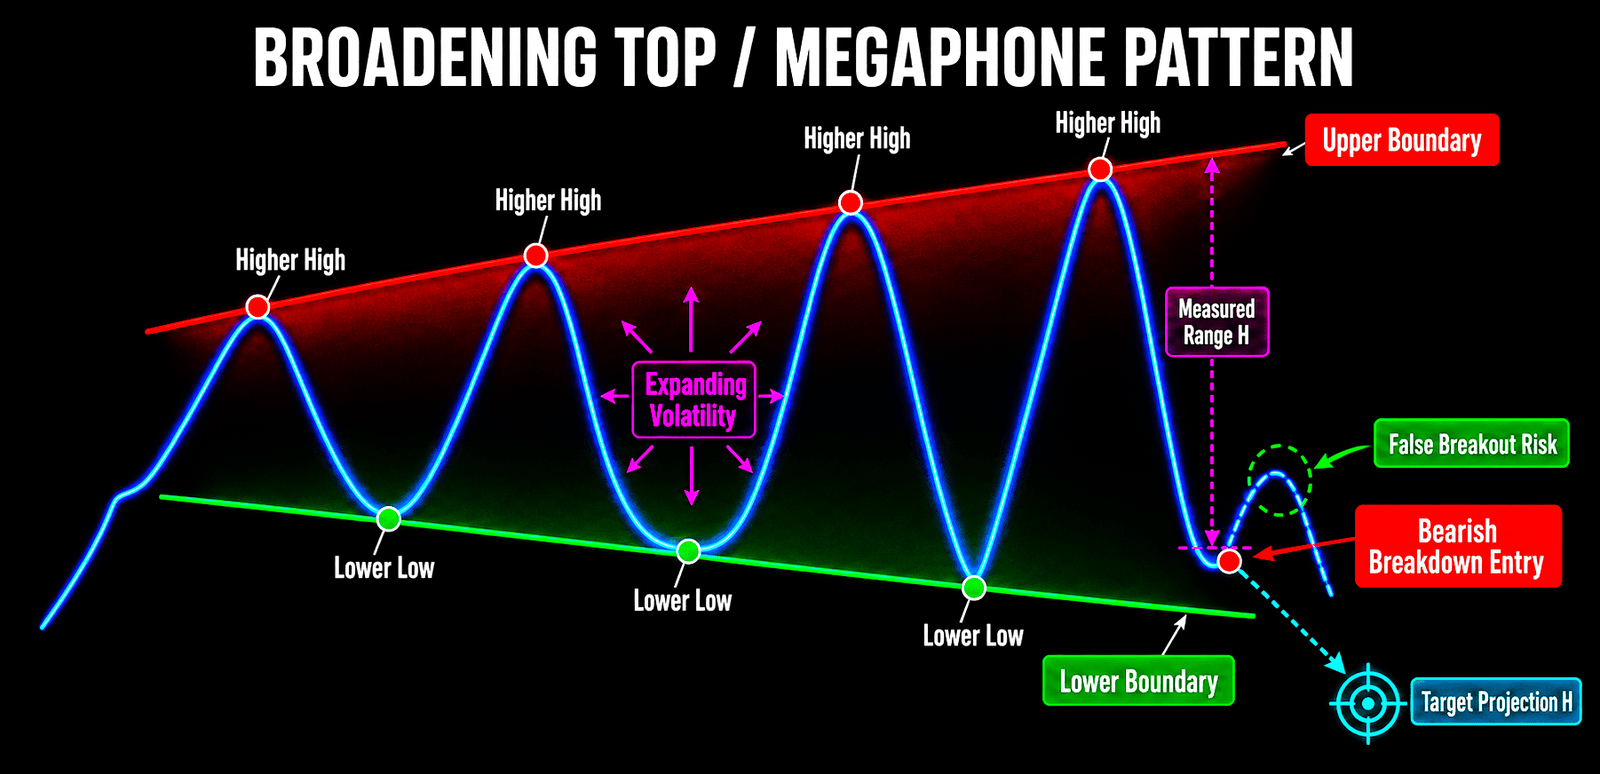
A Broadening Top, or Megaphone, produces higher highs and lower lows, with volatility expanding outward. It reflects increasing disagreement: bulls chase higher prices while bears distribute into strength. Both sides become more aggressive. The red and green boundaries in the illustration diverge, making clear that this is the opposite geometry of a contracting triangle.
A broadening structure can generate several false breakouts before a real directional move. Chasing a single intrabar violation is therefore dangerous. A bearish interpretation becomes more coherent when the lower boundary is broken on a close and a subsequent rally fails beneath the former support. The range projection remains a reference only, because the structure itself is associated with large volatility, wider stops, and greater slippage.
Continuation and Consolidation: Is the Pause Building Energy or Signaling a Reversal?
Triangles: Compression Has No Direction Until the Breakout
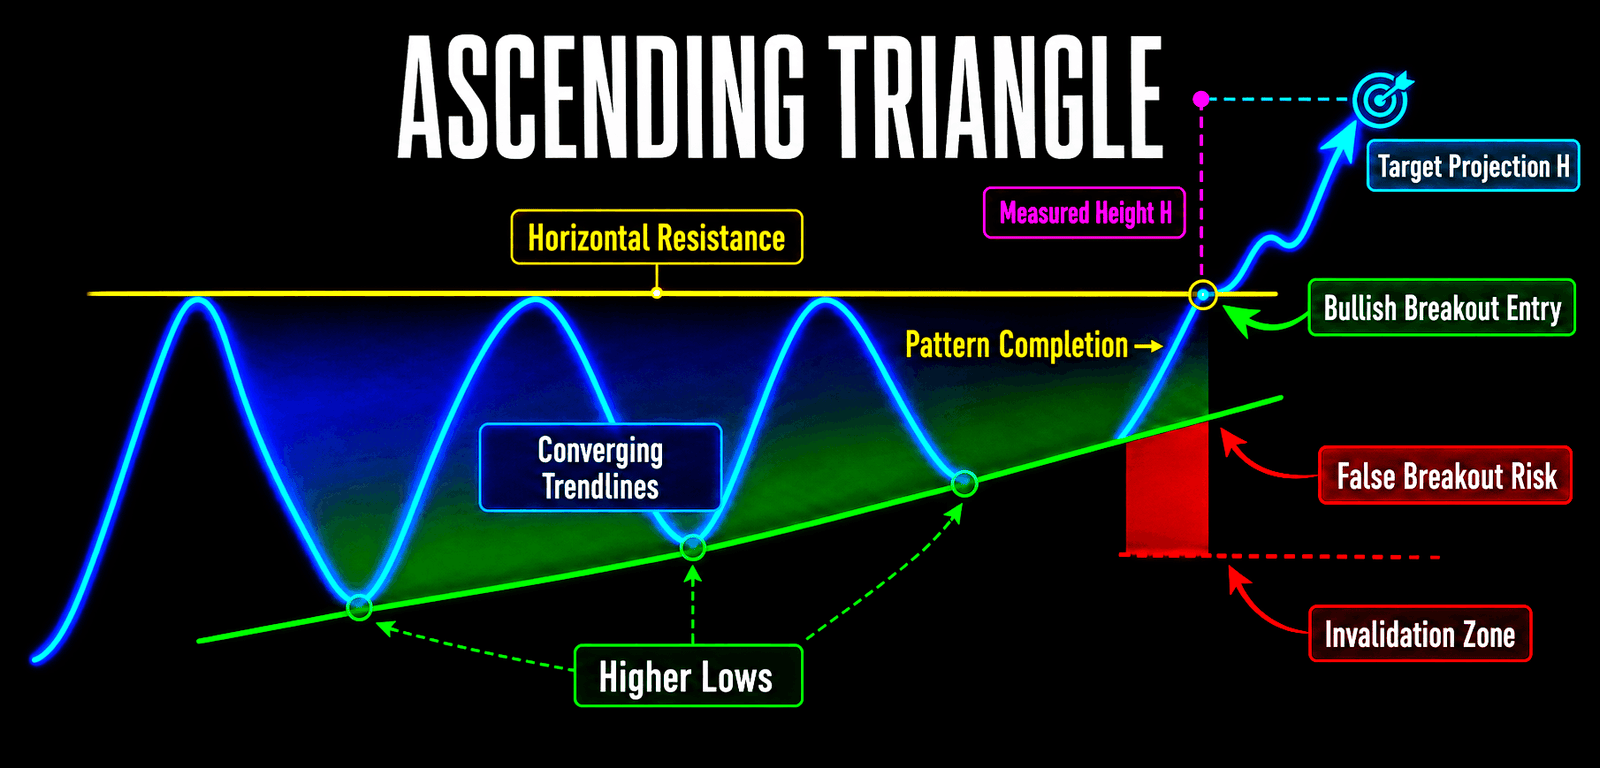
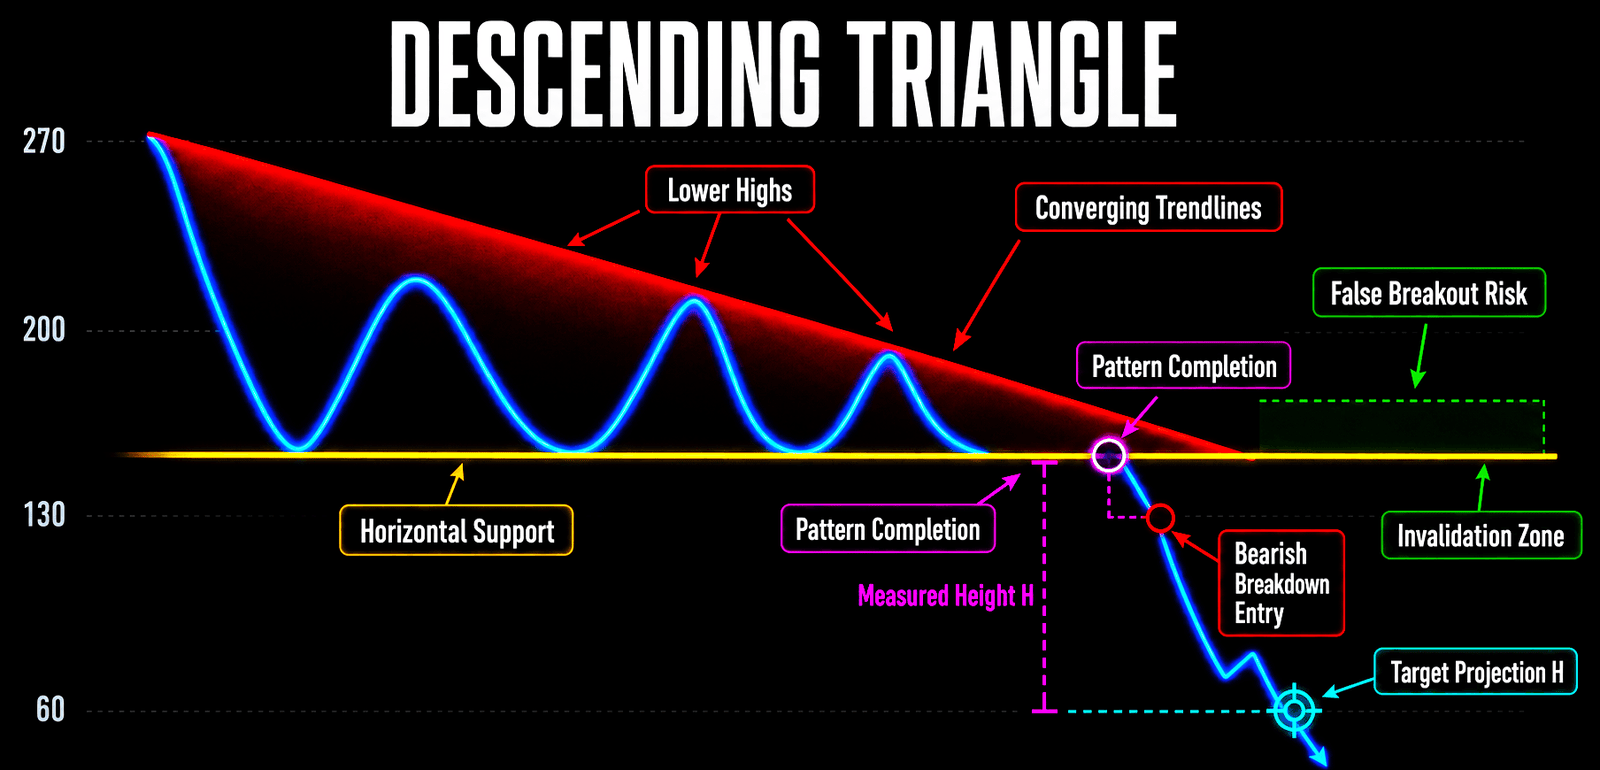
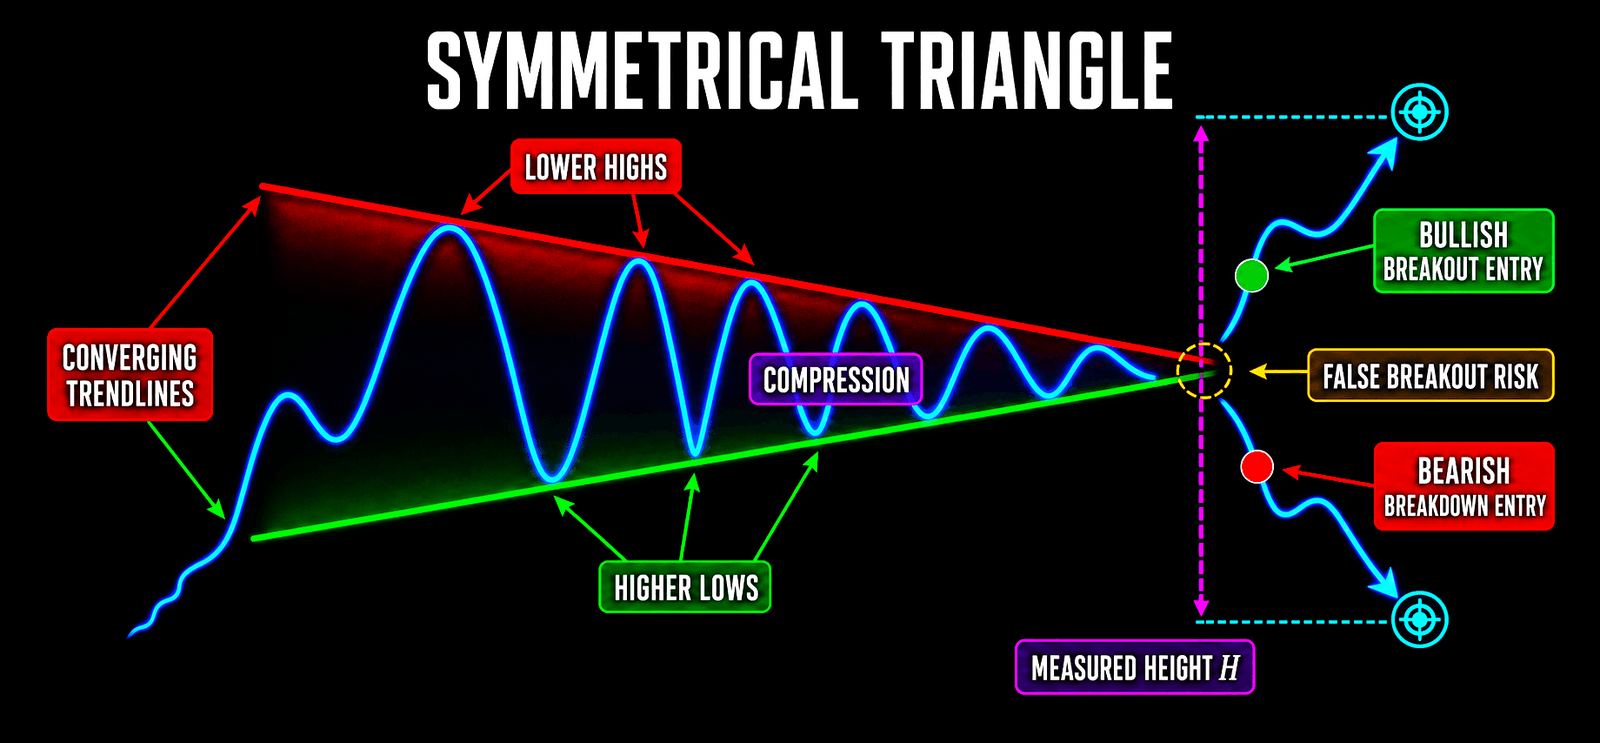
An Ascending Triangle has relatively flat resistance and progressively higher lows, showing that buyers are willing to defend the market at increasingly higher prices. A Descending Triangle has relatively flat support and progressively lower highs, showing that sellers are willing to supply at increasingly lower prices. A Symmetrical Triangle has both higher lows and lower highs. It is a two-sided compression and should not be assigned a direction merely because the shape resembles a triangle.
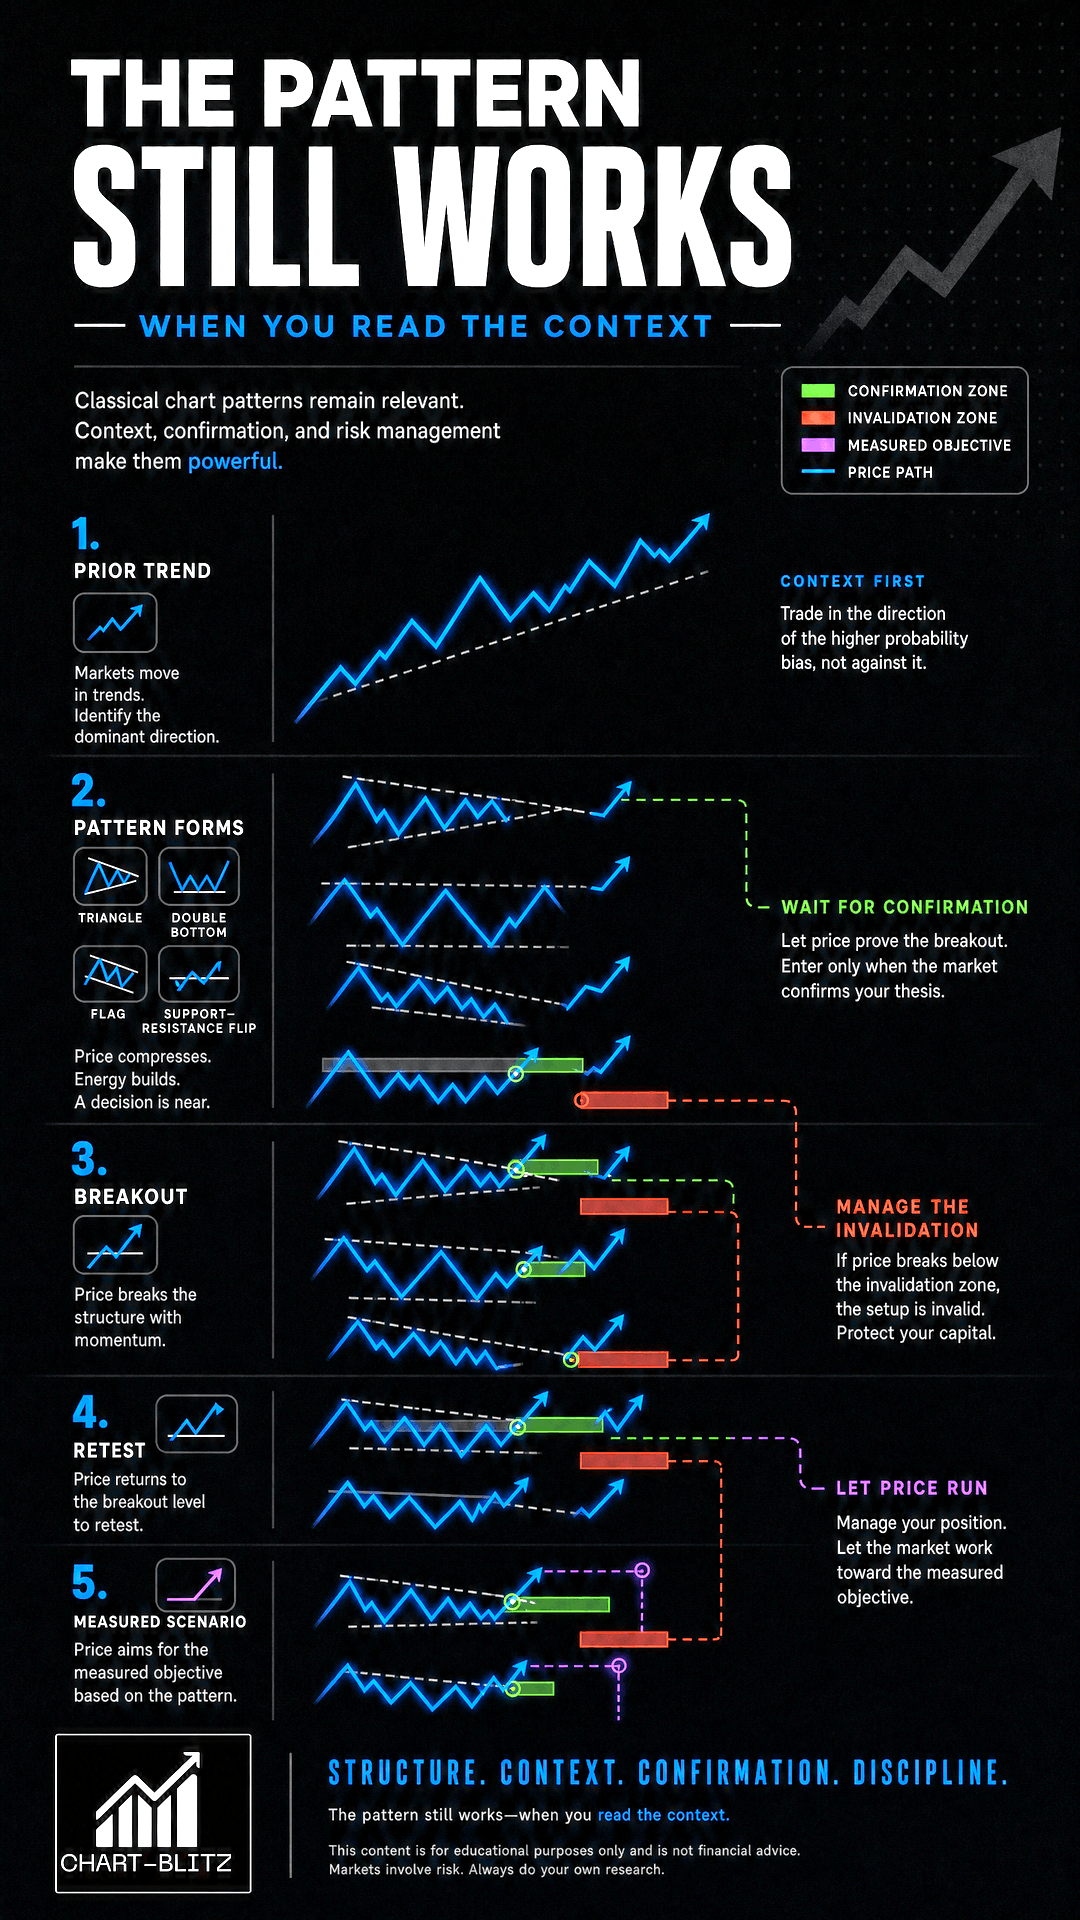
The decisive moment in a triangle is the breakout and the market’s acceptance afterward. If price closes above resistance, remains above it, and successfully retests it as support, the continuation thesis becomes stronger. If the breakout is only a wick and price falls back inside the triangle, the false-breakout warning is more important than the theoretical target. A triangle that reaches its apex without resolving often loses predictive value; the market may extend the range or redraw the boundaries.
Flags and Pennants: Without a Flagpole, Do Not Force the Label
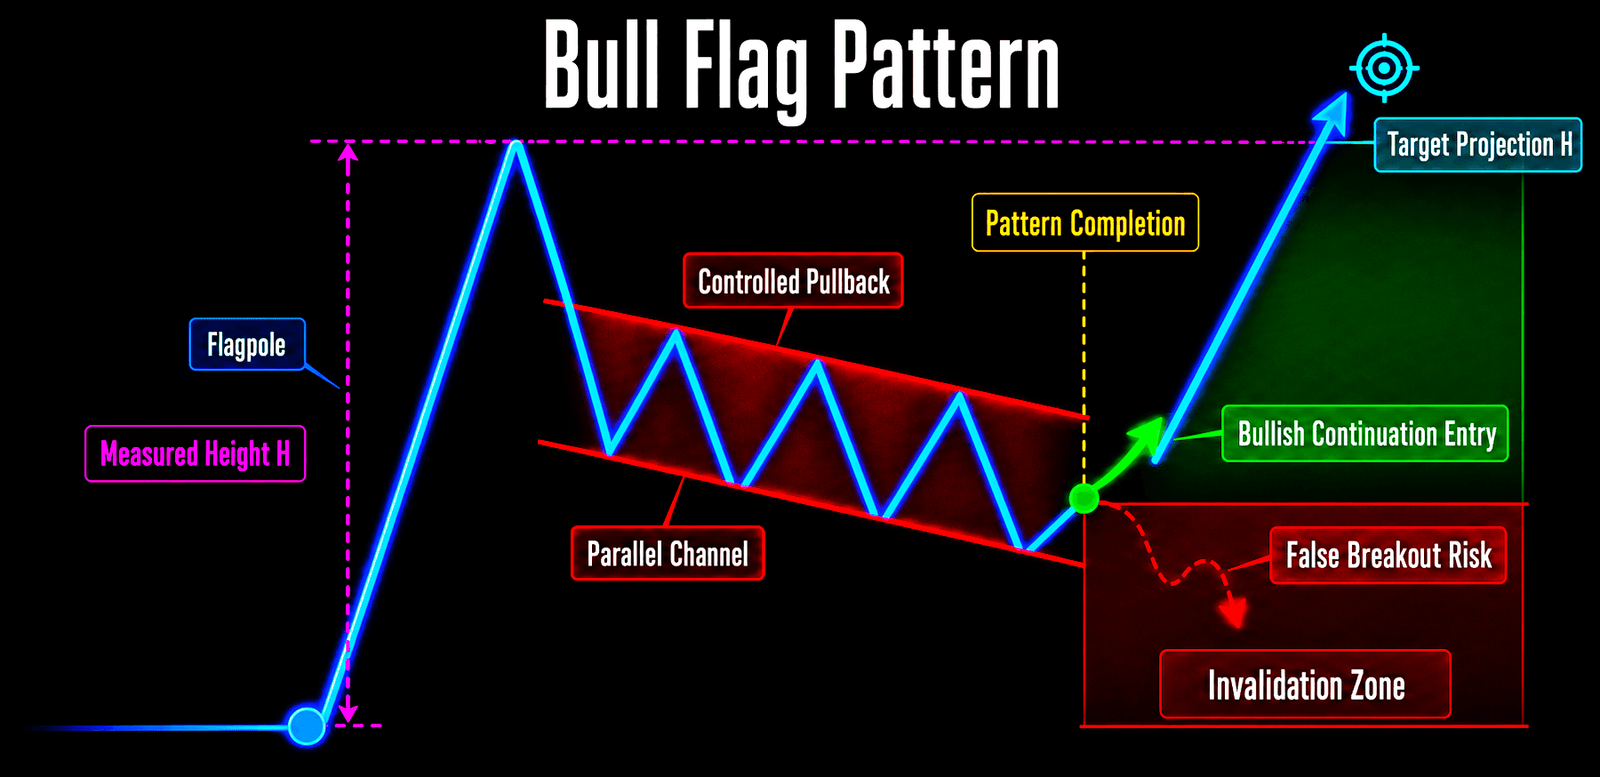
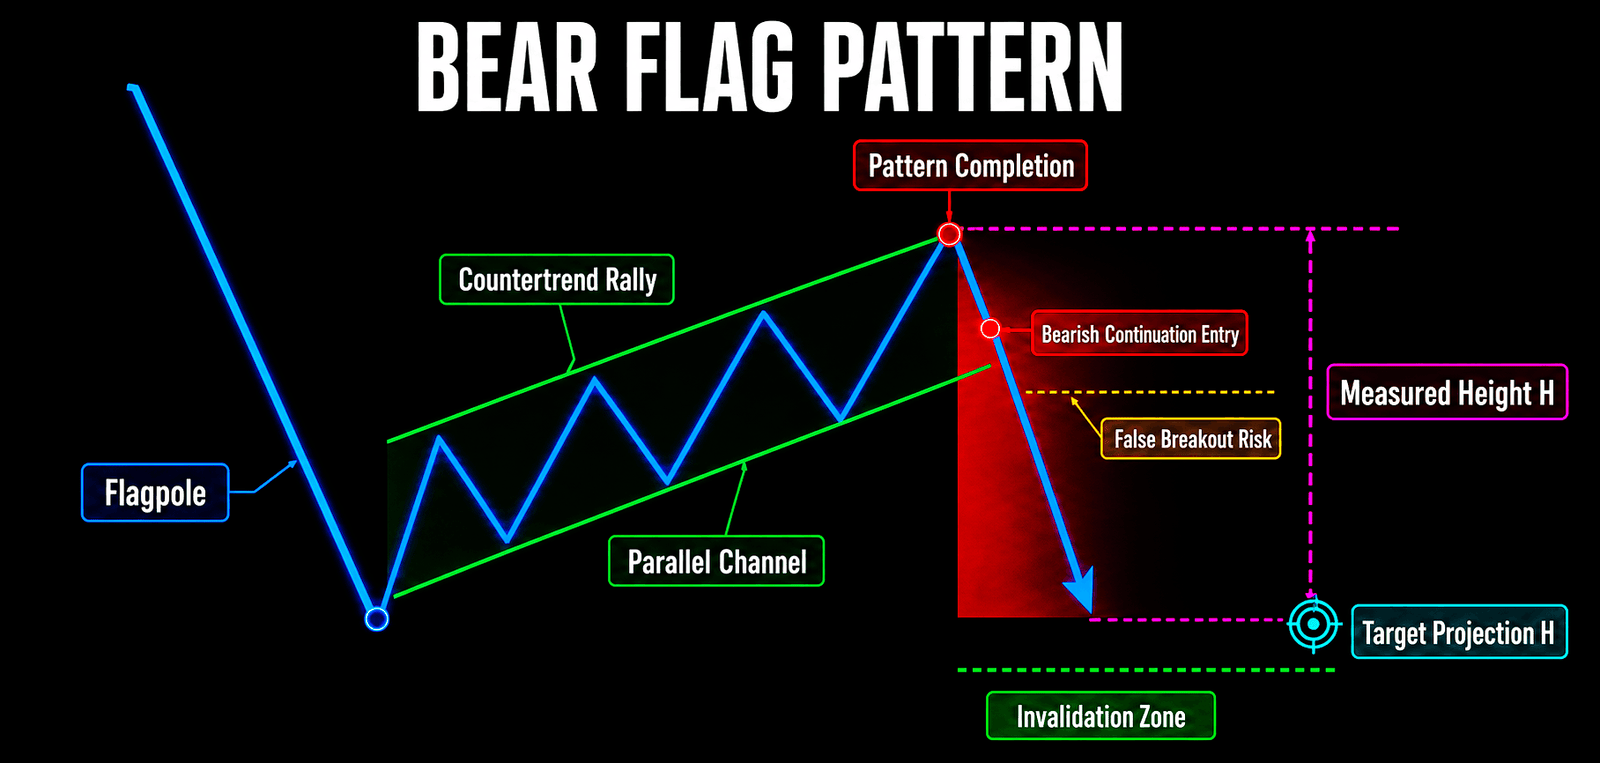
A Bull Flag begins with a steep upward flagpole and then forms a short, mildly downward-sloping parallel channel. A Bear Flag begins with a sharp decline and then develops a short countertrend rally inside a parallel channel. The consolidation digests profits and exchanges inventory. The flagpole can be used as a theoretical measured move, but only if the eventual breakout follows the original impulse direction.
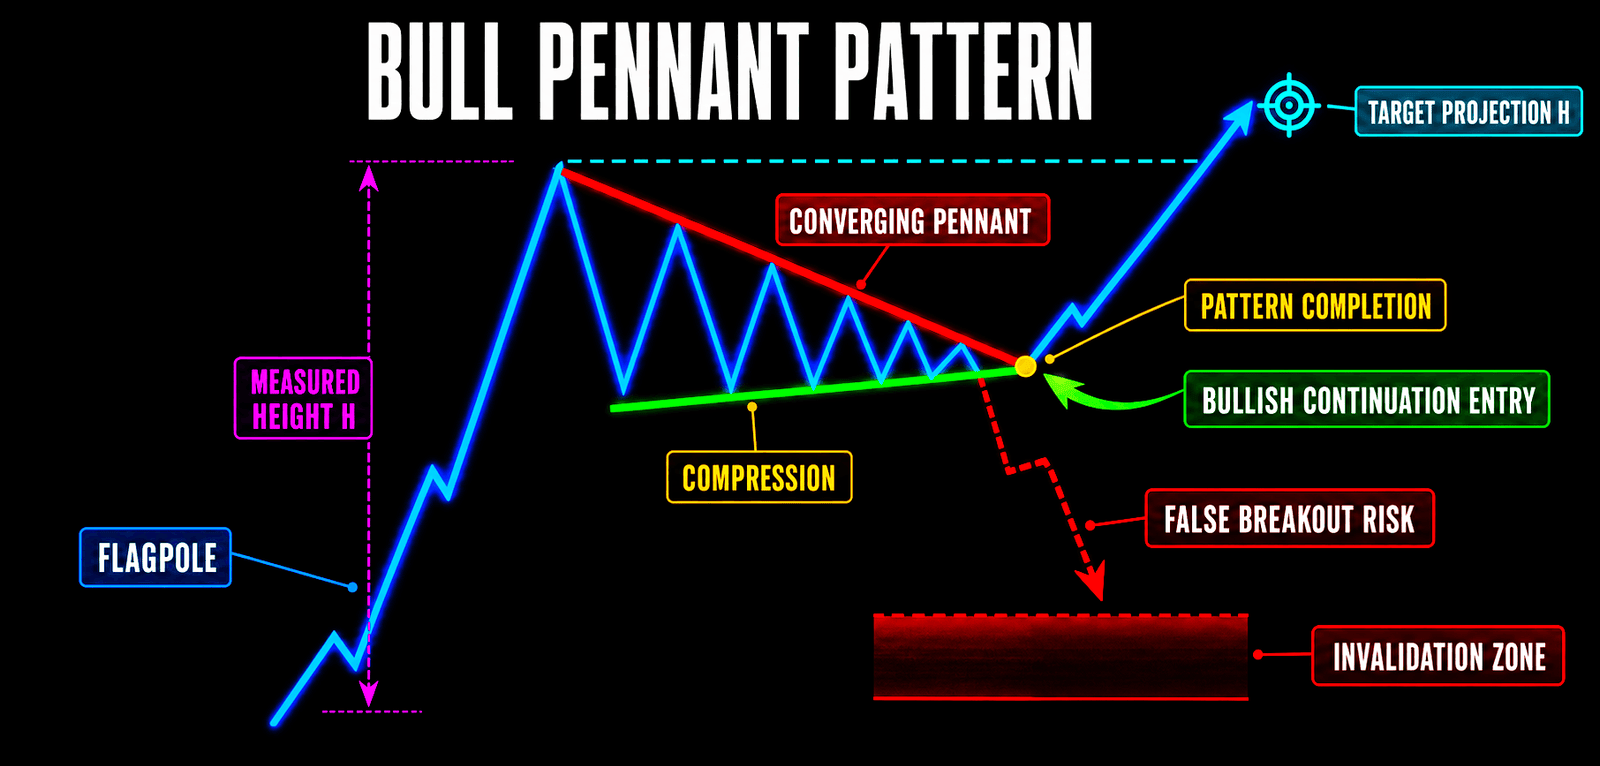
A Pennant resembles a small contracting triangle after an impulse. It is usually shorter and tighter than a standard Symmetrical Triangle, and the preceding flagpole is an essential part of the interpretation. If there is no clear pole, the consolidation lasts too long, or the pullback destroys the prior momentum, the label should be downgraded. Professional analysis separates the impulse, the pause, and the resolution rather than naming the last few swings in isolation.
Falling Wedge, Rectangle, and Cup and Handle: Similar Pauses, Different Information
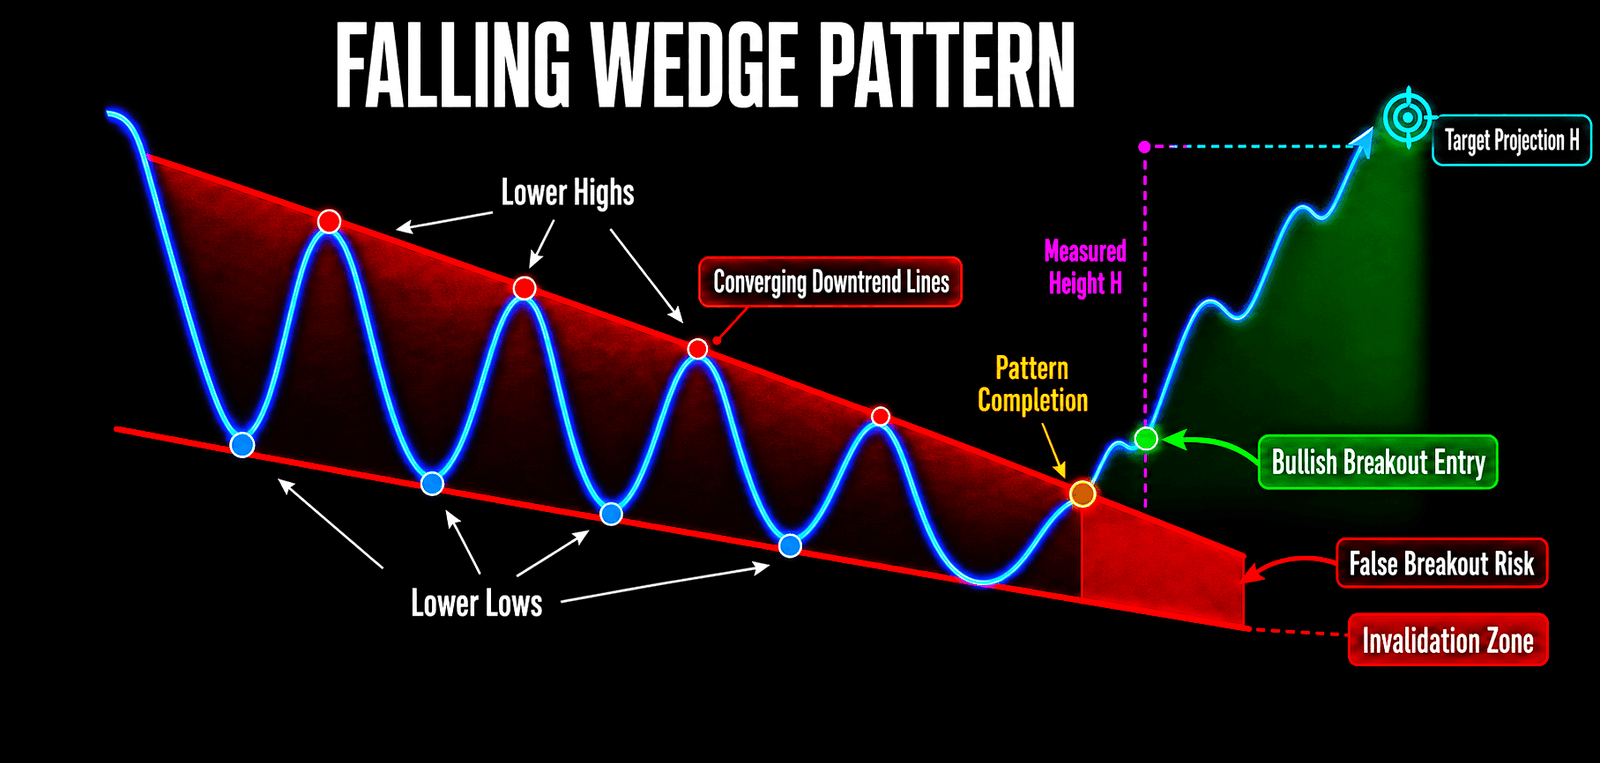
A Falling Wedge has two boundaries that slope downward but converge. It may act as a bullish continuation pattern inside a downtrend correction, or as a reversal structure after a prolonged decline. The red converging zone shows that sellers still control the short-term slope; the green breakout pathway shows that buyers must first overcome the upper boundary. A Rising Wedge is the geometric mirror image, but in either case the prior trend and the actual breakout direction remain essential.
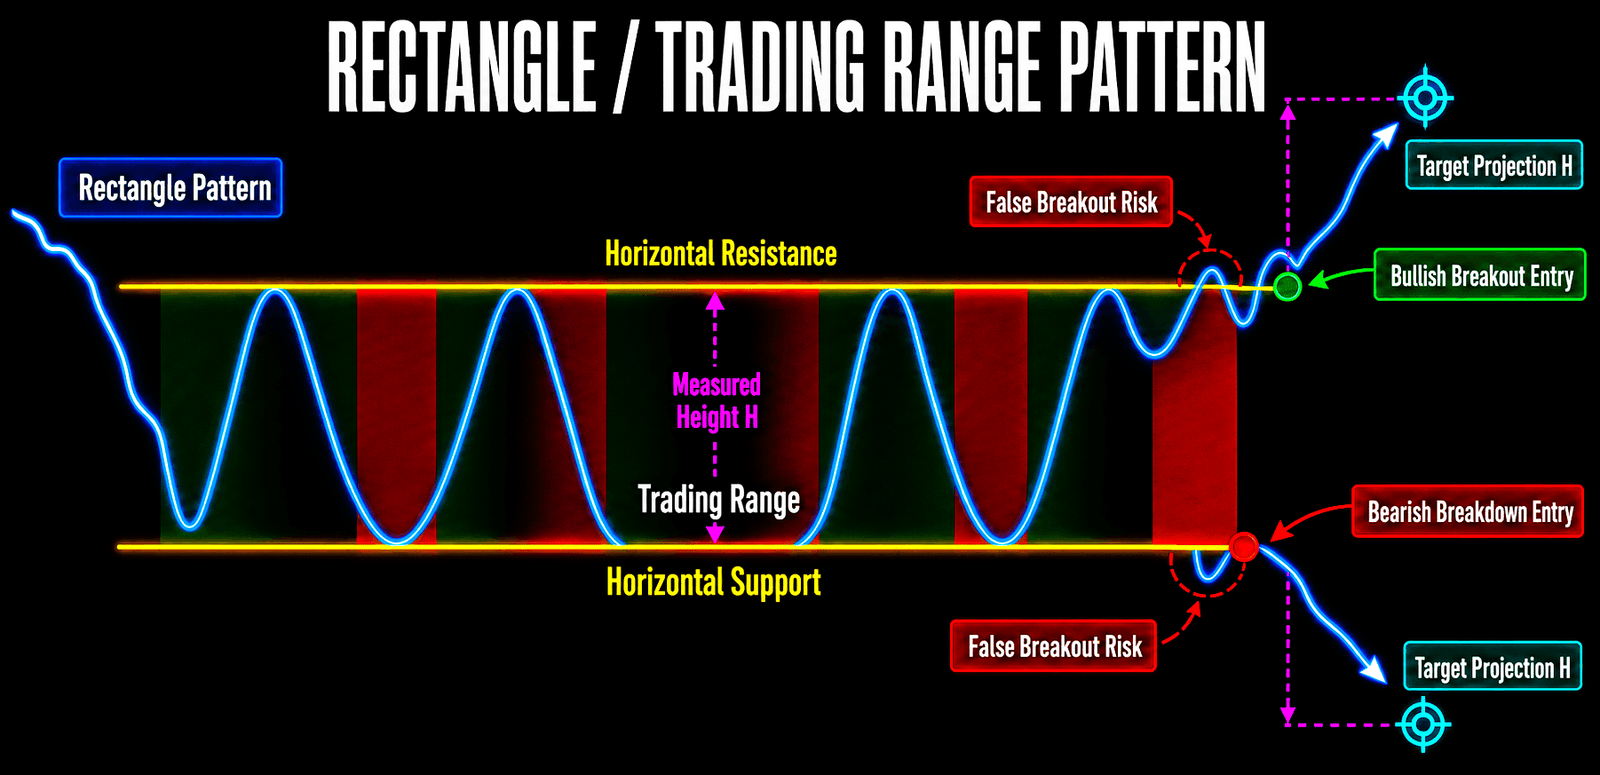
A Rectangle or Trading Range shows price exchanging between horizontal support and resistance. Inside the rectangle, supply and demand are temporarily balanced; outside it, the market may reveal a new imbalance. The illustration includes both bullish and bearish projections because either boundary can fail. A touch near the edge is not the same as a confirmed trend.
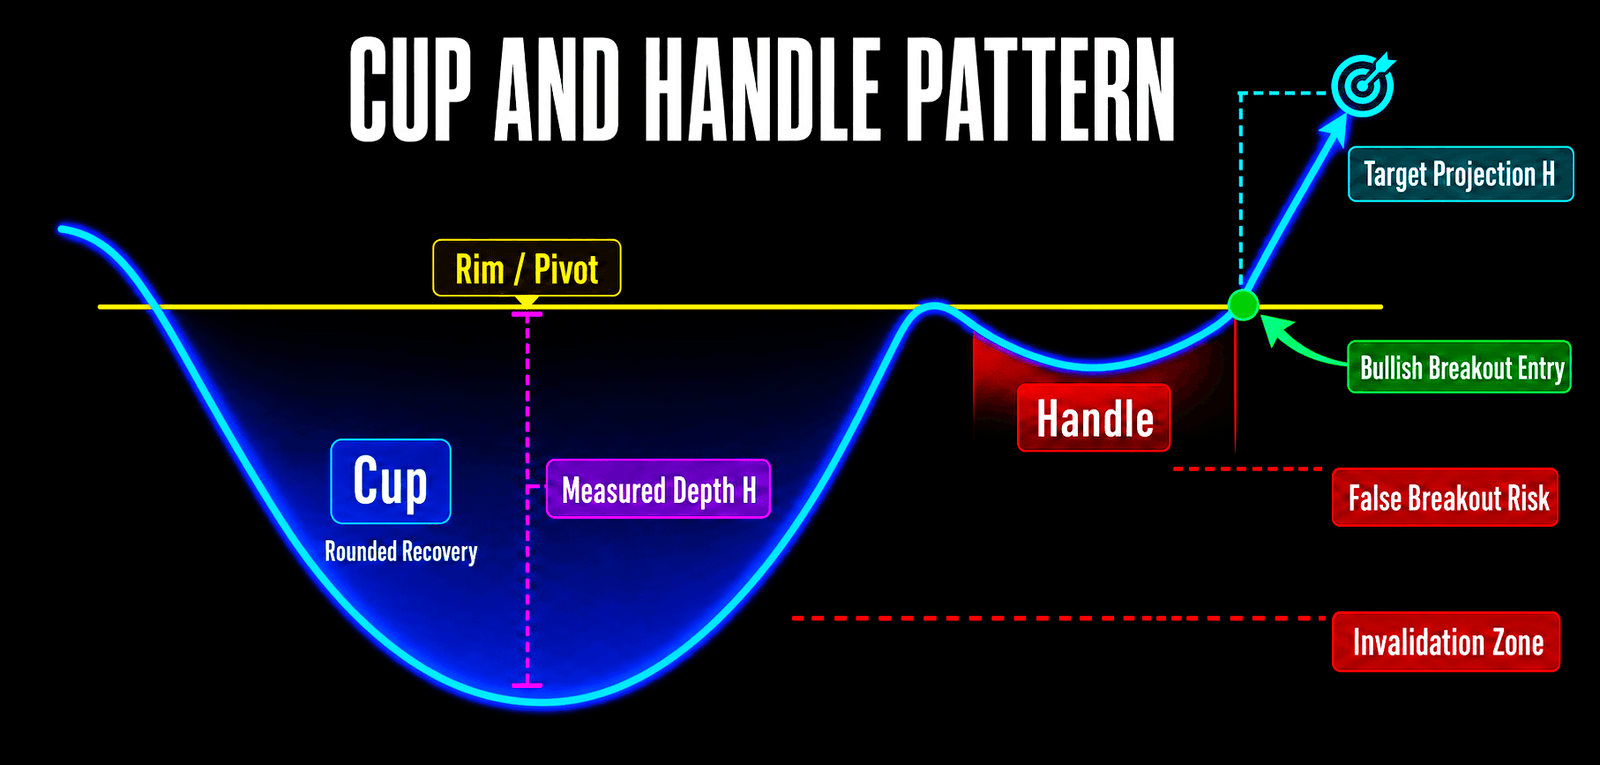
A Cup and Handle combines a rounded recovery with a shallow pullback near the rim. The rim resistance is the pivot. If the handle becomes too deep or breaks an important part of the cup, the continuation thesis weakens. The pattern is related to a rounded base, but the additional handle and pivot create a distinct confirmation structure. Not every U-shaped price move deserves the label Cup and Handle.
Candlesticks: Short-Term Emotion, Not an Independent Forecasting System
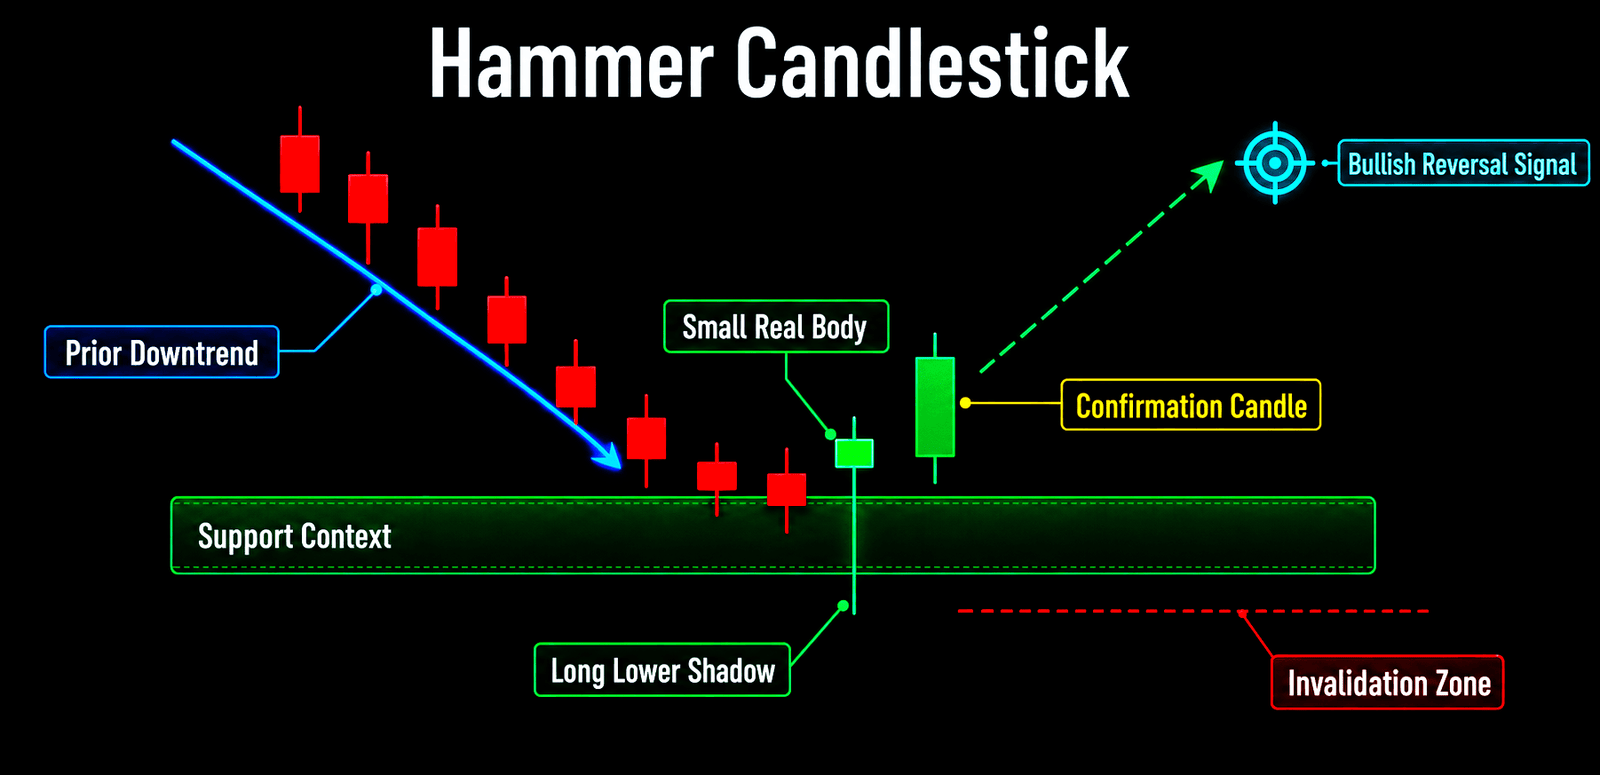
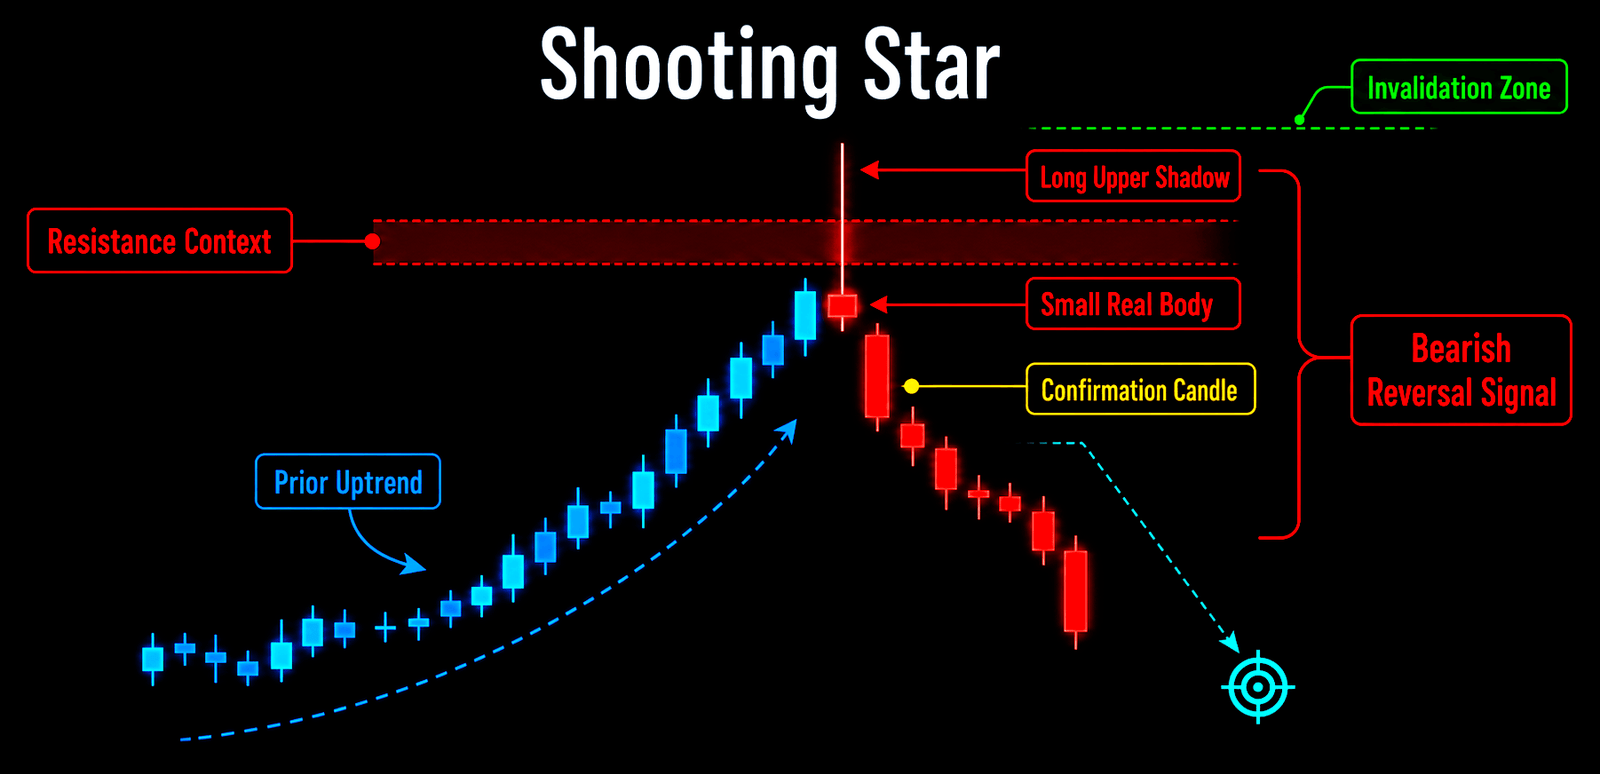
StockCharts makes a foundational point about bullish reversal candles: a prior downtrend must exist for a reversal to have something to reverse.3 The same logic applies to bearish candles: they carry more meaning after an advance or near a meaningful resistance area, and they are stronger when the next candle confirms the rejection.
A Hammer has a small real body, a long lower shadow, and often appears after a decline. It shows that sellers pushed price down but buyers recovered much of the move before the close. A Shooting Star is the mirror-like high rejection after an advance, with a small body and a long upper shadow. Neither pattern is an automatic trade instruction. The support and resistance context and the invalidation zones in the illustrations are deliberately prominent because location matters more than the name.
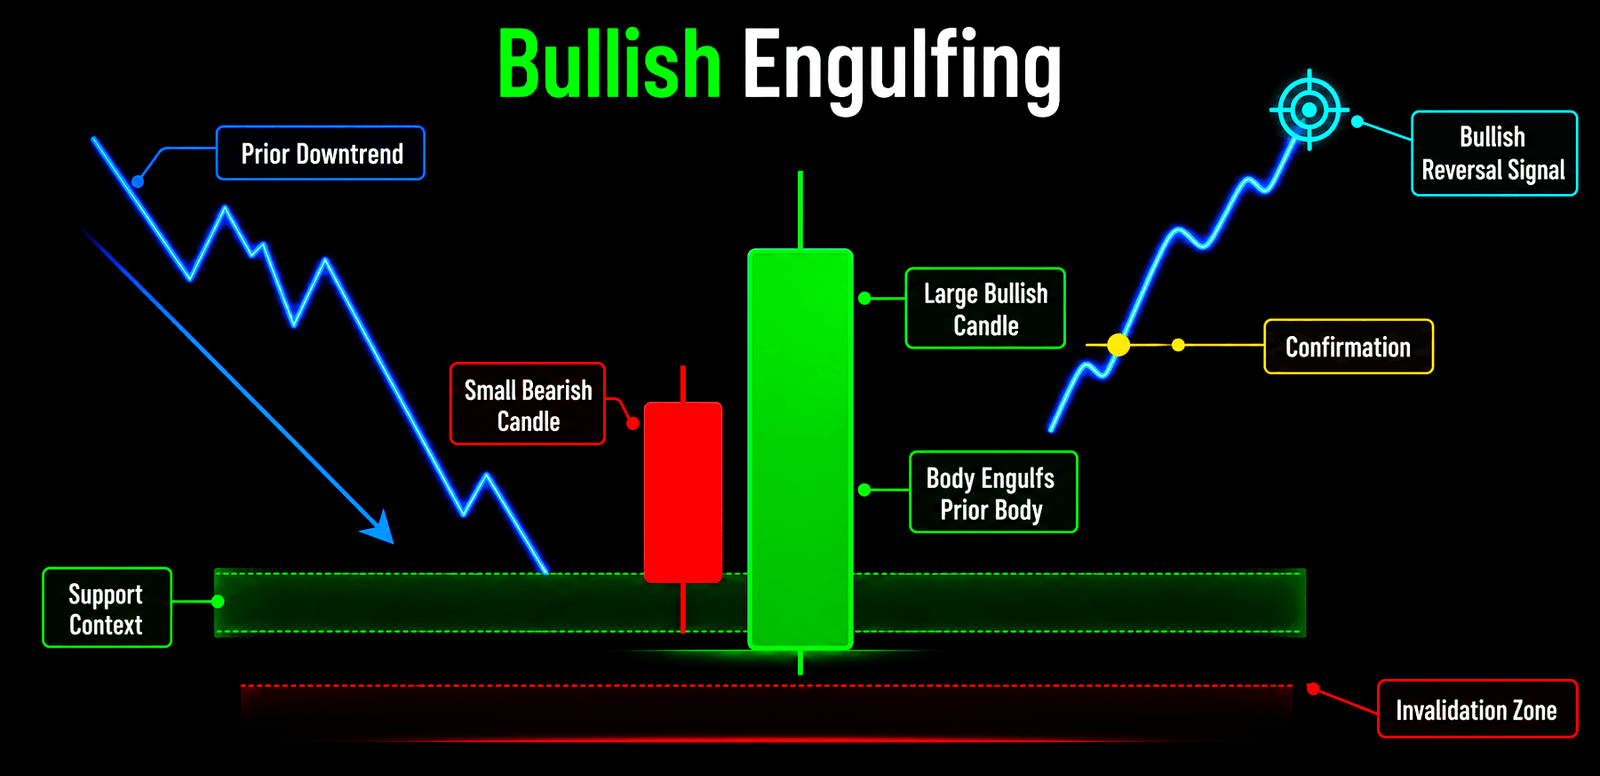
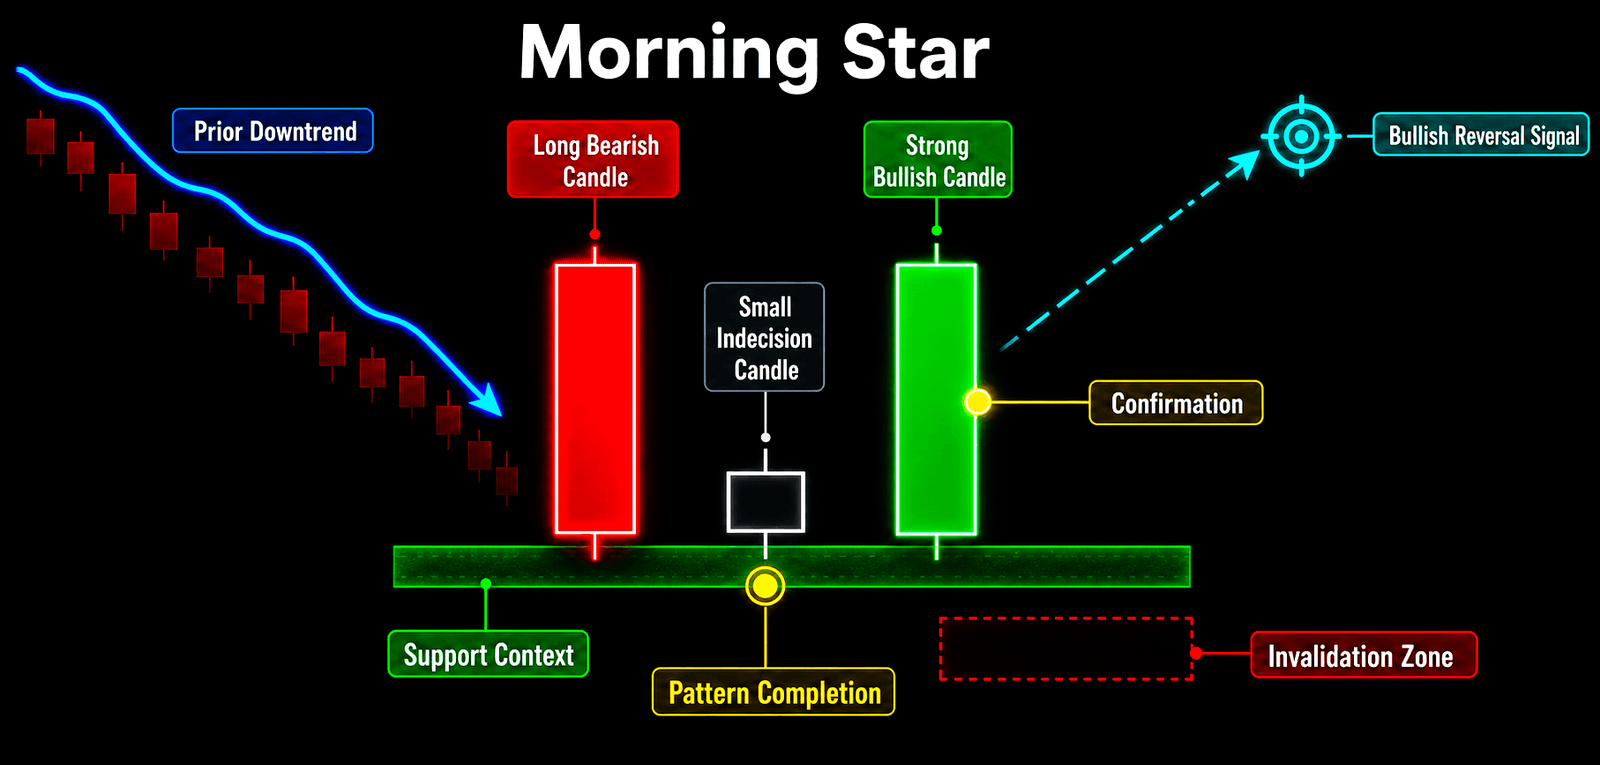
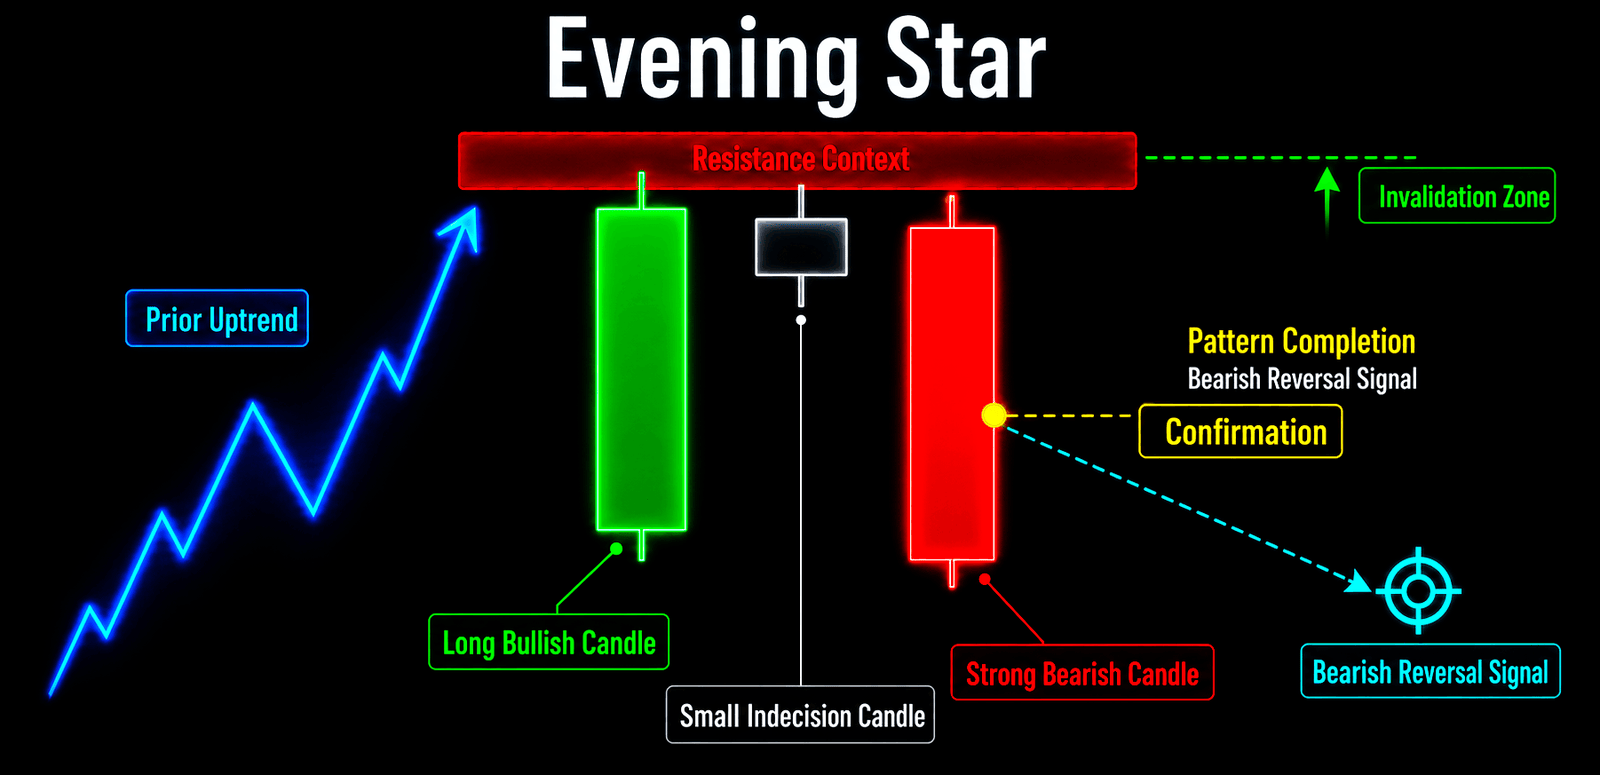
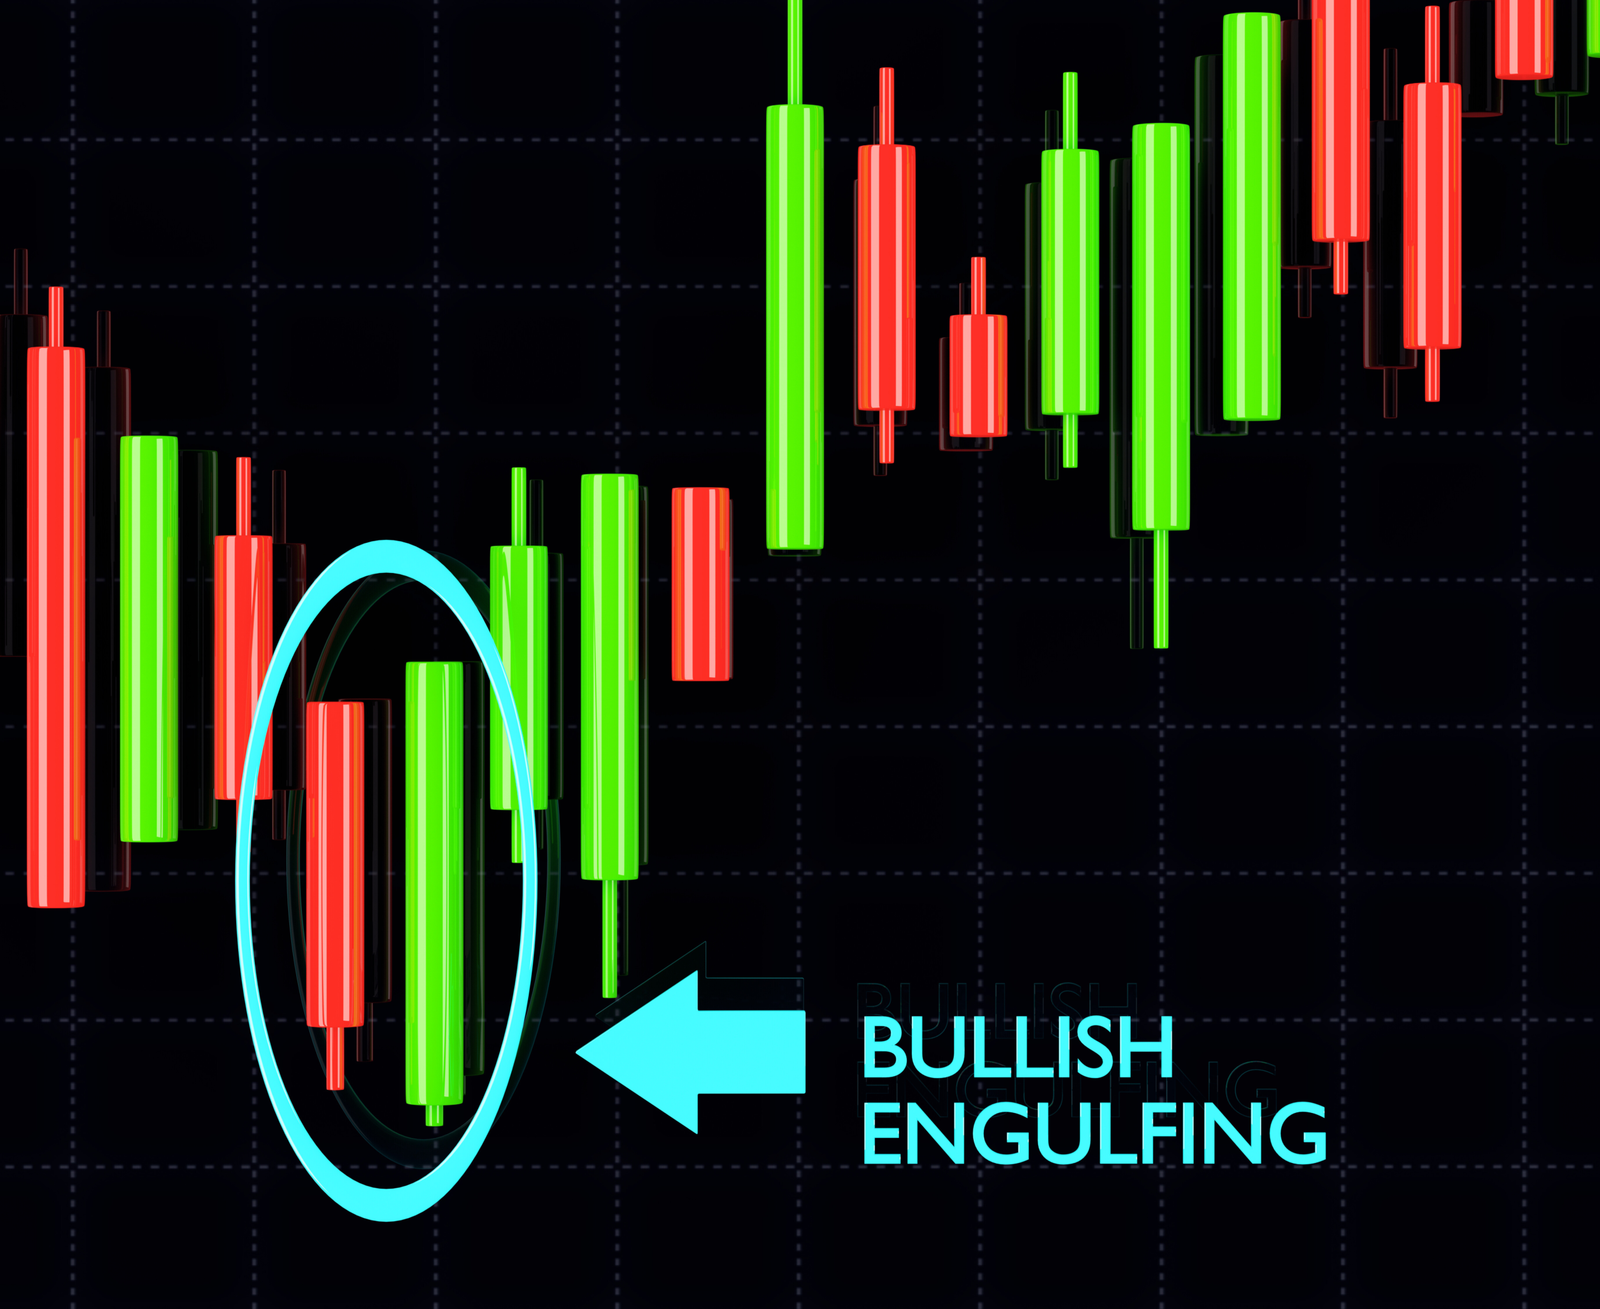
A Bullish Engulfing pattern consists of a smaller bearish candle followed by a larger bullish candle whose real body engulfs the prior real body. It reflects a rapid transfer of short-term control, but its information value is lower when it appears randomly in the middle of a range. A Morning Star consists of a long bearish candle, a small indecision candle, and a stronger bullish candle. An Evening Star is the inverse. The third candle is the confirmation component; the middle star is not a standalone signal.
In practice, candlesticks work best as triggers rather than complete arguments. Higher-time-frame structures, important support and resistance, and post-breakout acceptance provide the context. Candles then help interpret rejection, absorption, or a short-term transfer of control. If a single candle conflicts with the larger structure, its weight should be reduced.
Harmonic Patterns: Ratios Narrow the Hypothesis, but a PRZ Never Guarantees a Reversal
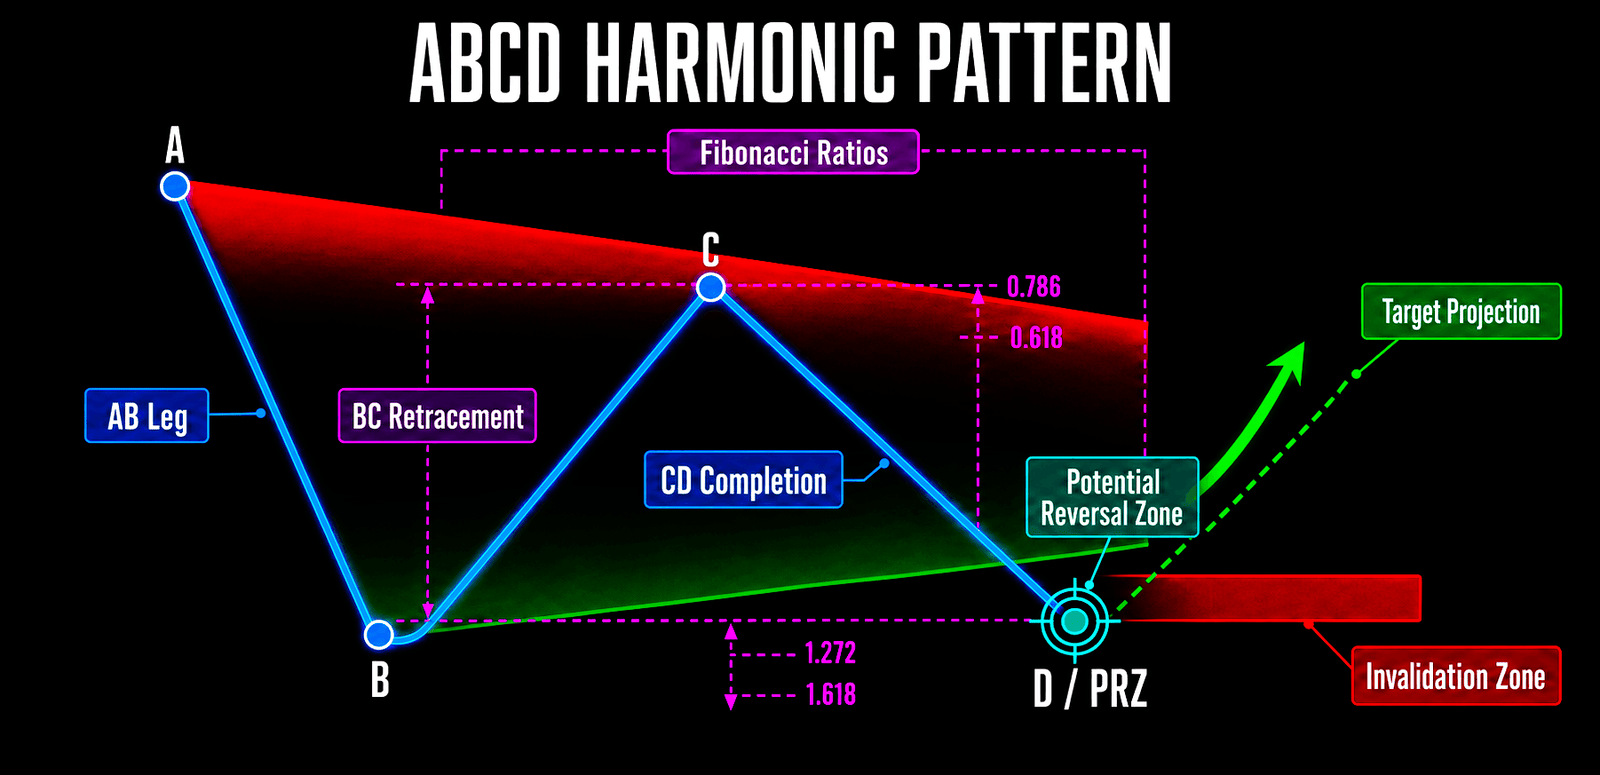
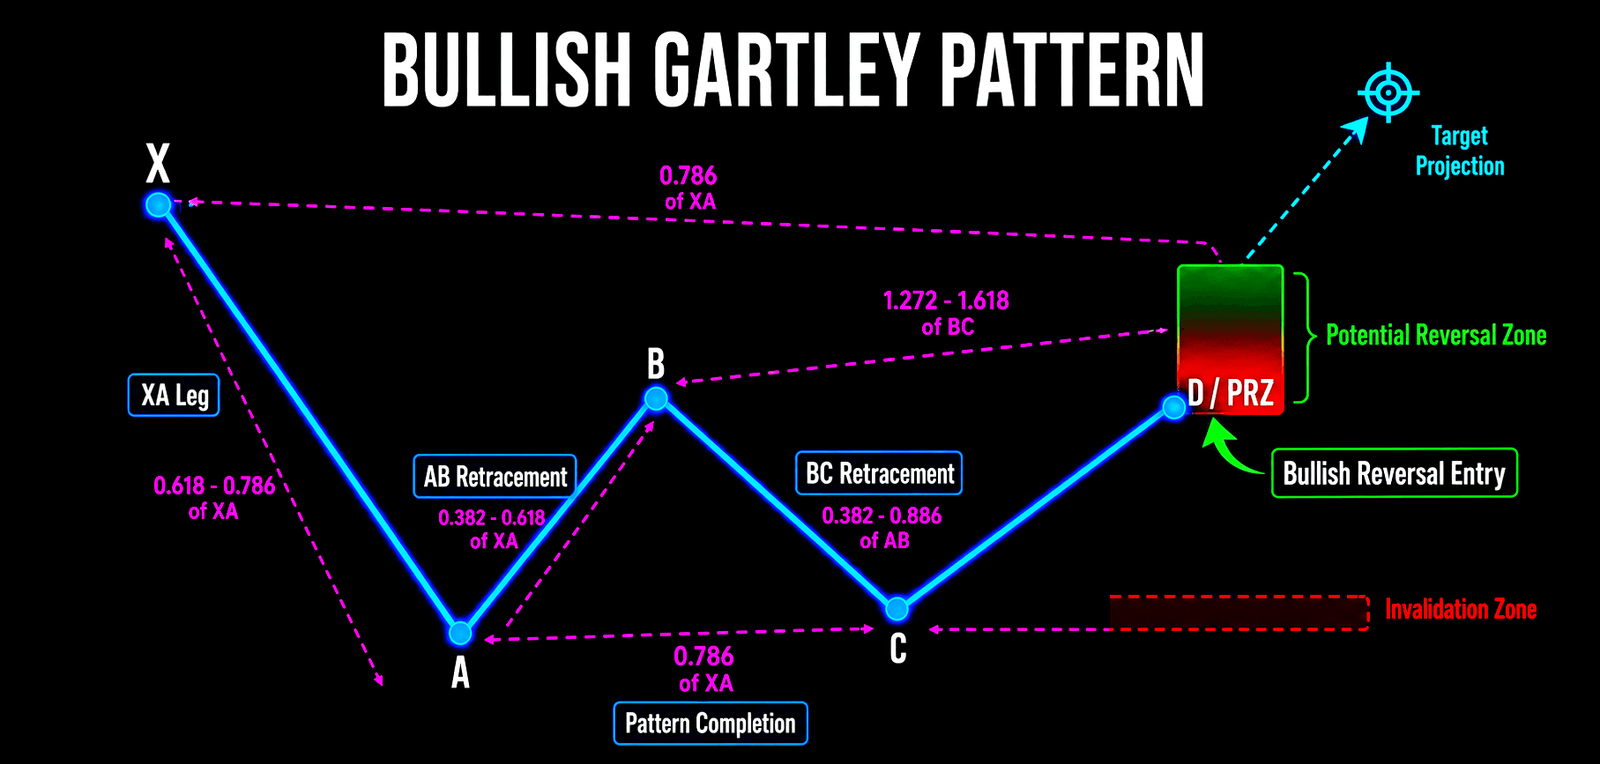
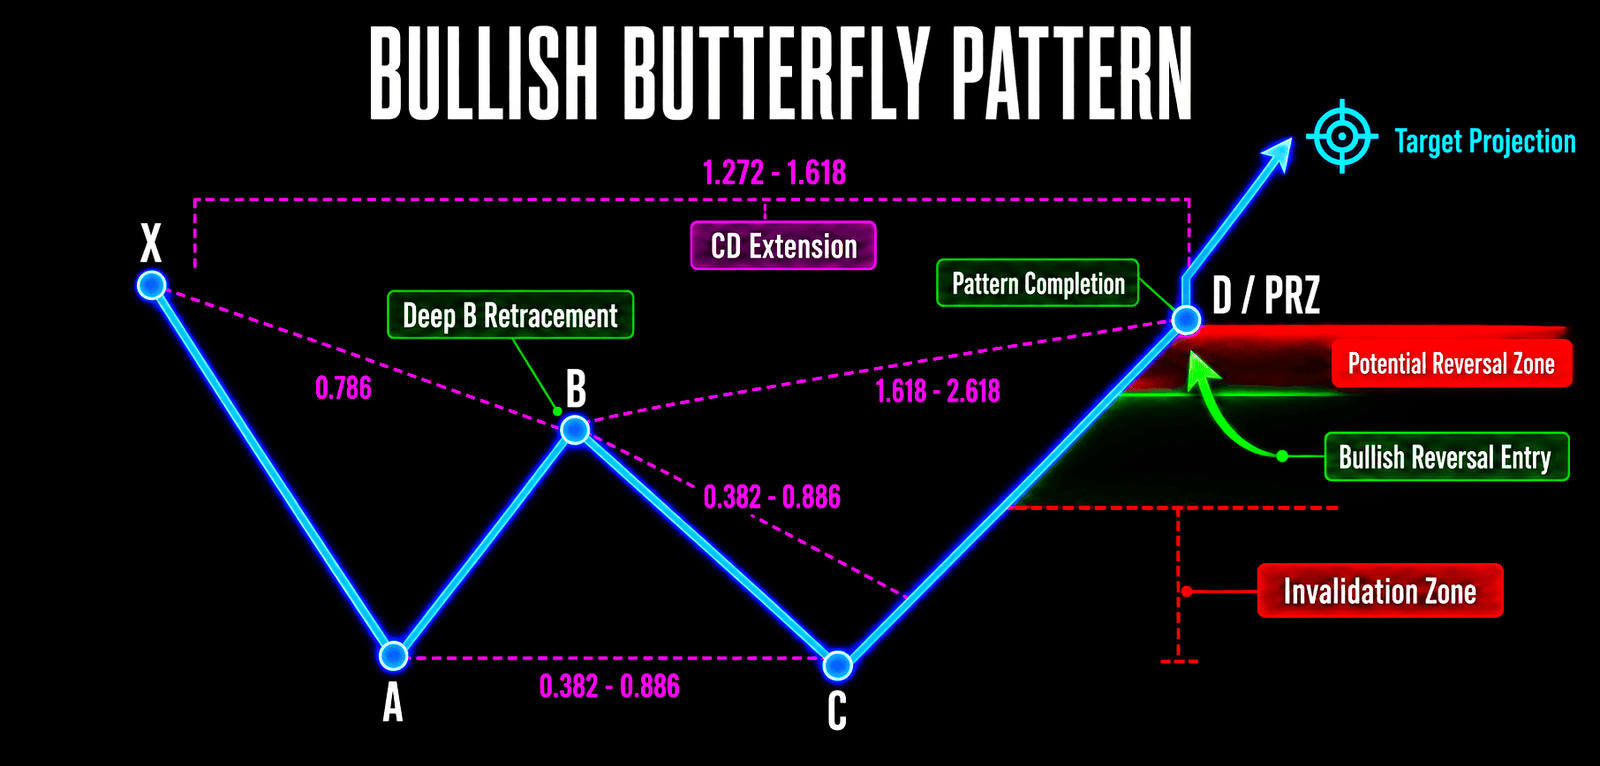
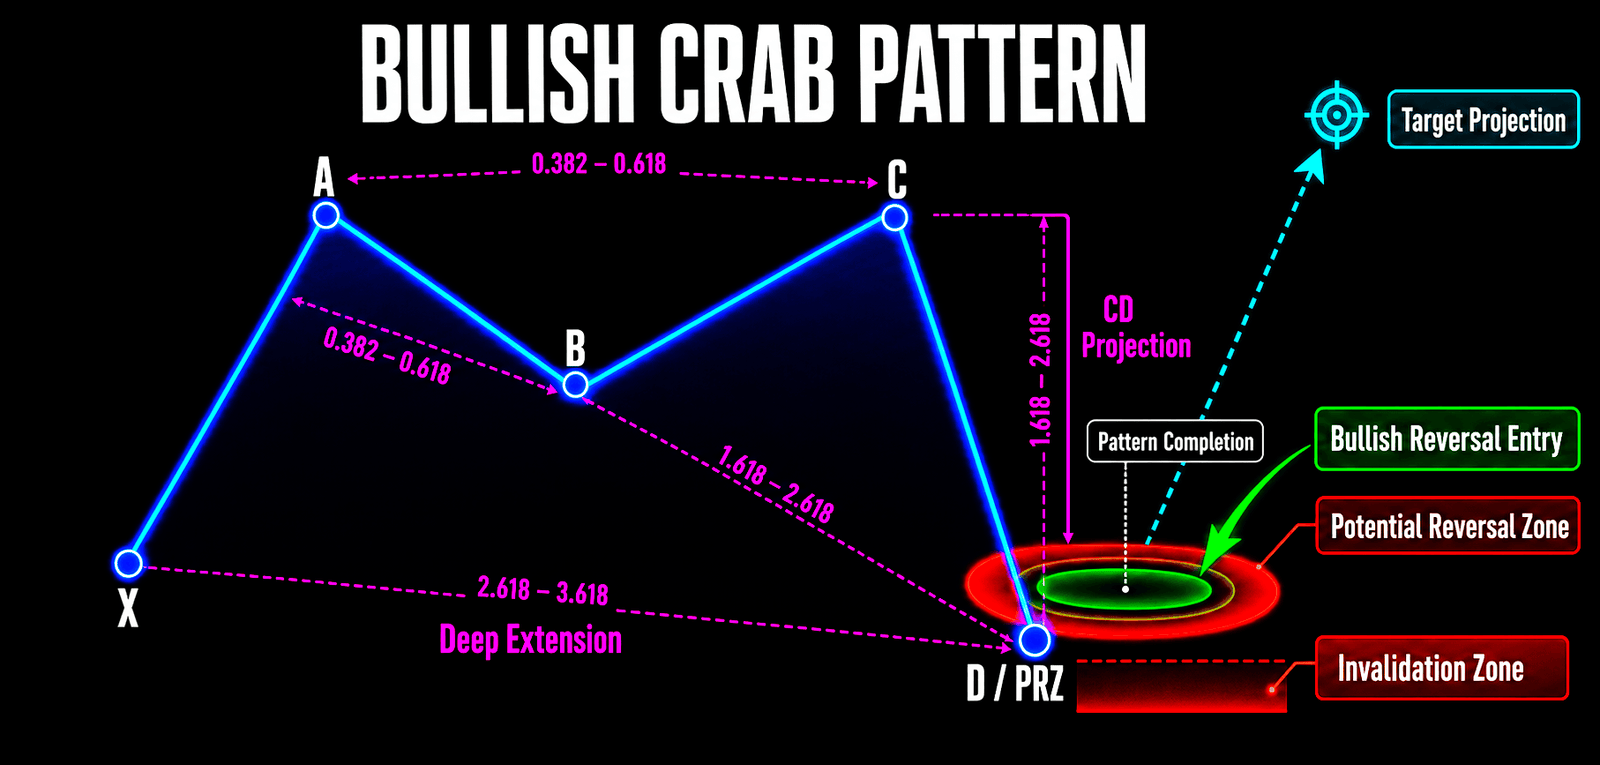
Harmonic patterns use five turning points—X, A, B, C, and D—together with Fibonacci retracement and extension ratios. IG’s educational material explains that harmonic patterns use Fibonacci relationships to identify potential price changes or trend reversals, with ABCD as a foundation and Gartley, Butterfly, Bat, and Crab adding the X point and more specific relationships.4 The key concept is the PRZ, or Potential Reversal Zone. A PRZ is an area where price may react; it is not a magical level where reversal must occur.
ABCD analysis focuses on the similarity of the AB and CD legs in direction, price distance, and often time. If four arbitrary swings are connected without ratio validation, the result is not a meaningful ABCD pattern. The illustration places a PRZ, target, and invalidation zone around D to show that the completed structure still requires a reaction. Traders should not blindly fade price before the market demonstrates rejection.
Gartley commonly emphasizes the retracement of B relative to XA and the retracement or completion area at D. The Butterfly places greater emphasis on an extension beyond X. The magenta ratio lines are not decorative; they convert an attractive shape into a checkable set of conditions. If the ratios are adjusted after the fact merely to preserve a preferred label, the pattern has become a subjective story rather than a rule-based model.
The Crab is known for a more extreme extension, with D often located in a deeper PRZ. Extreme does not mean reliable. It means that once price reaches the zone, the potential reward-to-risk relationship may deserve a fresh assessment. Confirmation is still required: rejection, recovery of a key level, or a clearly definable invalidation point. The most common harmonic mistake is to treat the PRZ as an entry price and ignore the possibility that price may travel through the entire zone.
Universal Rules Across the Patterns: Breakout, Retest, and Invalidation Matter More Than the Target
First, define the prior trend. A reversal pattern without a prior trend is often just consolidation. A continuation pattern without an impulse or flagpole is often simply a triangle or rectangle.
Second, confirmation should use the closing location and market acceptance, not only an intrabar high or low.
Third, examine the S/R Flip after the breakout: can former resistance hold as support, or can former support cap a rally as resistance? The retest frequently distinguishes a genuine breakout from a liquidity sweep.
Fourth, measured objectives are geometric references. For a Head and Shoulders pattern, the reference is the head-to-neckline height. For a triangle, it is often the widest height. For a flag, it is the flagpole. For a rectangle, it is the range height. For harmonic patterns, the reaction area comes from the ratio structure and PRZ. Whatever method is used, write the invalidation condition before discussing the target. A target without an invalidation point is an attractive but unmanaged fantasy.
Fifth, keep analytical tools in their proper category. S/R Flip is a post-breakout validation mechanism, not an independent geometric pattern. Volume Profile or volume analysis can help locate participation and acceptance, but it is not the pattern itself. A candlestick is a short-term emotional snapshot, not a higher-time-frame direction. Keeping these distinctions clear prevents an analysis from becoming a pile of impressive terms.
Conclusion: The Real Edge Is Not Knowing the Most Names; It Is Rejecting Wrong Hypotheses Quickly
The most valuable skill in pattern analysis is not naming a shape instantly. It is knowing when the market has only produced a potential structure, what event completes it, which price or structural condition invalidates it, and whether the breakout has truly been accepted. A Head and Shoulders can fail. A Double Bottom can become a continuation structure. A triangle can break either way. A candlestick loses meaning in the wrong location. A harmonic PRZ can be crossed without producing a reversal.
For Chart-Blitz readers, the most useful process is to read the context first, define the pattern boundary second, wait for confirmation and a retest third, and use the measured objective only to frame scenarios. Do not use the target to manufacture conviction. Markets do not become kinder because a chart is beautifully drawn. A framework that clearly defines confirmation and invalidation, however, makes errors visible, controllable, and correctable.
I will continue to closely monitor the price action of various cryptocurrencies and other valuable assets. As soon as a critical reversal signal appears on the charts, I will update my analysis and insights right here immediately. Remember to Bookmark this page and come back often to check for the latest updates!
Want to see our full, interactive chart breakdown? If you want to learn how to draw weekly VPFR, Fibonacci, EMA Ribbon, MACD, Supertrend, and S/R Flip frameworks designed for real trading decisions. Please browse the following『Further Reading』links. Fundamental news tells you what happened. Technical analysis predicts what will happen. To master the professional framework that separates market signal from noise, explore our exclusive models at https://www.chart-blitz.com/fxcx-app/omni-chart.html?symbol=BTC.
📚Further Reading:
To help everyone gain a deeper understanding of the various technical indicators mentioned in this article, we have specially prepared the following further reading materials. These cover key analytical tools found across the weekly, daily, monthly, and 4-hour charts.
Understanding VPFR: Finding the Hidden Footprints of Market Makers — The Volume Profile Fixed Range (VPFR) is a powerful tool that tells us where the most trading occurred within a specific price range. This helps us identify true support and resistance levels, as well as potential ‘Vacuum Zones’.
S/R Flip Support and Resistance Swap Strategy — S/R Flip is one of the most powerful concepts in technical analysis. This article uses real cases to teach you how to use S/R Flip to capture the highest win-rate trading opportunities.
Bollinger Band: Long-Term Repricing Zone — The Ultimate Tool to Capture Massive Market Moves Tired of getting shaken out of winning trades too early? Or buying right before a trend reverses? An ex-banker reveals how to use the Bollinger Band to filter out market noise and ride the big waves.
KDJ Stochastic Indicator Bottom Confirmation — What is the implication of a downward-curving KDJ? Understand in one article how to use dynamic indicators to catch market turning points.
【Disclaimer】 The content herein is for educational purposes and reflects the author’s personal opinion only; it is not investment advice. All financial investments, including cryptocurrencies, carry significant risk, and you could lose your entire capital. To support this site, this article may contain affiliate links. While we strive for accuracy, we cannot guarantee all information is complete or error-free. Please conduct your own research and be fully responsible for your own investment decisions.