Fetching Live Market Data...
When you make a trade, you should have a clear target of where you expect to get out
William Delbert Gann – 1949
SOL’s most dangerous move is not the reclaim of $100. The danger is that traders may confuse a forced-buying event with a confirmed trend reversal.
The news tape looks seductive. SOL has pushed back through the three-digit psychological gate. Short positions were liquidated. ETF-linked flows turned positive over a seven-day window. Trading activity surged. A governance proposal around reducing token emissions entered the narrative. Put those items together and the retail mind does what it always does at the worst possible moment: it compresses every bullish-looking input into one lazy conclusion — “the bull market is back.”
A trading desk would not be that generous. A desk would ask who had to buy after the move had already started. It would ask whether the $100 breakout created real demand or merely triggered stop-losses, momentum orders, and headline-chasing flows. It would look at the order book the way a syndicate desk studies a bookbuild: not by applauding the first burst of interest, but by testing the quality of demand after the price has been repriced.
Yahoo/FX Empire reported that SOL rose about 8% over 24 hours after breaking above the $100 psychological threshold. The same report cited roughly $21 million in short liquidations, a 66% increase in trading volume with nearly $5.5 billion traded, a seven-day positive net-inflow streak of $104 million into SOL-linked ETFs, and a governance vote that, if approved, would reduce emissions by 18.9 million SOL over six years [2]. These are not meaningless details. They are the match that lit the room.
【📊Analysis Baseline Statement】
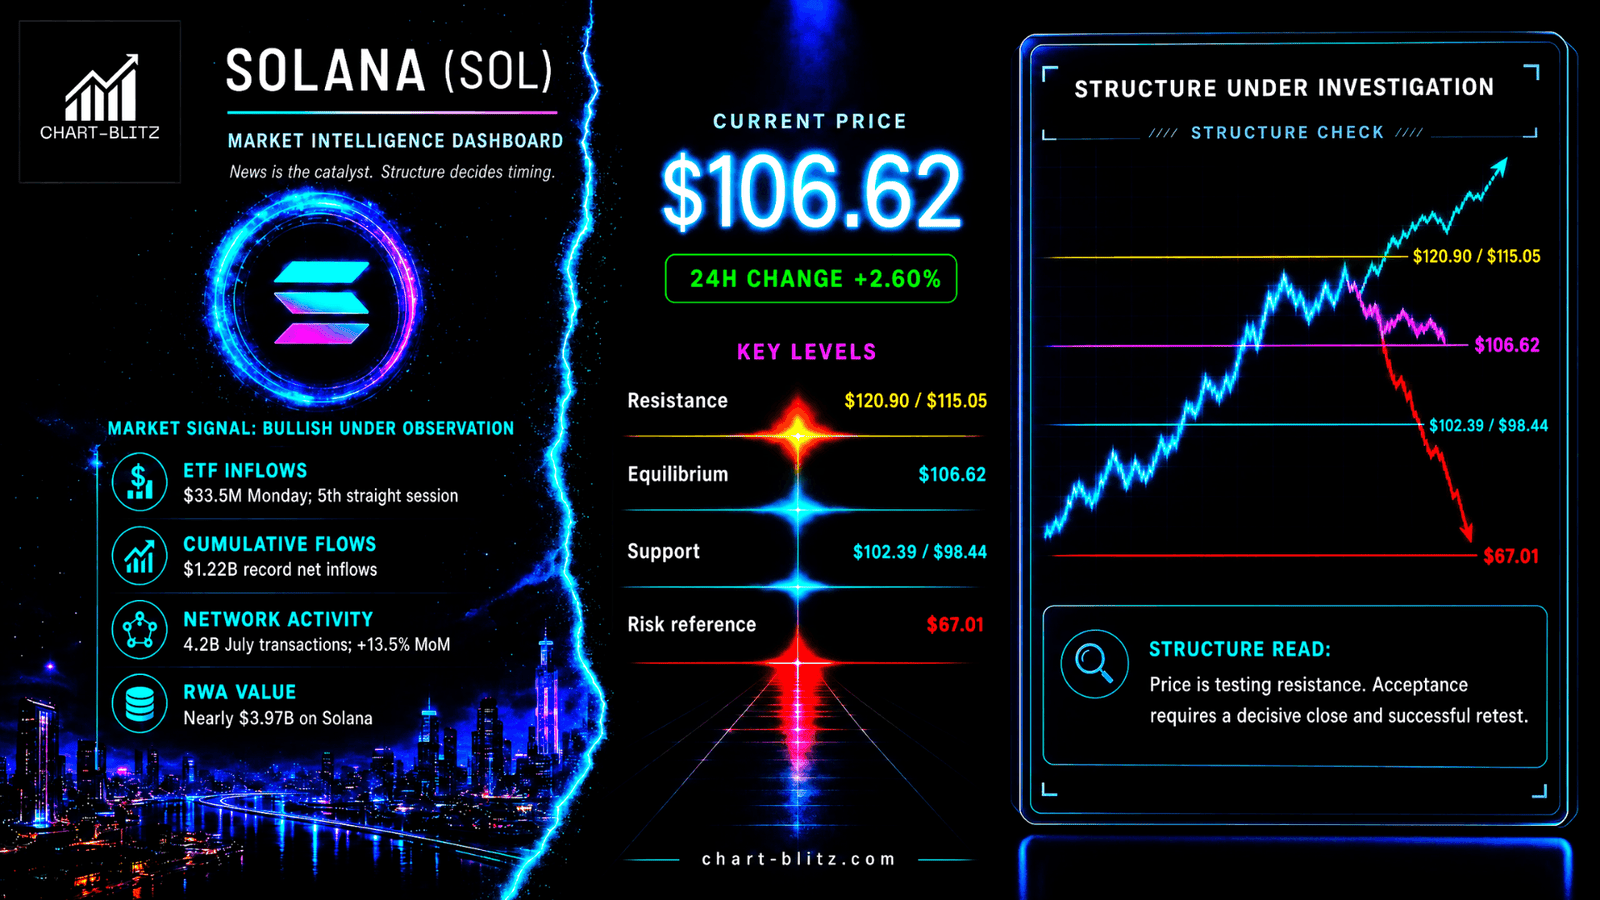
All technical analyses below are based on the price snapshot locked on August 28, 2026 (EST): 04:11 Solana (SOL) = $106.62 USD. Please treat this report as an “analytical map” rather than a real-time quote.
📈 Weekly Witness Stand — The Lower-High Structure Still Has a Lawyer
The weekly chart is the primary witness in this case because it refuses to be flattered by a headline. The visible Dow structure tells a blunt story: Swing High $250.37, Swing Low $186.81, Lower High $202.72, Lower High $144.25, Lower Low $173.79, Lower Low $119.71, Lower High $115.05, Lower Low $78.92 and Lower Low $60.15. The exact ordering of labels on a chart may look messy to the casual eye, but the message is not messy. SOL has been operating inside a structure that repeatedly failed to print convincing higher highs.
Weekly Timeframe for SOL (Solana)
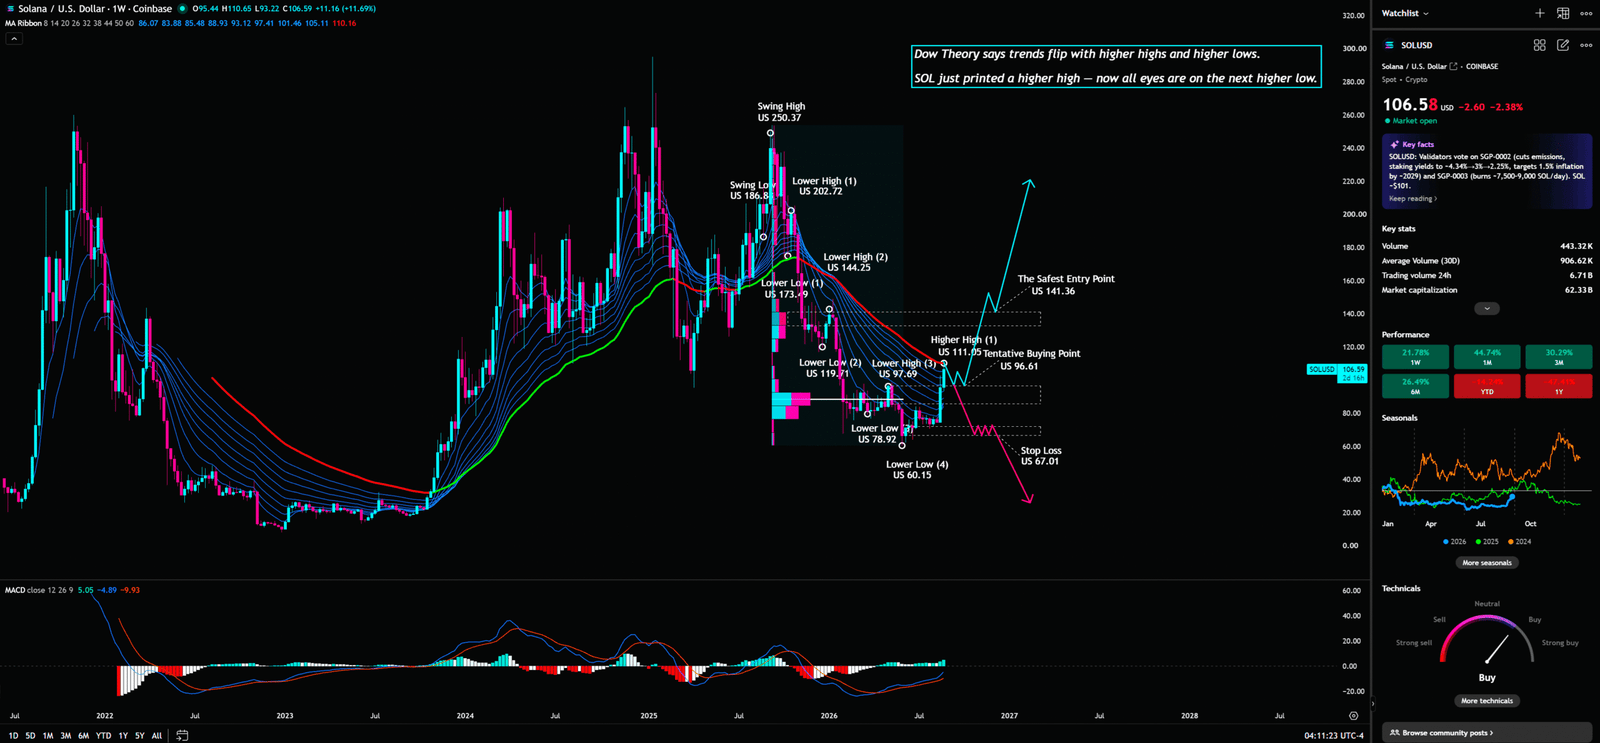
Dow Theory matters here not as a museum piece, but as courtroom record. A bullish trend needs higher highs and higher lows. A corrective or bearish sequence keeps producing lower highs and lower lows. SOL’s reclaim of $100 is encouraging, but the weekly chart has not yet delivered the structural confession bulls need. The visible $115.05 lower high is the first serious witness. If price cannot reclaim and hold above it on a weekly basis, the market can still classify the move as a rally inside a damaged structure.
The EMA ribbon and MACD visible on the weekly chart add background pressure. The EMA ribbon shows whether directional averages are aligned, compressed, or expanding; it is useful because a rally into a still-heavy ribbon can become resistance rather than support. MACD measures momentum regime. Its job here is not to shout “buy” or “sell.” Its job is to help determine whether the move above $100 is developing into directional strength or simply burning liquidation fuel.
The chart annotation around $96.61 is a tentative buying point. That phrase must be treated carefully. It is not a guaranteed floor. It is not a magical institutional bid. It is a conditional test zone. If SOL pulls back after the $100 reclaim, the market’s behavior near $96.61 would tell whether buyers are willing to defend a repaired psychological area or whether the breakout was only a temporary squeeze.
The $141.36 annotation is more serious. It is marked as a safer entry point on the chart, but in professional language it should be treated as a safer confirmation zone, not a promise of profit. Why? Because if SOL can move through the nearer lower-high resistance and later reclaim a higher structural area, the market begins to show actual repair. At that point, the discussion shifts from “relief bounce” to “structure improving.”
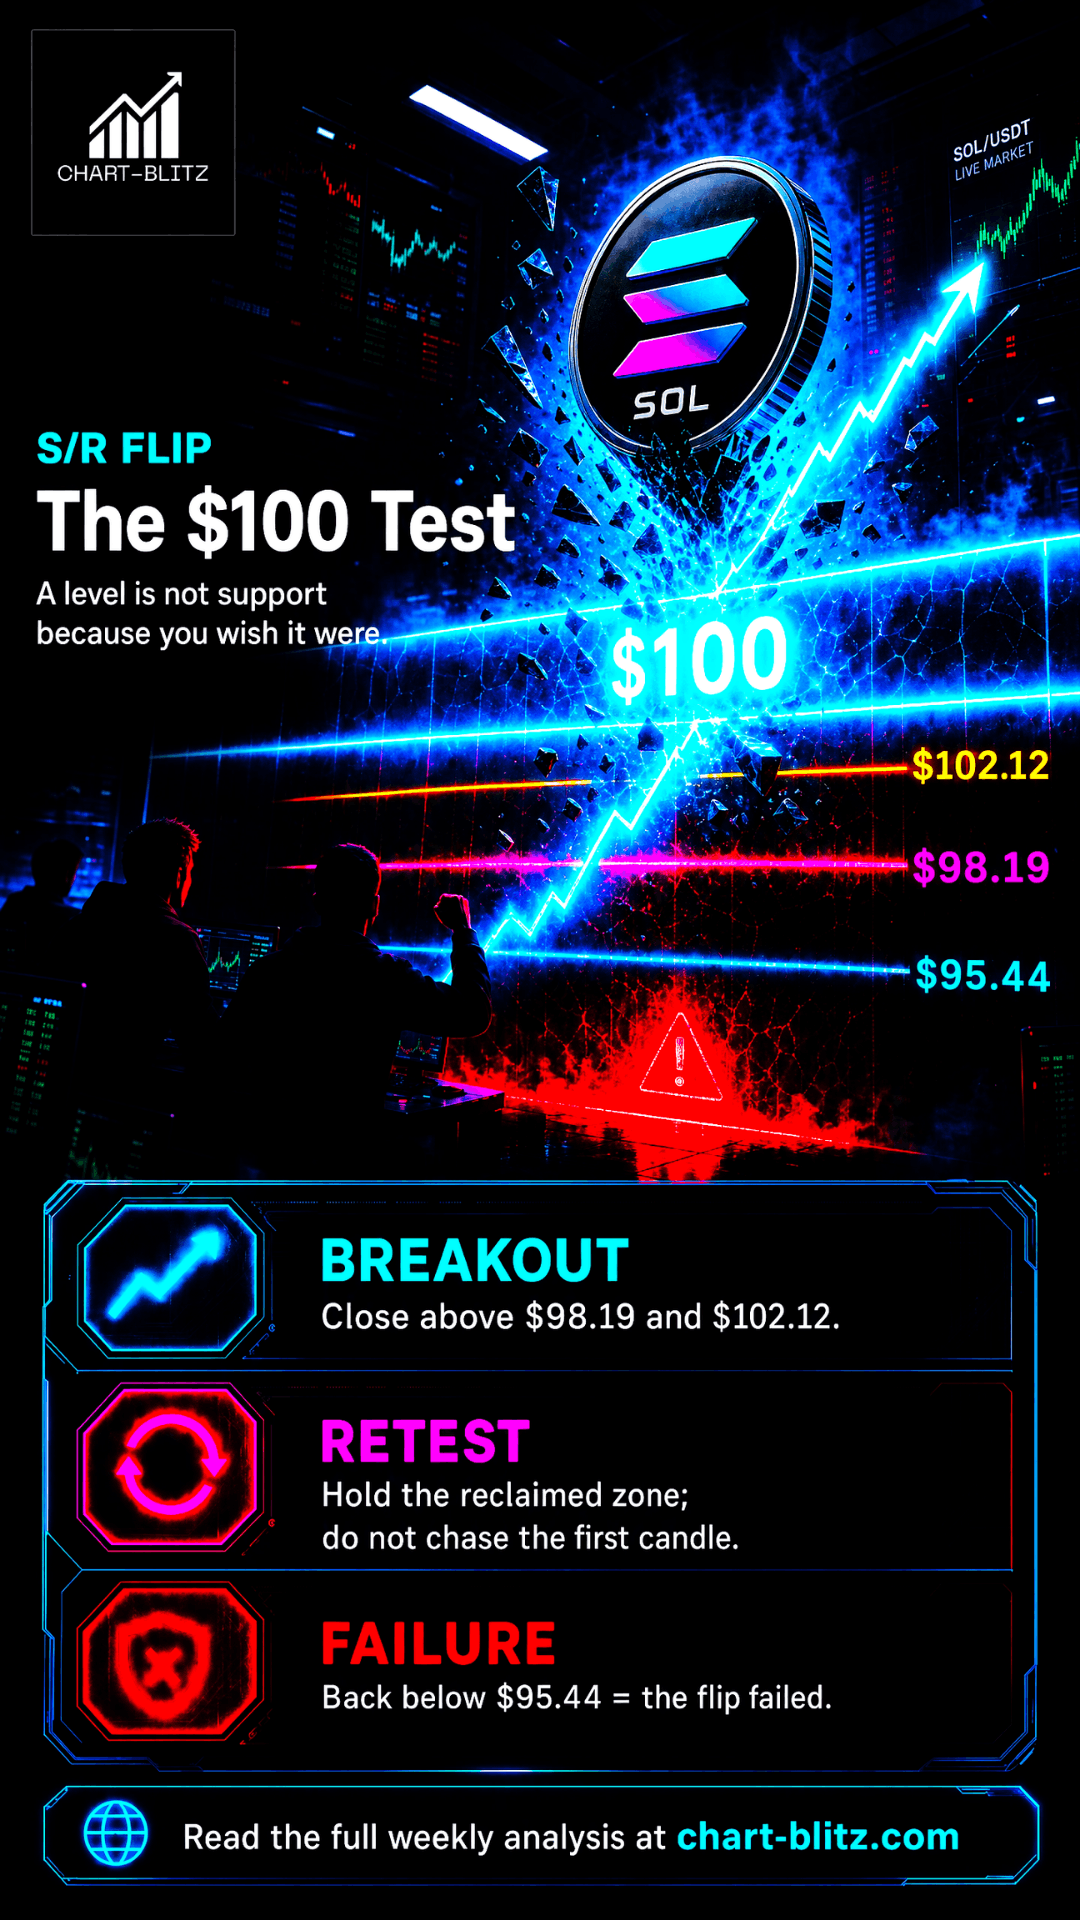
That is where the S/R flip becomes critical. A resistance level being pierced is not enough. The market must turn old resistance into support. It must hold after the breakout. It must show that sellers can no longer push price back into the prior range. One spike through a level is theater. A breakout, retest, and hold is evidence.
The $67.01 visible stop-loss annotation is the opposite side of that evidence chain. It is not a forecast. It is a conditional thesis termination reference. If the market breaks down into that zone under a renewed lower-low sequence, the bullish story should not be defended with ETF flow headlines, governance optimism, or ecosystem slogans. When a risk committee shuts down a trade, the pitch deck stops talking.
This is the first major lesson of the weekly chart: the move above $100 matters, but it does not settle the case. A weekly reclaim and hold above $115.05 would be the first structural repair. A move toward and acceptance around $141.36 would carry stronger confirmation value. A failure below $96.61 would weaken the tentative long thesis. A move toward $67.01 would represent a much deeper invalidation zone based on the visible chart annotation.
Weekly Desk Note
“Before $115.05, SOL is still testifying. Beyond $141.36, the testimony begins to look like evidence.”
The institutional behavior here is straightforward. Institutions may allow price to clear obvious resistance because obvious resistance produces obvious buyers. Those buyers provide liquidity. The desk then watches whether the newly cleared zone becomes support or whether the market dumps back through it. Retail celebrates the breakout. Institutions audit the retest.

📊 Daily Interrogation Room — $120.90 Must Answer Under Pressure
The daily chart is where the rally gets interrogated one session at a time. The visible Fibonacci retracement framework shows $13.21 at 0, $90.59 at 0.236, $120.90 at 0.382, $154.17 at 0.5, $187.43 at 0.618, $234.90 at 0.786 and $295.12 at 1. Current chart labels around $106.5 place SOL above $90.59 but still below $120.90.
Daily Timeframe for SOL (Solana)
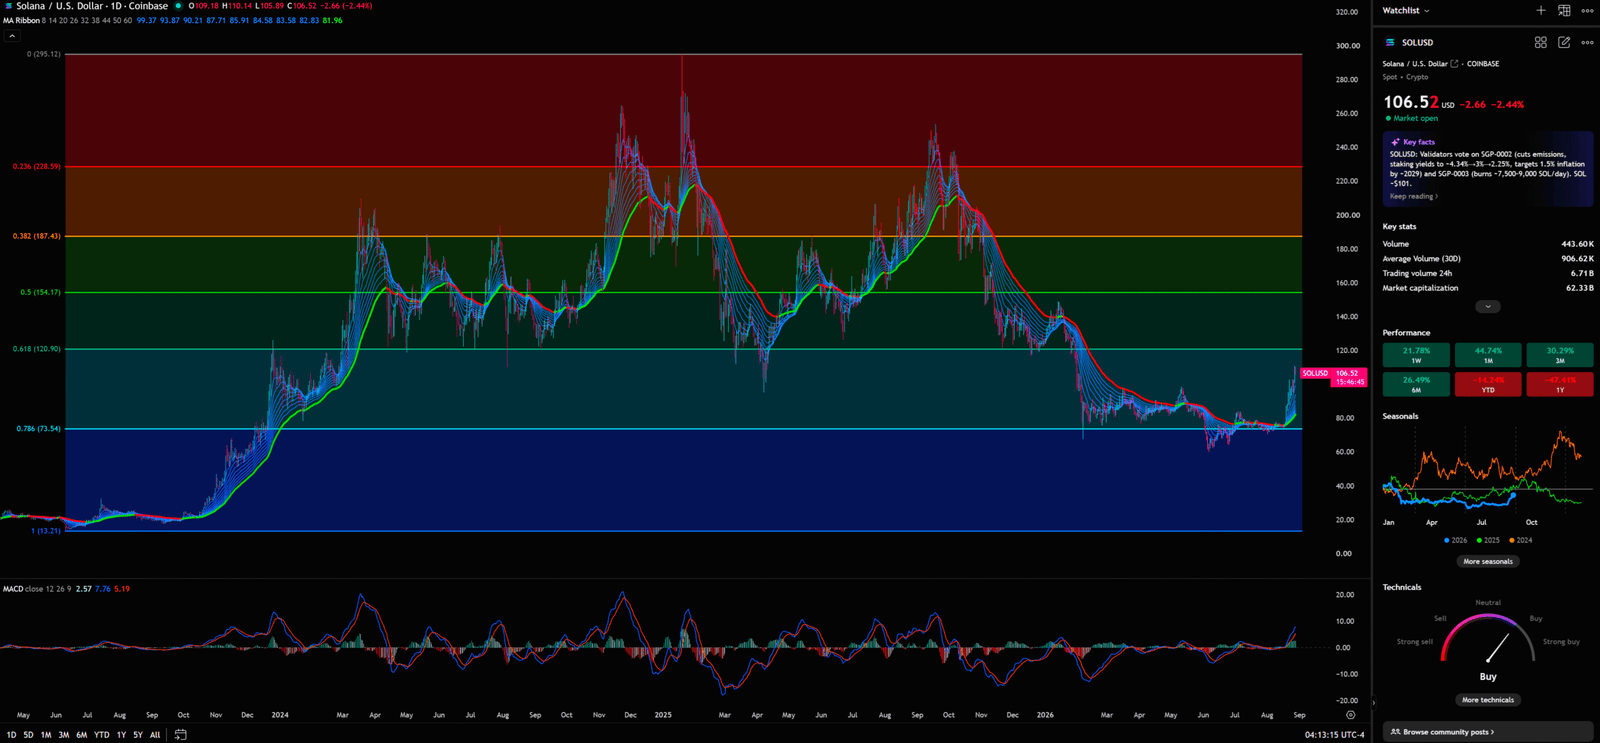
That means the daily recovery has repaired the lowest retracement band, but it has not won the more meaningful 0.382 zone. Fibonacci levels are not magnets. They are auction zones where prior movement is measured and where supply or demand often becomes visible. The market does not owe SOL a trip to $120.90 simply because a number is printed on a chart. The level matters only because traders will reveal behavior around it.
A daily close above $120.90 would improve the structure and open a more credible path toward $154.17. But the close alone is still not enough for a mature thesis. The better evidence would be a daily close, followed by a retest that holds, ideally with momentum not collapsing. If price rejects below $120.90 and starts slipping back toward $100, the rally becomes vulnerable to the accusation that it was built on short covering and retail chase rather than sustained demand.
The daily EMA ribbon and MACD help frame that interrogation. If price is rising into the ribbon but cannot expand away from it, sellers may still be distributing into strength. If MACD improves alongside price acceptance, the market begins to show broader momentum confirmation. Again, the point is not to teach indicators in isolation. The point is to ask whether capital is acting like it wants exposure or merely covering risk.
Daily Interrogation Line
“$120.90 is not just a target. It is where SOL must explain whether this is a bounce or a repricing.”
Retail traders frequently misuse this part of the chart. They see $120.90 and treat it like an appointment. Professionals see it as a witness under pressure. If it holds, the witness gains credibility. If it cracks immediately, the prosecution gets louder.
📉 Monthly Judge’s Desk — ABC Is a Hypothesis, Not a Pardon
The monthly chart is slower, colder, and more dangerous to overinterpret. It shows Bollinger Bands, KDJ, and a hand-marked Elliott ABC correction hypothesis. The annotation suggests that an ABC correction may be completing before a larger move. That is a possibility. It is not a verdict.
Monthly Timeframe for SOL (Solana)
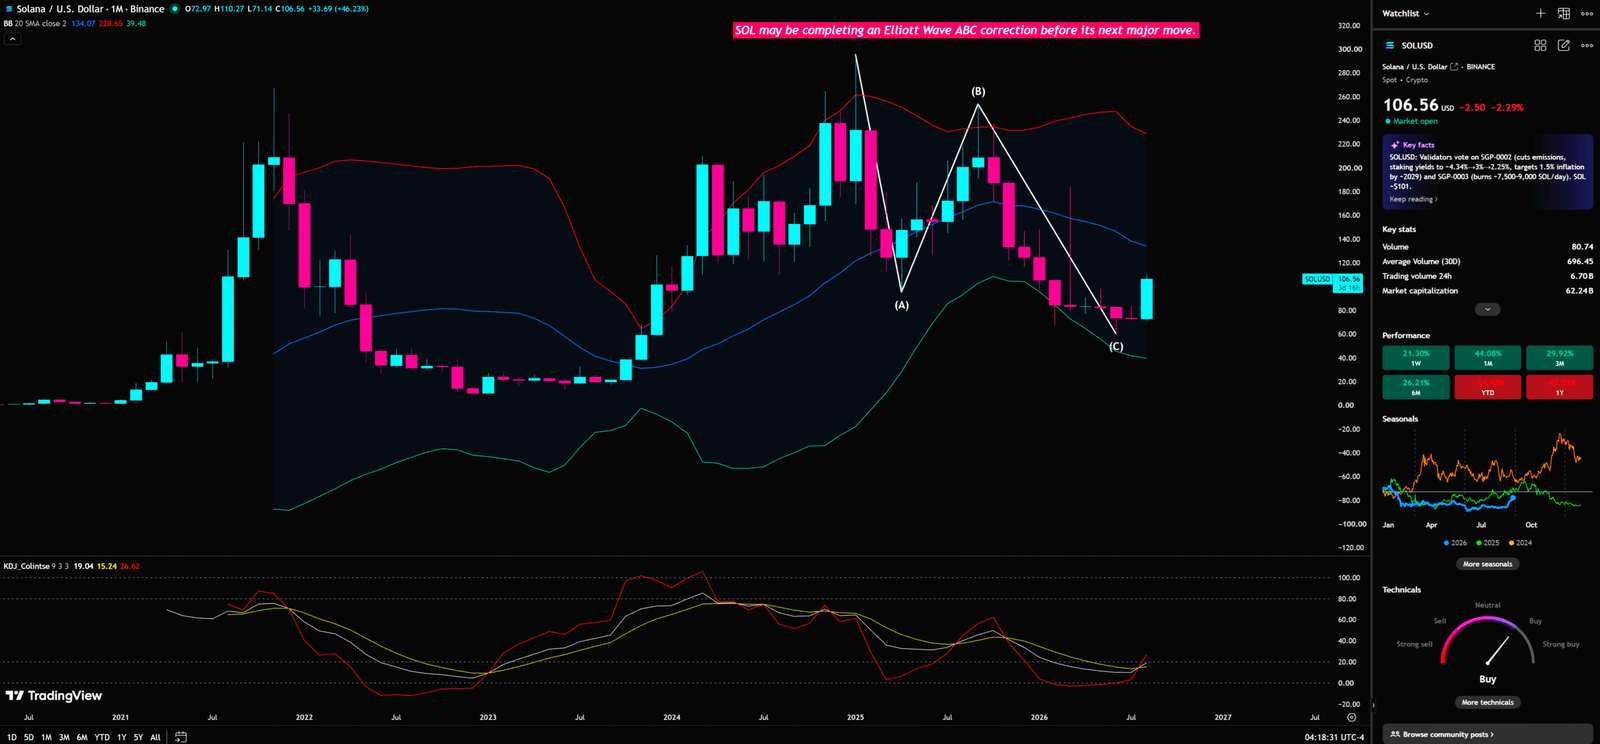
Bollinger Bands frame volatility around a moving average. A recovery from the lower-band region can show that downside pressure is easing. KDJ measures the position and turning behavior of price within a recent range. A turn upward from depressed levels can support the idea that momentum is recovering. But neither tool proves a secular bottom. A monthly oscillator turning higher is a backdrop, not a trading plan.
The Elliott ABC annotation must be handled with even more discipline. An ABC correction is a structural hypothesis. It is not an instruction from the market. If someone tries to force a five-wave impulsive count, the classical constraint matters: wave 4 should not overlap the top of wave 1 in a standard impulse interpretation. If that condition is violated, the count should not be forced simply because the analyst wants a bullish conclusion.
The monthly chart therefore supports a cautious possibility: SOL may be attempting to complete a larger correction. But it still needs weekly repair, daily acceptance, and 4H execution. A judge can allow a case to proceed; the evidence still has to survive cross-examination.
Longer-horizon capital may indeed be probing depressed levels. ETF inflow narratives can strengthen that view. At the same time, existing holders may use relief rallies to reduce exposure. Both behaviors can occur inside the same candle. That is why monthly context is useful but insufficient. It tells us a recovery thesis is plausible. It does not tell us to ignore invalidation.
Monthly Judge Note
“The monthly chart can permit the hypothesis. It cannot replace the weekly evidence.”
📐 4H Execution Gate — $107.42 Is Where Chasers Get Audited
The 4H chart is the execution layer. It cannot overrule the weekly structure, but it can expose where traders are about to pay too much for confirmation. The visible levels are $83.91 at 0, $89.48 at 0.236, $92.89 at 0.382, $95.67 at 0.5, $98.44 at 0.618, $102.39 at 0.786, $107.42 at 1, and $112.97 at 1.236. Rising fan or angle lines are also visible, showing the slope of the short-term recovery.
4-Hour Timeframe for SOL (Solana)
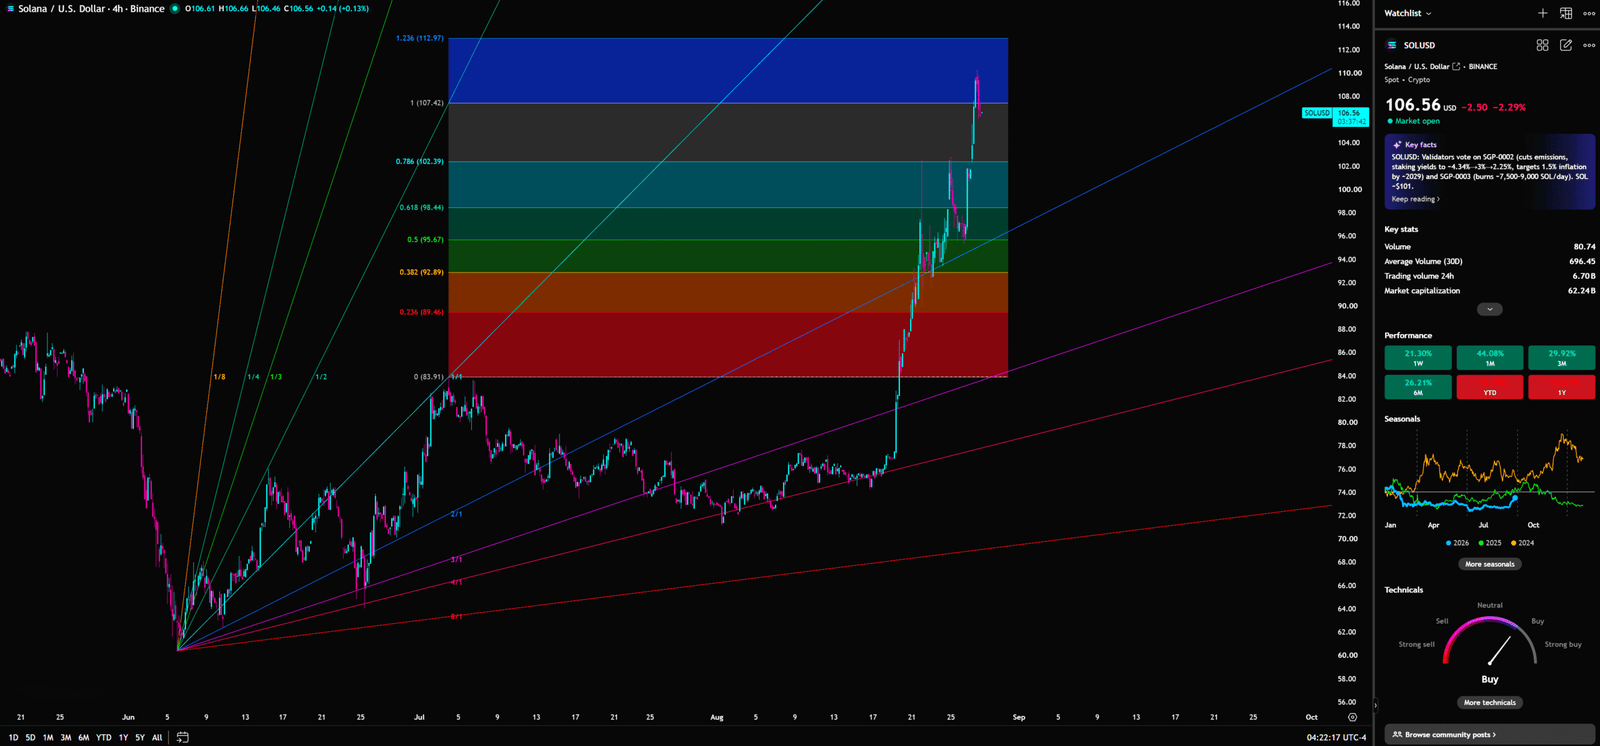
At a chart label around $106.56, SOL is pressing the $107.42 anchor. This is exactly the area where retail tends to confuse proximity with permission. A 4H move above $107.42 can open the visible extension reference toward $112.97. But a breakout that immediately loses $107.42, then breaks $102.39, is not strength. It is a warning that the market used the breakout to collect liquidity.
A constructive 4H sequence would be acceptance above $107.42, a successful retest, and continued respect of the rising fan structure. If price pulls back into $102.39–$98.44 and holds, the rally has a cleaner tactical base. If it loses $102.39 and then $98.44, the immediate bullish execution map is damaged. A deeper slide toward $95.67 would place the market back into repair mode.
The execution lesson is brutally simple: do not buy the candle because it looks brave. Buy only if risk is defined and the retest confirms that prior resistance has become support. A market that cannot hold its own breakout is not asking for confidence; it is asking for exit liquidity.
4H Execution Warning
“The breakout is cheap evidence. The retest is where the market signs the receipt.”
Retail vs Institutions — Same Candle, Different Business Model
The same candle means different things to different balance sheets. Retail sees SOL above $100 and asks how high it can go. Institutions see SOL above $100 and ask how much liquidity has just appeared.
Retail behavior is emotional and linear: good news means buy, liquidation means shorts are wrong, ETF inflows mean institutions are bullish, supply reduction means price must rise. Each statement contains a piece of truth and a dangerous simplification. The market punishes simplification because simplification creates predictable orders.
Institutional behavior is more cynical. The desk watches where stops sit, where late buyers enter, where prior holders can reduce exposure, and where the market refuses to break. Institutions do not need to believe the story. They only need to understand how other participants will trade the story. If the public rushes into a breakout, liquidity improves. Better liquidity allows larger players to test supply, distribute inventory, or scale into positions with less slippage.
That does not mean the market is automatically bearish. It means the burden of proof is on price. If SOL can hold $107.42, reclaim $115.05, close above $120.90 and eventually move toward $141.36 with proper acceptance, institutions may become buyers of structure rather than sellers into excitement. If the move fails at these gates, the same institutions may treat retail enthusiasm as exit liquidity.
Retail vs Institutions
“Retail trades the headline. Institutions trade the behavior created by the headline.”
🎯 Three Scenarios — Bull, Bear, and the Punishment Range
The bullish scenario begins with 4H acceptance above $107.42 and a successful retest. That opens the visible extension reference at $112.97. The daily chart then needs a close above $120.90. A clean S/R flip there would support a path toward $154.17. On the weekly chart, reclaiming and holding above $115.05 is the first structural repair, while $141.36 is the stronger confirmation zone visible on the chart. This route is possible, but it must be earned level by level.
The bearish scenario starts with failure around $107.42 or rejection before $120.90. A loss of $102.39 weakens the 4H breakout, and a loss of $98.44 damages the immediate bullish map. A fall toward $95.67 and then $90.59 would put the daily recovery under pressure. If the weekly structure rolls over again and risk deepens toward the chart-marked $67.01 stop-loss reference, the bullish thesis would require serious reconsideration or termination.
The neutral scenario is the punishment range. SOL may rotate between $102.39 and $120.90 while headlines remain loud and structure remains undecided. This is the kind of market that drains impatient traders. It rewards only those who can define risk and refuse to chase every candle. A range is not boredom. It is the market charging rent to traders who need constant action.
Trading Plan — No Hero Trades at the Tollbooth
The first rule is not to treat $100 as a bull-market passport. It is a tollbooth. If a trader already holds SOL, the focus should be on whether price accepts $107.42, defends $102.39, avoids losing $98.44, and then forces the daily conversation toward $120.90. Weekly attention should remain on $115.05 and $141.36.
If a trader does not hold SOL, the worst plan is to buy the headline after the move and place a stop where every other late buyer has placed one. The better plan is to wait for a retest, wait for S/R flip behavior, and accept missing the first candle if the trade cannot be defined with discipline.
The visible chart annotations must be respected as conditional references. $96.61 is a tentative buying point annotation, not a guaranteed support level. $141.36 is a safer confirmation zone annotation, not a guaranteed profitable entry. $67.01 is a stop-loss reference visible on the weekly chart, not a universal risk parameter and not a forecast. The closing perspective is cold: if SOL is truly repairing, the market will offer evidence. If this is a liquidity trap, the first emotional buyers will provide the evidence by getting trapped. Professional trading does not require being first. It requires still having capital when the market finally becomes clear.
I will continue to closely monitor the price action of this Crypto. As soon as a critical reversal signal appears on the charts, I will update my analysis and insights right here immediately. Remember to Bookmark this page and come back often to check for the latest updates!
Want to see our full, interactive chart breakdown? If you want to learn how to draw weekly VPFR, Fibonacci, EMA Ribbon, MACD, Supertrend, and S/R Flip frameworks designed for real trading decisions. Please browse the following『Further Reading』links. Fundamental news tells you what happened. Technical analysis predicts what will happen. To master the professional framework that separates market signal from noise, explore our exclusive models at https://www.chart-blitz.com/fxcx-app/omni-chart.html?symbol=SOL.
Trading Plan Table
| Scenario | Trigger | Targets / Conditional References | Invalidation | Risk Logic |
| Bullish | 4H acceptance above $107.42 and successful retest; Daily close above $120.90; Weekly reclaim and hold above $115.05 | $112.97 first visible 4H extension; $120.90 daily interrogation level; $141.36 visible chart annotation / safer confirmation zone; $154.17 daily conditional reference after acceptance | Failure back below $102.39, then $98.44; Daily rejection below $120.90 | Do not chase $100. Let breakout prove acceptance. S/R Flip must convert resistance into support before risk expands. |
| Bearish | Rejection at $107.42 or failure before/at $120.90; 4H loss of $102.39 | $98.44, $95.67, $90.59; deeper weekly risk references include $67.01 visible chart annotation / conditional stop-loss level | Bearish pressure weakens if SOL reclaims $107.42, holds retest, and closes above $120.90 | Short covering can fade fast. If reclaimed levels fail, the rally may have been liquidation fuel, not structural demand. |
| Neutral | Price rotates between $102.39 and $120.90 without decisive closes | Range trading only for disciplined risk managers; no forced directional target | Breakout above $120.90 or breakdown below $102.39 ends range bias | Range markets punish impatience. Avoid converting every candle into a thesis. |
| Structural Repair Watch | Weekly hold above $115.05, then progress toward $141.36 | $141.36 visible chart annotation / safer confirmation zone | Failure below $96.61 weakens tentative long thesis; $67.01 chart-marked stop-loss reference terminates deeper thesis | Weekly structure decides whether this is a bounce or a repair. $96.61 and $141.36 are annotations, not guarantees. |
📚Further Reading:
To help everyone gain a deeper understanding of the various technical indicators mentioned in this article, we have specially prepared the following further reading materials. These cover key analytical tools found across the weekly, daily, monthly, and 4-hour charts.
- Decoding Fibonacci Retracement: The Perfect Blend of Natural Law and Market Psychology — Fibonacci Retracement is not just a set of magical numbers; it is a manifestation of market psychology. Learning how to correctly draw and interpret Fibonacci levels is a required course for every serious trader.
- Is a Major Move Hiding in Plain Sight? Dow Theory May Already Know the Answer — As retail traders continue to chase short-term signals, experienced market readers are looking deeper — into trend structure, volume behavior, and market phases that may expose the early clues of a coming breakout.
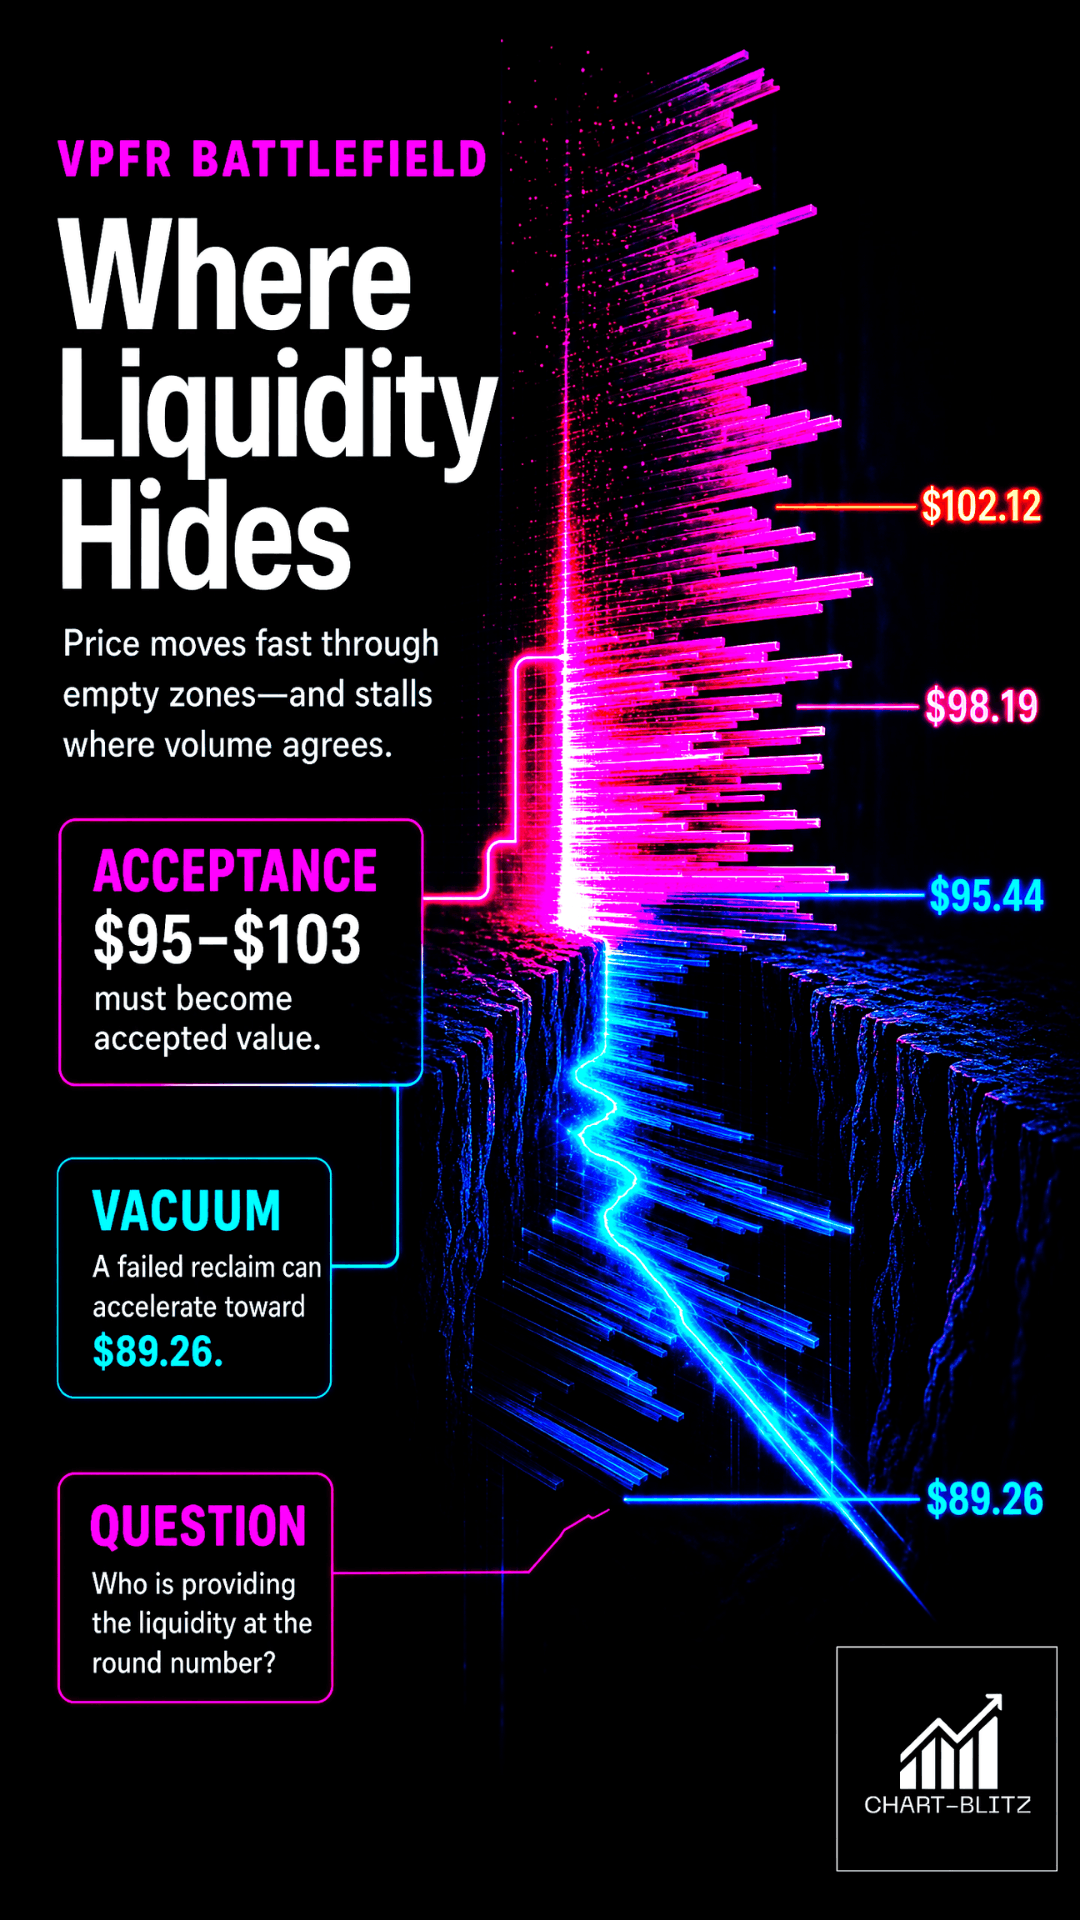
- Understanding VPFR: Finding the Hidden Footprints of Market Makers — The Volume Profile Fixed Range (VPFR) is a powerful tool that tells us where the most trading occurred within a specific price range. This helps us identify true support and resistance levels, as well as potential ‘Vacuum Zones’.
- S/R Flip Support and Resistance Swap Strategy — S/R Flip is one of the most powerful concepts in technical analysis. This article uses real cases to teach you how to use S/R Flip to capture the highest win-rate trading opportunities.
- MACD Momentum Indicator Momentum First — What Does the MACD Line Crossing Above Zero Mean? Golden Cross & Divergence Signals!
- Gann Fan Masterclass — Deep dive into W.D. Gann’s angle theory to identify the geometric relationship between time and price in the market.
- Strategies for EMA Ribbon Bearish Alignment: Dead Cat Bounce or Real Reversal — Deep dive into the EMA Ribbon to understand the battle between short-term and long-term capital.
- Bollinger Band: Long-Term Repricing Zone — The Ultimate Tool to Capture Massive Market Moves Tired of getting shaken out of winning trades too early? Or buying right before a trend reverses? An ex-banker reveals how to use the Bollinger Band to filter out market noise and ride the big waves.
- KDJ Stochastic Indicator Bottom Confirmation — What is the implication of a downward-curving KDJ? Understand in one article how to use dynamic indicators to catch market turning points.
【Disclaimer】 The content herein is for educational purposes and reflects the author’s personal opinion only; it is not investment advice. All financial investments, including cryptocurrencies, carry significant risk, and you could lose your entire capital. To support this site, this article may contain affiliate links. While we strive for accuracy, we cannot guarantee all information is complete or error-free. Please conduct your own research and be fully responsible for your own investment decisions.